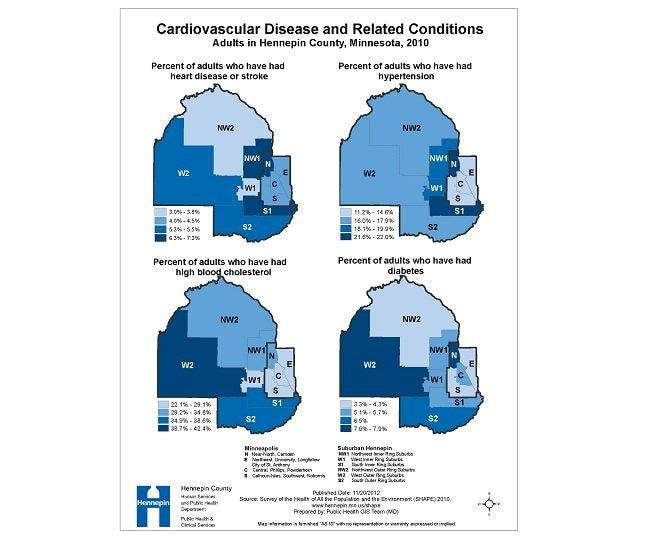
Using hypertension as example, the rates in North Minneapolis and inner suburban rings are higher than the rates in other parts of city of Minneapolis, and outer suburban ring. However, for diabetes, rates are higher in the North Minneapolis and West and South suburban rings. There is no clear pattern among these four chronic disease and conditions in geographic distributions. This could be partially due to the fact that the rate is not age-standardized or could reflect differences in access to care.
The purpose of this map is to show the geographic variation of four cardiovascular disease and related conditions in a single map, and to allow examination of patterns or correlations. This map, along with the map on CVD death rates and the map on lifestyle and risk behaviors, informs local health department management, program staff, and relevant community groups and organizations of the burden of the CVD and stroke in the county, and to guide and monitor the focus of public health intervention.