Data and Statistics

National Trends in COPD
Learn how chronic obstructive pulmonary disease (COPD) prevalence and deaths have varied across the years.
State-level Estimates of COPD
Learn how chronic obstructive pulmonary disease (COPD) prevalence and deaths vary across states.

County-level Estimates of COPD
Learn how chronic obstructive pulmonary disease (COPD) prevalence varies across counties.
COPD Death Rates in the United States
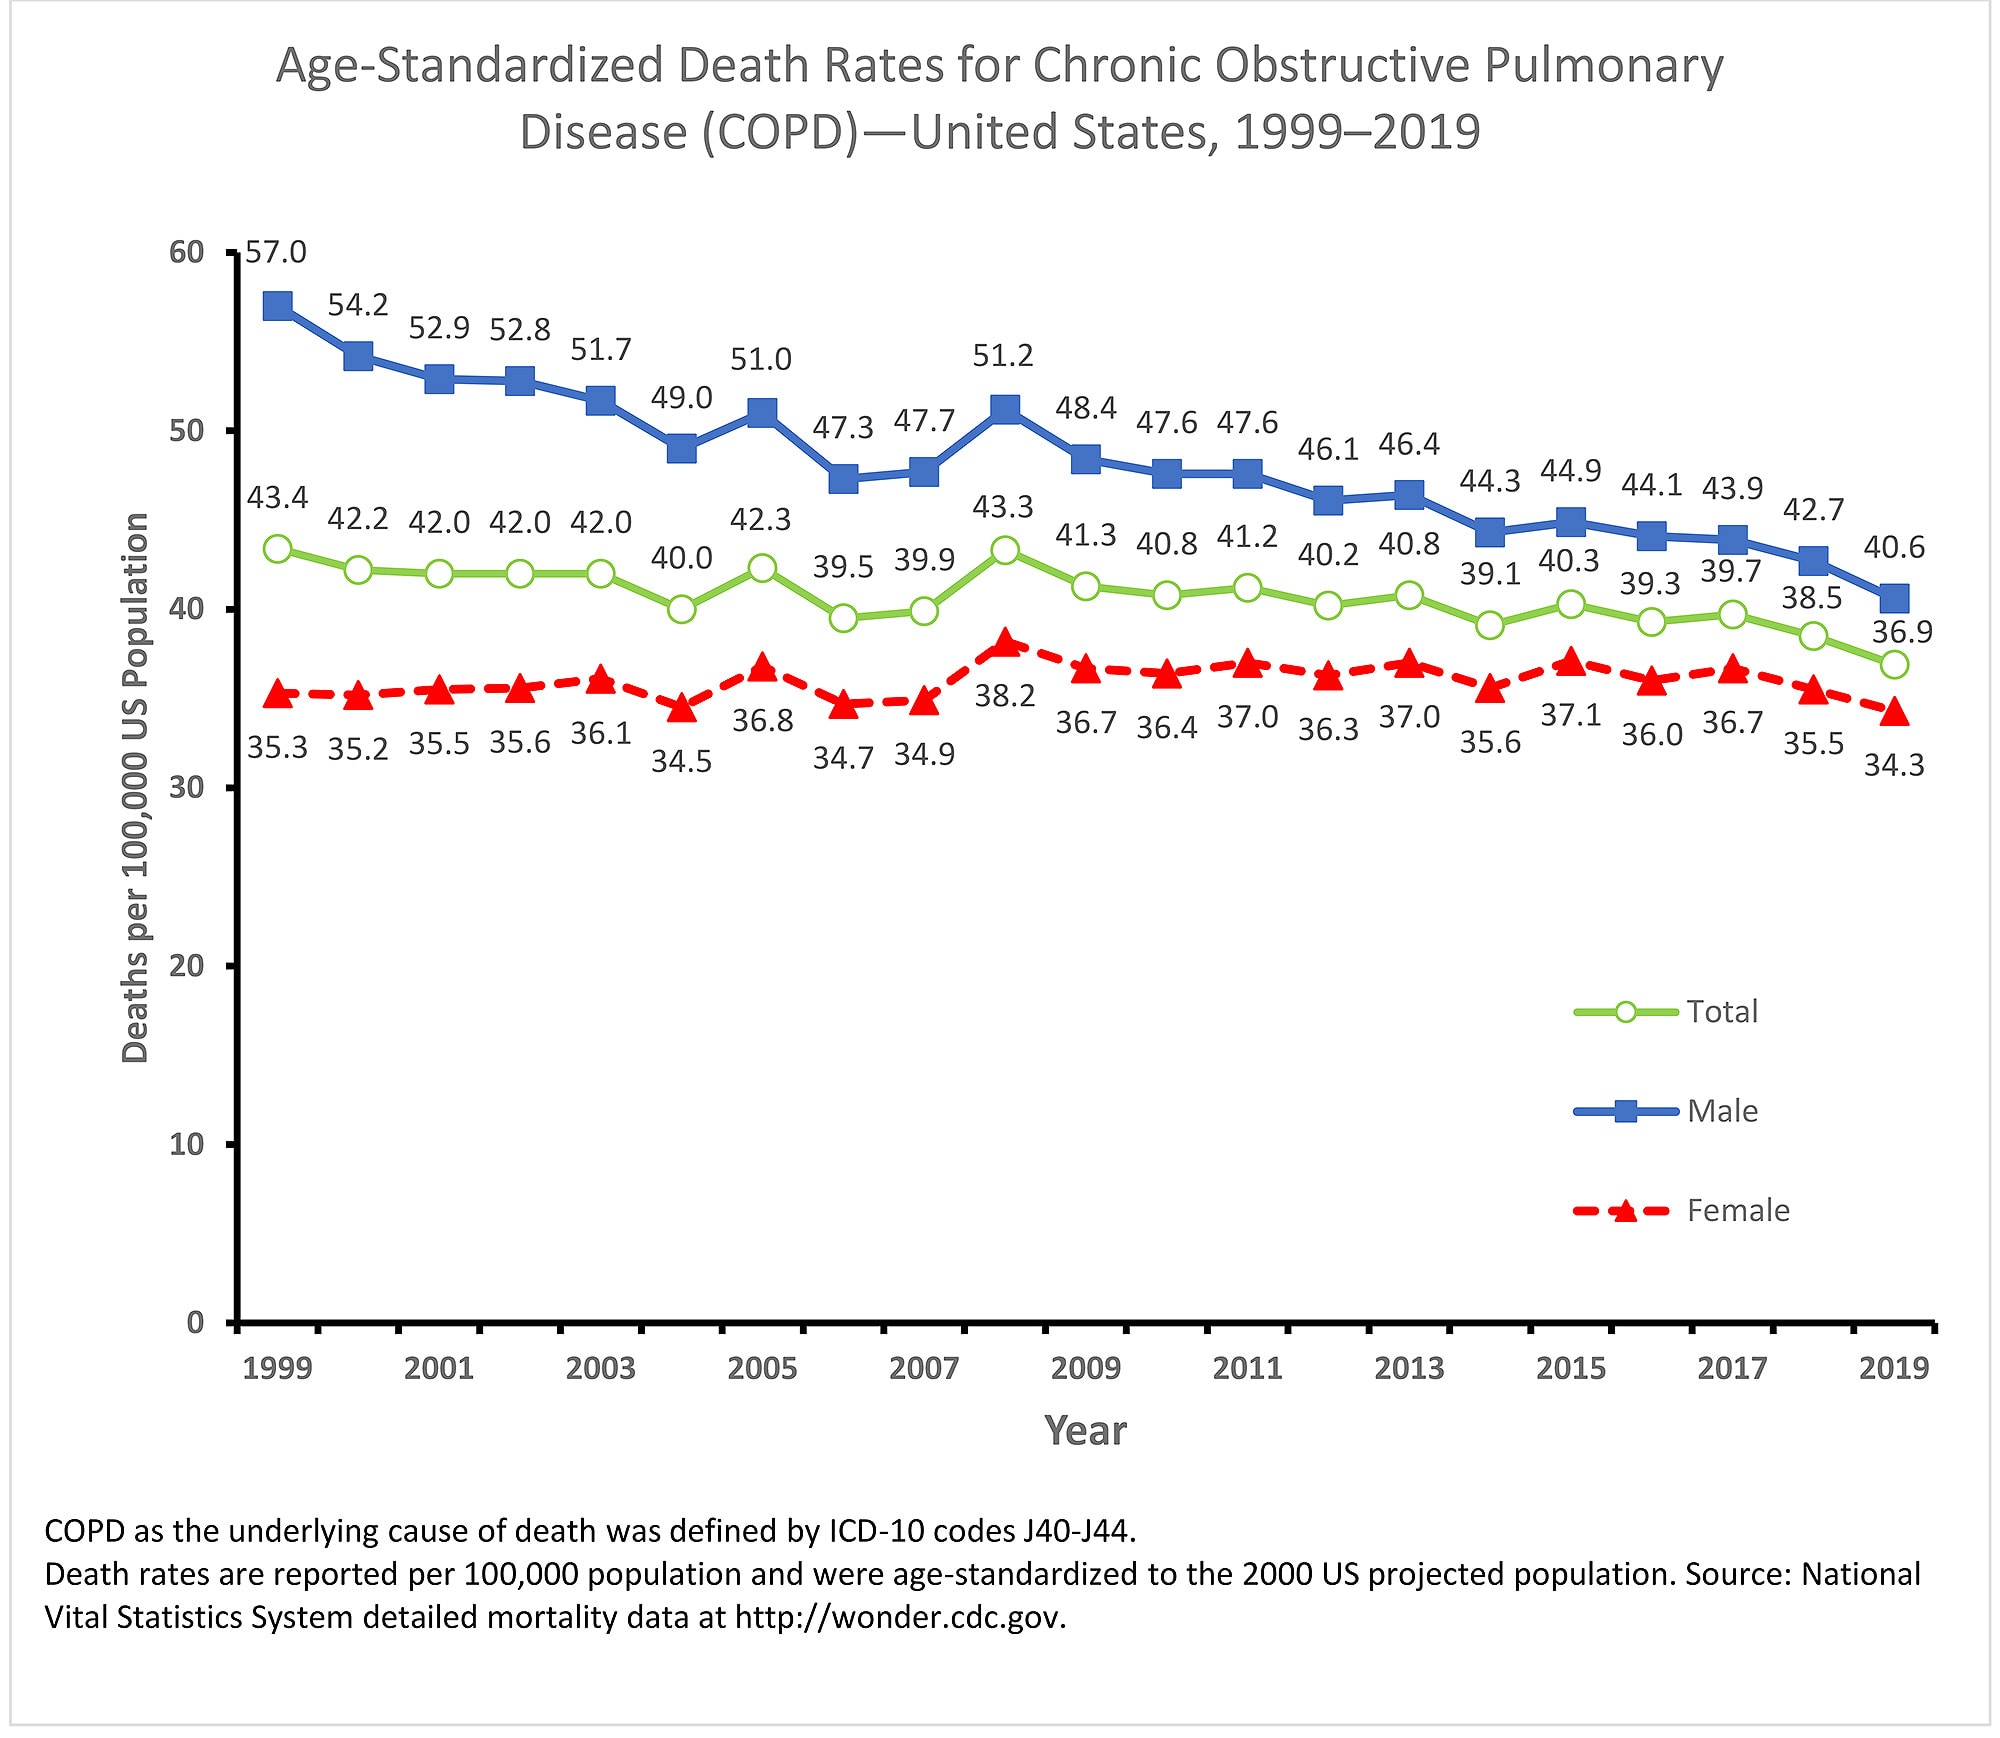
Age-adjusted death rates for COPD were significantly lower in 2019 compared with 1999 among US men (57.0 per 100,000 in 1999 and 40.5 per 100,000 in 2019) and among US women (35.3 per 100,000 in 1999 and 34.3 per 100,000 in 2019). Age-adjusted death rates varied between states in 2019 and ranged from 15.5 per 100,000 in Hawaii to 61.4 per 100,000 in Kentucky. States with the highest COPD death rates were clustered along the Ohio and Mississippi Rivers.

COPD Prevalence in the United States
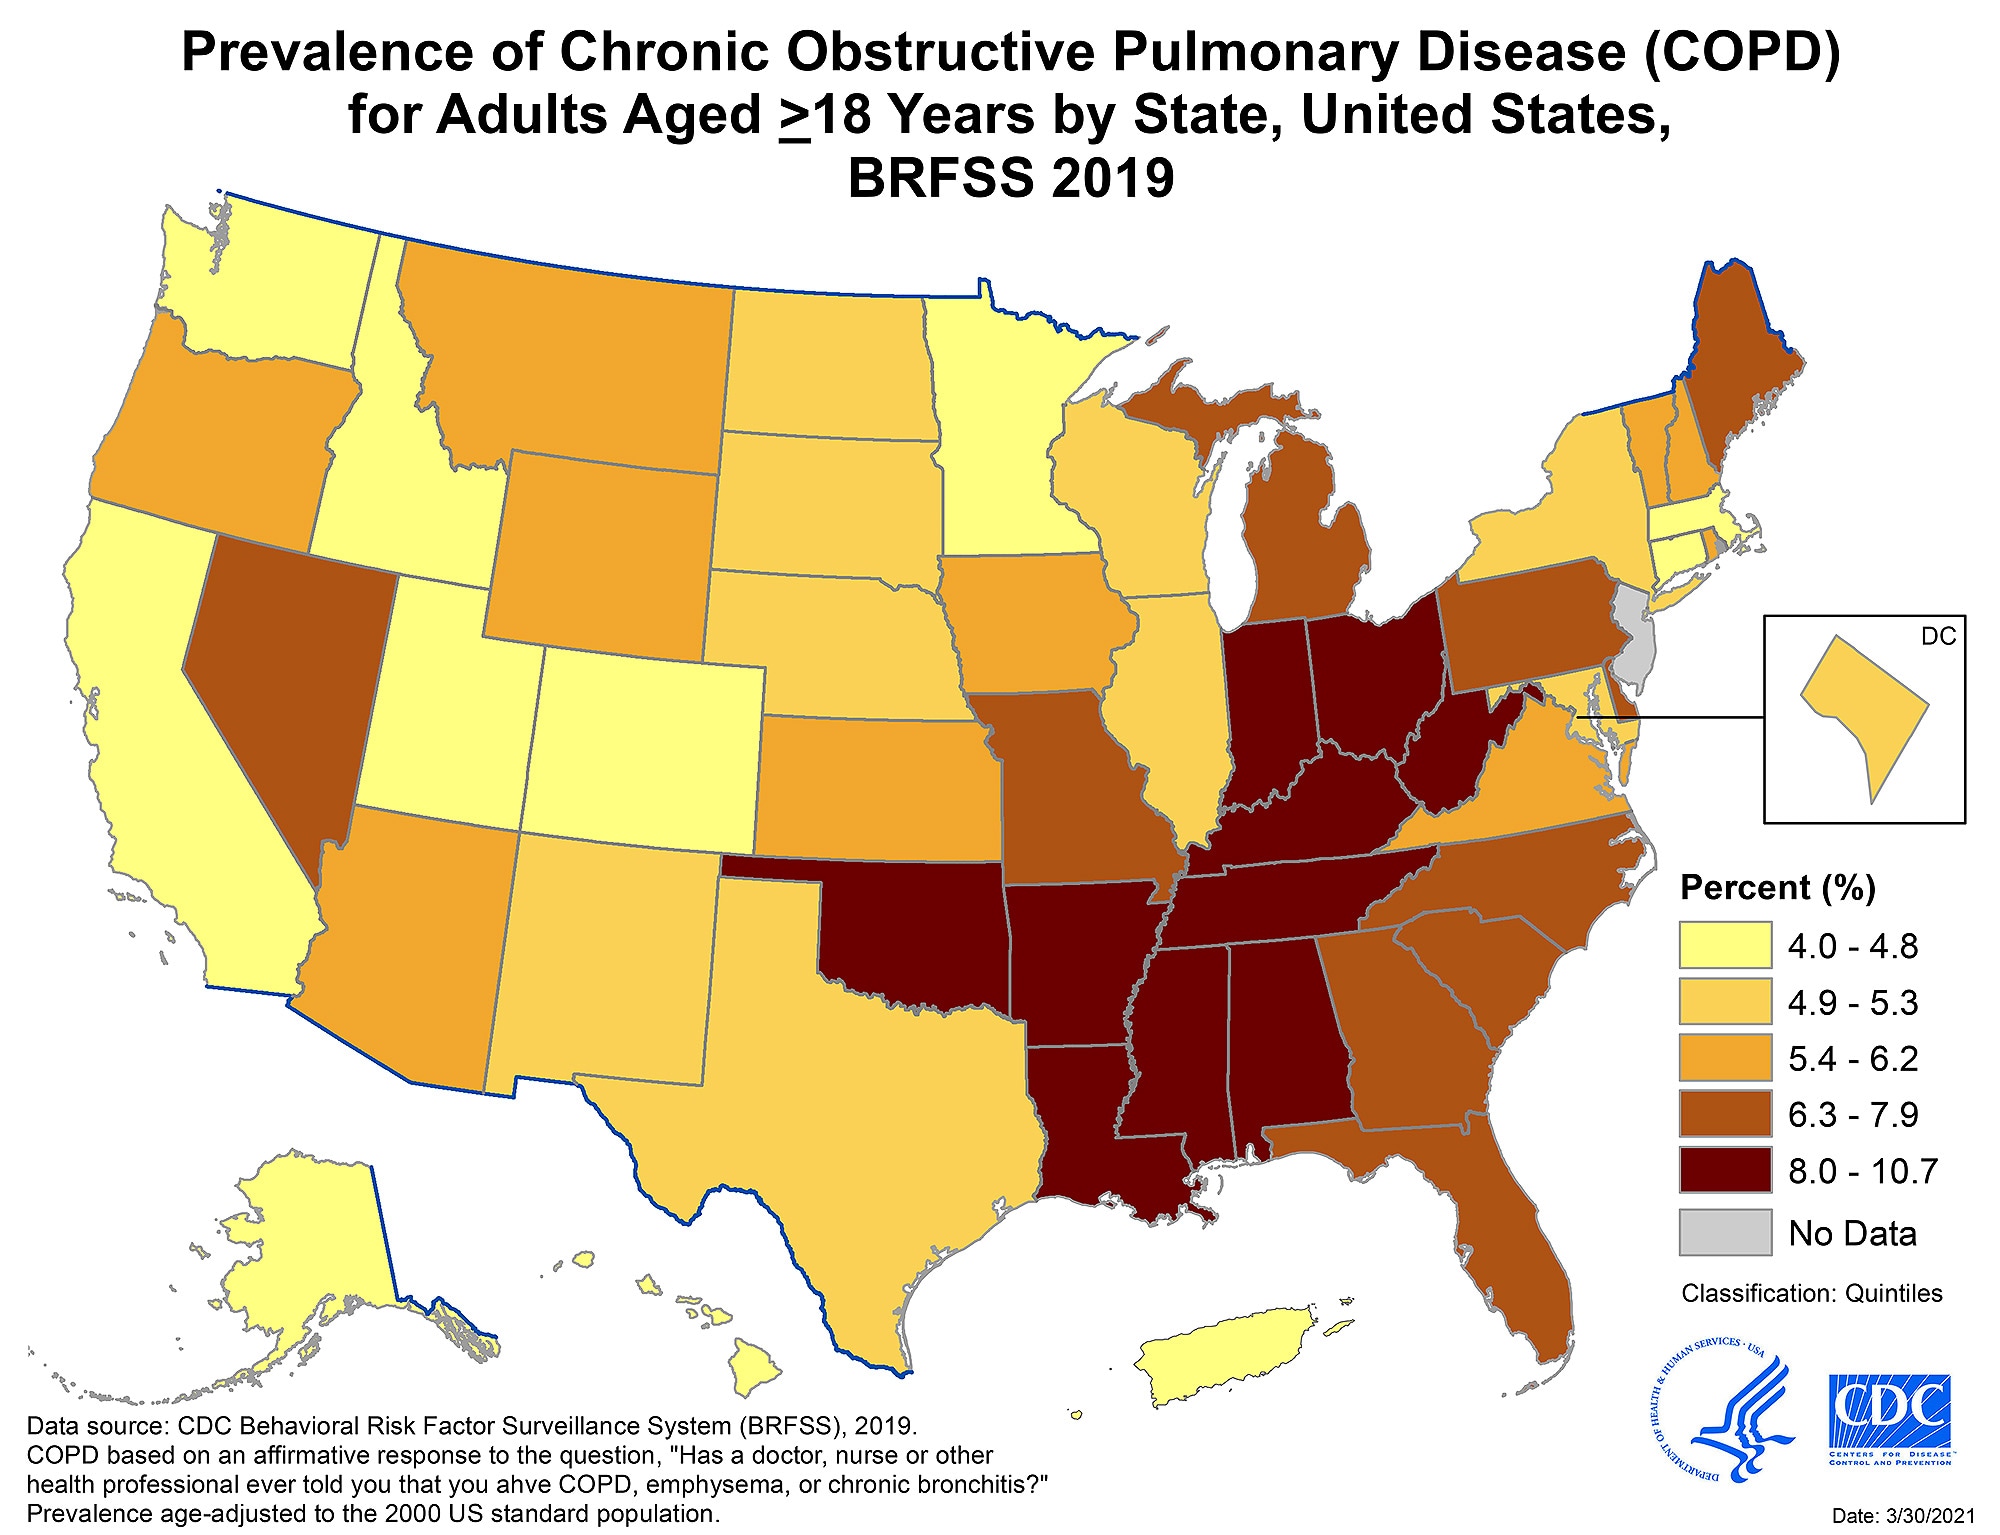
The figure shows age-adjusted prevalence of COPD among adults in the United States during 2019. The prevalence of COPD varied considerably by state, from <4.5% in California, Colorado, Hawaii, Massachusetts, Minnesota, and Utah to >9% in Alabama, Arkansas, Kentucky, and West Virginia. States with the highest COPD prevalence were clustered along the Ohio and lower Mississippi Rivers.
Although the Behavioral Risk Factor Surveillance System (BRFSS) survey provides data critical for monitoring national and state population health, it does not have sufficient samples to produce direct survey estimates for most counties or subcounty areas. Therefore, as part of PLACES, BRFSS data were used to develop statistical models that estimate COPD prevalence at different geographic levels, including counties, places (incorporated and census designated places), census tracts, and ZIP Code Tabulation Areas (ZCTAs) across the United States. These estimates can be used in a variety of contexts and meet the diverse small-area health data needs of local policy makers, program planners, and communities for public health program planning and evaluation. The maps below present model-based COPD prevalence estimates by county and census tract.
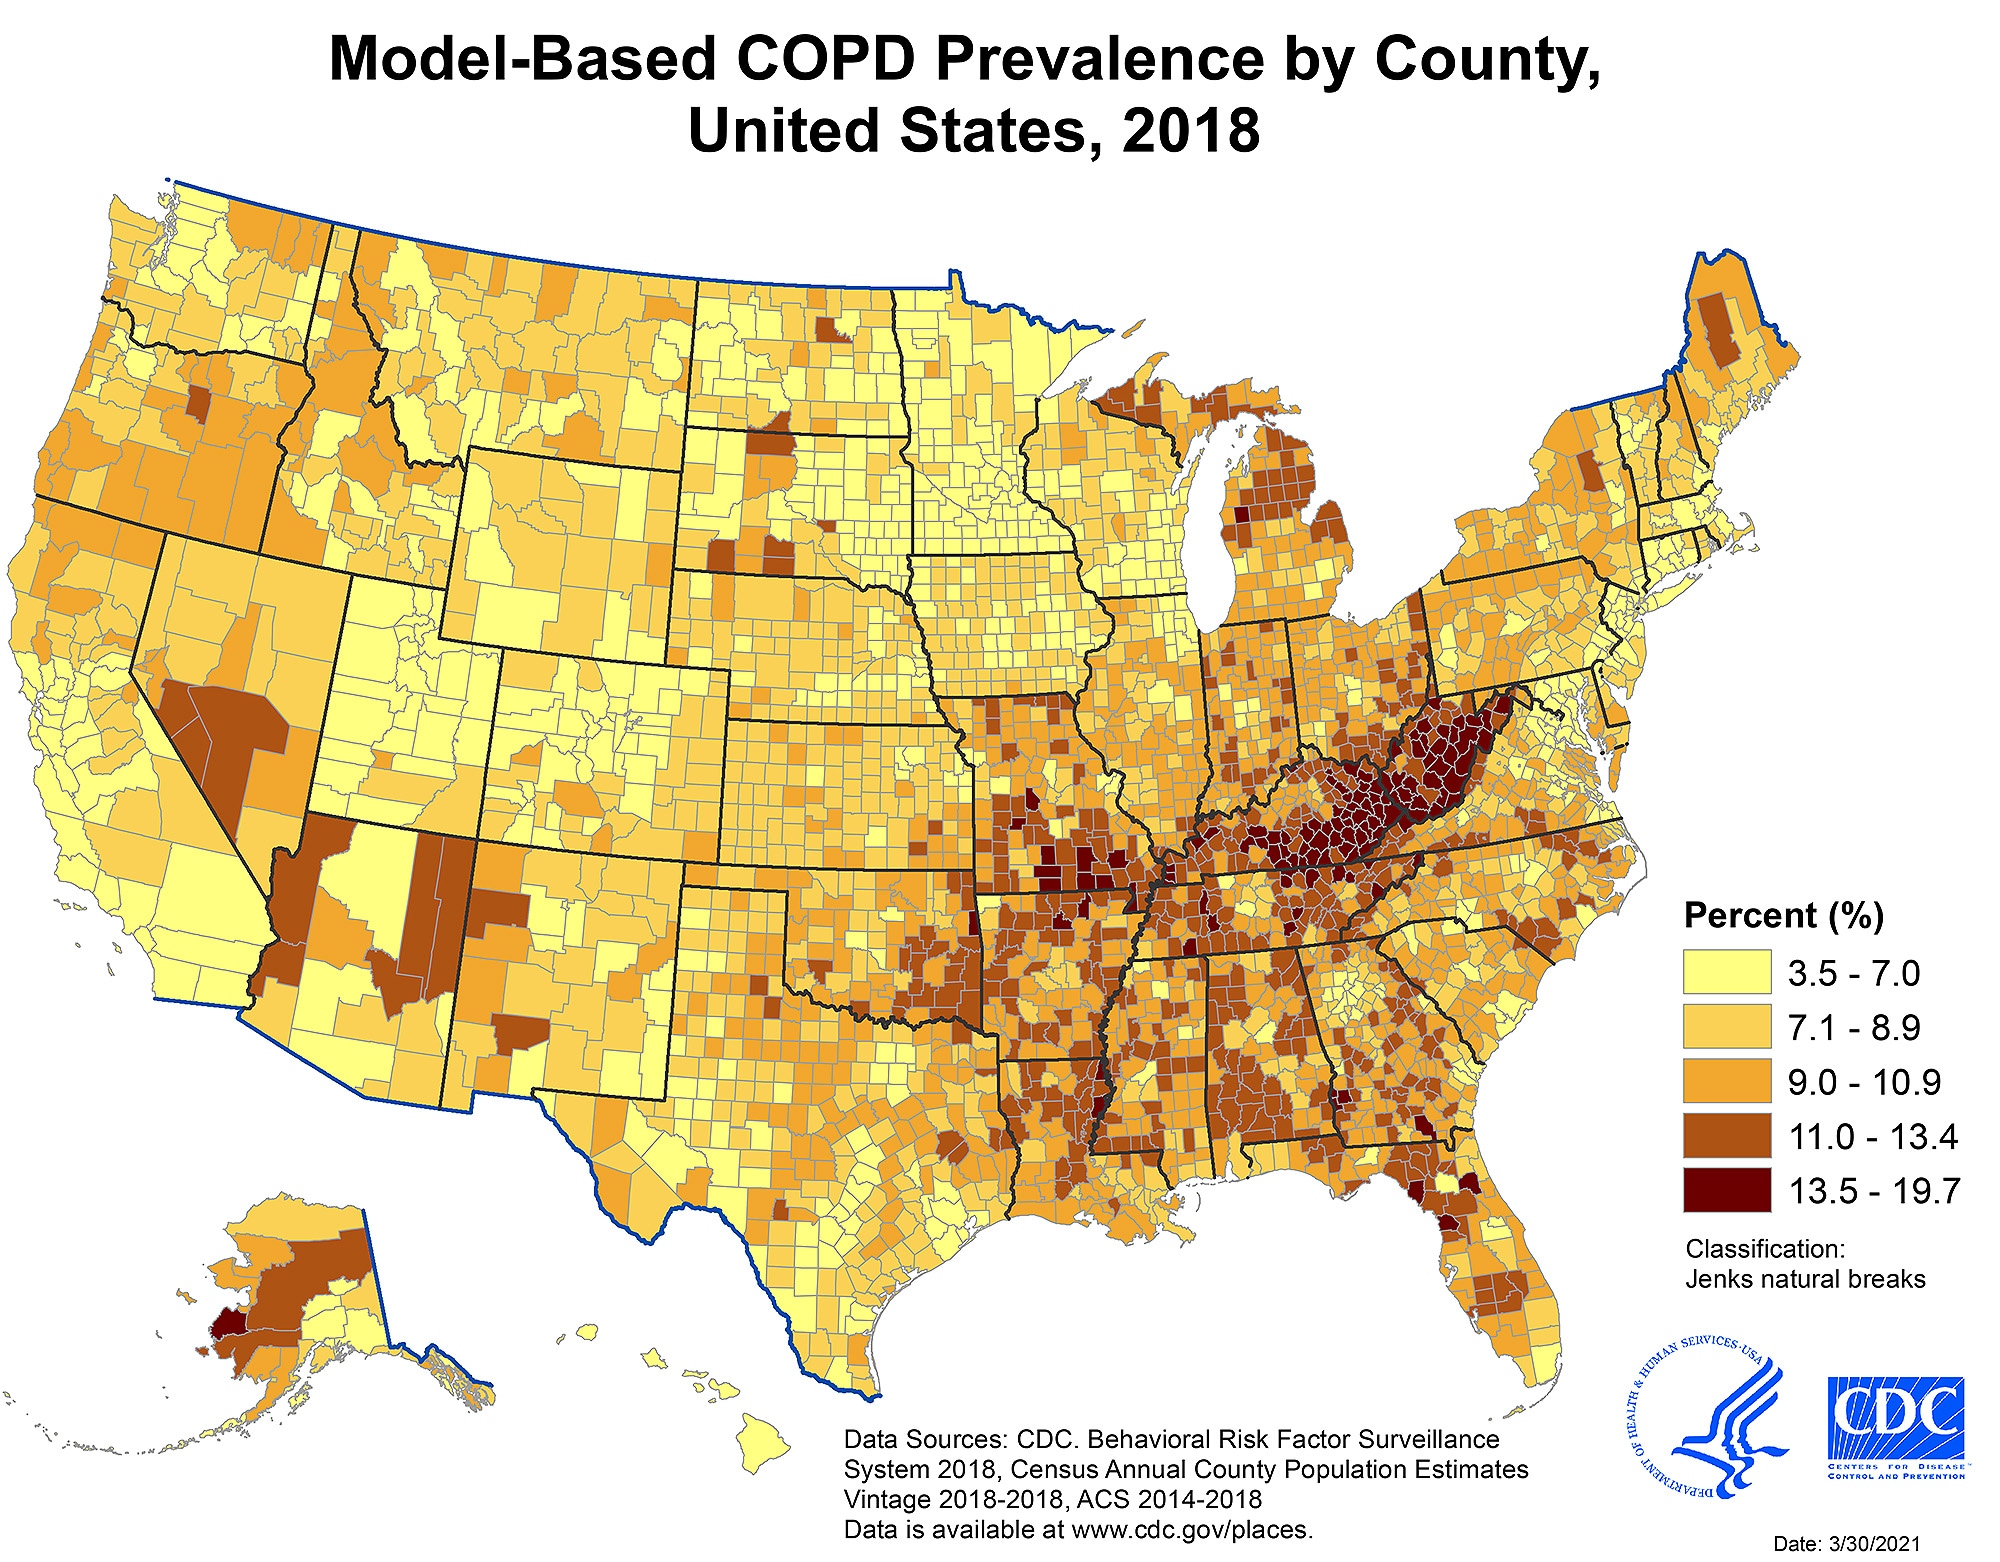
The figure shows model-based county-level prevalence estimates of COPD among adults in the United States during 2018. Counties with the highest model-based COPD prevalence estimates were clustered along the Ohio and lower Mississippi Rivers.
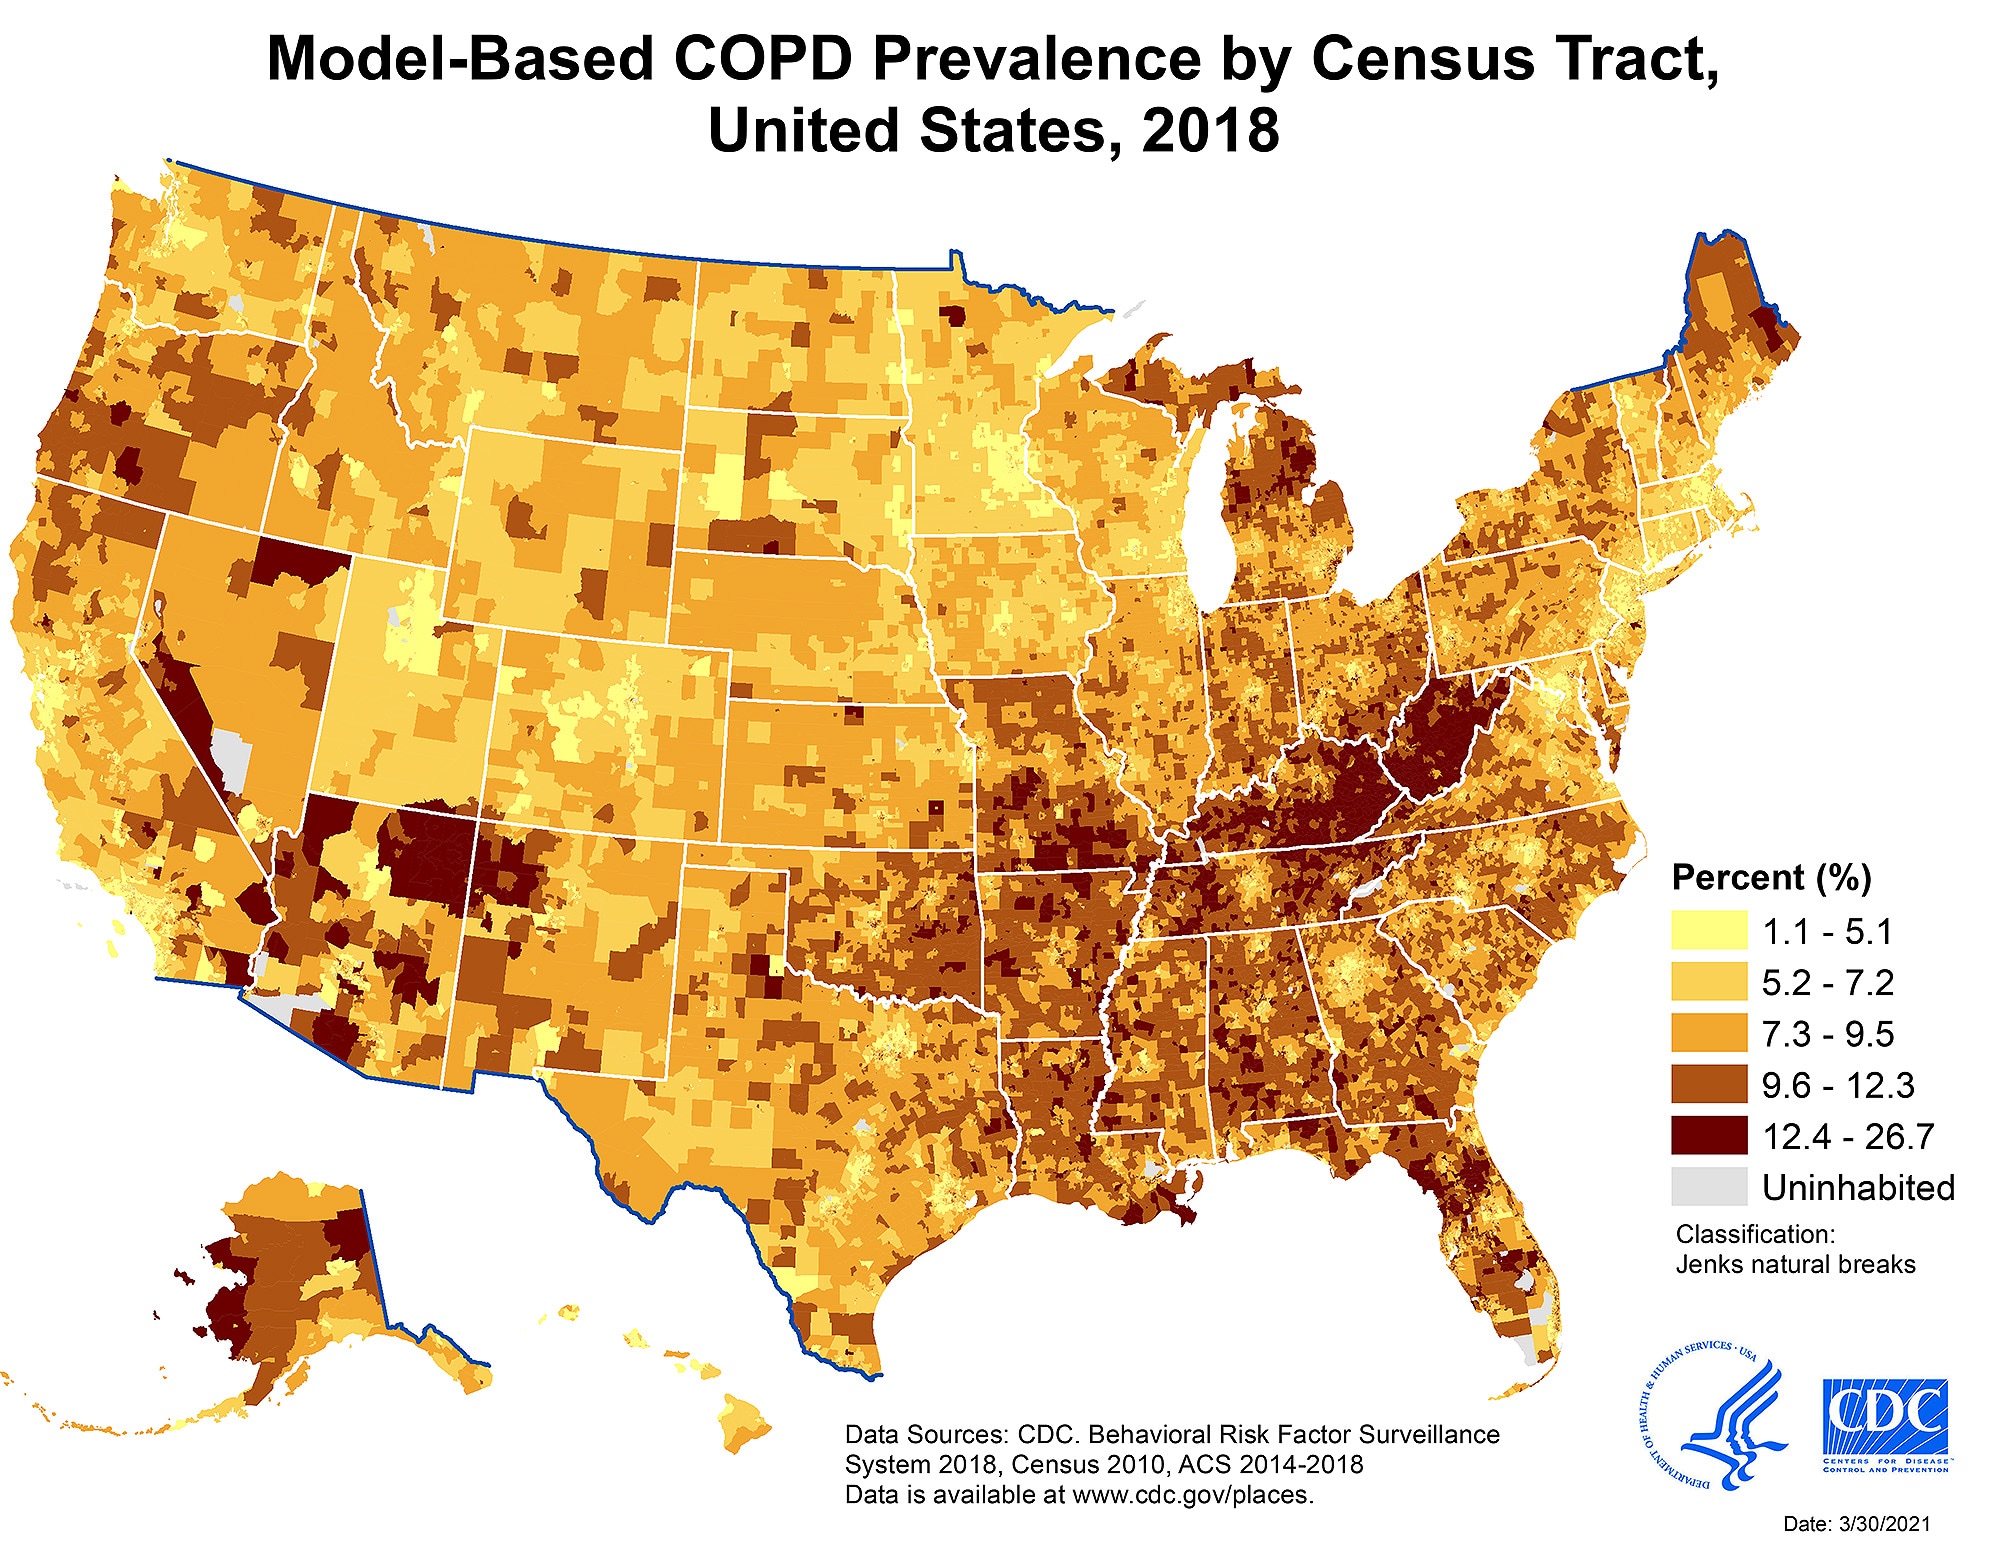
The figure shows model-based census tract-level prevalence estimates of COPD among adults in the United States during 2018. Census tracts with the highest model-based COPD prevalence estimates were clustered along the Ohio and lower Mississippi Rivers.