State-led Vulnerability Assessments
In 2018, CDC released emergency funding in response to the opioid overdose epidemic and launched activities to directly fund 41 states and the District of Columbia to develop and disseminate jurisdiction-level vulnerability assessments (JVAs). The Council of State and Territorial Epidemiologistsexternal icon (CSTE) was funded to provide technical assistance to these jurisdictions to complete the JVAs.
The assessments used local data to identify sub-regional areas at high risk for opioid overdoses and/or bloodborne infections associated with non-sterile injection drug use (IDU). Jurisdictions then used the findings to identify prevention and intervention gaps and develop and initiate multi-sector plans to address gaps. Findings from the JVAs may differ from the national assessment due to differences in methods or changes in outcomes over time. These potential differences should be considered when making decisions about prevention planning and interventions. The national assessment provides useful and consistent information across the country. The JVAs provide a timely and sensitive portrait of local needs to inform prevention planning and rapid scale-up of targeted services.
To complete the assessments, six main steps were applied by jurisdictions, with support from CSTE, to identify sub-regional areas at high risk for opioid overdose or bloodborne infections from non-sterile injection drug use. This information was used to develop and initiate implementation of plans to address prevention and intervention needs.
Indicator Identification
The first step was to identify and prioritize indicators that were timely, available at the sub-regional level (e.g., county, ZIP code), and associated with the outcomes of interest, such as overdose deaths or new hepatitis C virus (HCV) infections. Core indicators used by states included: socio-economic indicators – employment status, poverty status, income, and health insurance coverage; opioid-related indicators – drug overdose mortality, opioid prescriptions, buprenorphine prescribing potential by waiver, drug-related arrests; and infectious disease indicators – acute HCV infection rate, endocarditis hospitalizations.
Data Collection and Exploration
The second step was to compile and analyze the indicator data. Data used in assessments varied from state to state, but a number of sources were fairly common and included: American Community Survey, Behavioral Risk Factor Surveillance System, National Notifiable Disease Surveillance System (NNDSS), Prescription and Drug Monitoring Programs, US Census, and vital records.
Health department staff in some states then visually explored data using geospatial software to identify patterns across the jurisdiction and qualitatively identify areas with overlapping risk factors. This was done to gain a better understanding of the data, such as data completeness, extent of ‘zero’ values, distribution, and preliminary geographic variability.
Developing the Assessment: Overview of the Three Primary Assessment Approaches
The third step was to develop the assessment. There were three primary analytic approaches applied:
- Composite Index Score. The Composite Index Score approach is based on the Social Vulnerability Index developed by the Geospatial Research, Analysis, and Services Program (GRASP). For JVAs, indicators appropriate to opioid-related vulnerability were used rather than the natural disaster and response related indicators used in the Social Vulnerability Index.
- Statistical Modeling. Statistical modeling was used to identify the specific factors associated with the outcome(s) of interest for a specific jurisdiction. Using this approach, analysts could calculate an estimated rate of the outcome of interest and better understand the key factors affecting that community.
- Spatial epidemiology. Spatial epidemiology addresses the place component of the epidemiologic triad – person, place, and time – by using multiple layers of georeferenced data to achieve a more granular understanding of the outcome of interest within a community or other defined geographic area. Several jurisdictions used spatial epidemiologic approaches to assess opioid-related vulnerability, often displaying results using choropleth maps and conducting drive time analyses to assess access to prevention services.
Identifying Prevention Gaps
After conducting assessments, jurisdictions further examined higher vulnerability areas to identify what services and resources were available in those areas to mitigate these risks (e.g., higher opioid prescription rates). These gap identification efforts typically involved engaging local stakeholders, such as county programs and providers, to analyze findings, identify services and resources, and provide feedback. For example, it was found that some counties were providing rapid HIV testing services or syringe services programs outside of their catchment areas to address the lack of services available in the other counties. Alternatively, jurisdictions created lists of community-based programs and providers of treatment services and compared the locations of those to the identified highly vulnerable communities to see where pockets of need still existed.
Developing Plans to Address Gaps
The fifth step was to develop plans to address the identified gaps in services. This activity also centered around stakeholder engagement. Often, models of services that worked well in one area of the state were leveraged to help plan for other areas where a community was experiencing a similar gap in service. New developments in treatment and harm reduction and increasing awareness and provision of education around medications for opioid use disorder were activities included in plans to address gaps in services.
Collaboration, Communication and Dissemination Strategies
Throughout the process, jurisdictions used a variety of strategies to engage and communicate with stakeholders and to disseminate assessment findings. Frequently, existing stakeholder groups and public health partners were engaged early in the assessment process to discuss the goals of the project, potential indicators for outcomes of interest, and data sources. Health departments found that leveraging existing relationships and coordinating with partners already implementing prevention strategies to address opioid use and associated bloodborne infections was most effective in securing buy-in and participation. Results were communicated using the health department website, newsletters, community meetings, webinars, and state legislative briefings. In the final stages of the assessments, stakeholders reviewed the draft plan to address intervention gaps and provided feedback prior to finalization and implementation.
CSTE Jurisdiction Vulnerability Assessment Toolkit
CSTE, in partnership with CDC, developed a toolkit of resources for jurisdictions planning to conduct or update their assessments in the future. This toolkit provides guidance, tools, and additional examples of state-led assessments for epidemiologists and other public health professionals seeking to assess their jurisdictions’ vulnerability level. The guidance in the toolkit reflects the technical assistance delivered to states in response to challenges and questions that arose during project implementation.
Illinois undertook their opioid-related vulnerability assessment to inform work at the state level to conduct prevention activities, such as working with local health departments to develop jurisdictional response plans. The Illinois team leveraged national (e.g., Census) and local data sources (e.g., NNDSS; vital records) to derive 30 independent variables at the ZIP code level to test for association with the outcome of interest: HCV infections in individuals younger than age 40; combining 2017-2018 data. Illinois employed Negative Binomial regression methods to account for overdispersion in the outcome. Regression models included counts of HCV infections among individuals younger than age 40 as the outcome and population as the offset to calculate predicted person rates. Bivariable regression modelling was completed for each independent variable; nine variables were not significantly associated with the outcome (p<0.05). The remaining 21 variables were added to a multivariable model, and backward selection was used to derive the final model with 11 statistically significant variables. Predicted person-rates were used as the final vulnerability scores and ranked for reporting and mapping.
Illinois mapped both rates and counts of combined HCV incidence and drug overdose for 2017-2018 along with the final vulnerability scores. Illinois found that ZIP code-level data gave far more detail than county-level maps, allowing local officials to focus on specific neighborhoods of higher vulnerability and higher observed outcome rates. Partners found outcome rates (for relative comparisons), case counts (for prioritizing resources) and vulnerability scores all to be useful. They further defined high risk as the 10% of counties with the most vulnerable ranks and plotted that in a separate map. In addition to standard static maps, an academic collaborator produced interactive maps using Cartoexternal icon.
Despite the large number of ZIP codes in Cook County (2019 population of over five million people), there was only a single ZIP code that was in the most vulnerable 10% of vulnerability scores. Therefore, Illinois did not highlight Cook County in the statewide maps; they plan to produce ZIP code-level maps specifically for Cook County and Chicago partners during their regional meetings. Overall, the Illinois team found that ZIP code data worked well for identifying vulnerable jurisdictions and provided an additional level of detailed information compared to conducting analyses solely at the county level.
The state used the assessment findings to inform prevention activities at the state level. They are working with two local health departments to develop jurisdictional response plans and invited all local health departments to review their findings and provide feedback. Local health departments said that the assessment served to quantitatively confirm the level of vulnerability that was previously only recognized anecdotally and to initiate conversations about how to turn assessment findings into a tool for informing prevention activities.
The Michigan Department of Health and Human Services (MDHHS) had started initial planning on how to address the opioid crisis for many months following the publication of CDC’s national vulnerability assessmentexternal icon, before the emergency funding in response to the opioid overdose epidemic was available, and so were ahead of schedule when starting their jurisdiction vulnerability assessment. MDHSS decided to apply CDC’s national vulnerability assessment as a model for their opioid-related vulnerability assessments. In addition, they had also formed eight stakeholder groups for the purpose of obtaining data on the needs for these programs. These stakeholder groups, which included surveillance program staff, epidemiologists, and vital record epidemiologists, were leveraged to advise on statistical approaches and data elements to include in the vulnerability assessment.
Before data collection began, MDHHS decided that to be considered for inclusion in the model, the data needed to be relatively recent; available at the county-level without a lot of null values; and be publicly available or already being collected by the state. Preferential consideration was given to data that were normalized to the extent possible (expressed as rate per 100,000 or as a proportion of the population) rather than raw numbers.
MDHHS initially cast a wide net, identifying 93 county-level variables known or plausibly associated with injection drug use. After review, 21 of those met their inclusion criteria. They used all HCV diagnoses (acute and chronic) in those younger than age 30 years as an outcome measure, knowing that for 90% of those individuals, drug use was reported. They also used the rate of accidental death by drug poisoning as an outcome variable. MDHHS used any drug overdose or poisoning and not just those attributed to opioids due to county level variability in medical examiners’ coding practices.
Independent variables included proportion without a vehicle, proportion without college education, proportion of non-family households, heroin treatment admissions per 100,000, neonatal abstinence syndrome cases per 100,000 births, and sexually transmitted infections per 100,000. MDHHS initially included the rural-urban continuum as an independent variable but due to the large number of rural counties compared to urban, results appeared biased toward identifying rural areas as more vulnerable. After receiving technical assistance, they adjusted their analysis to better predict the expected outcome.
Factors associated with the two outcomes of interest (HCV infection and fatal drug poisoning) were each modeled using negative binomial regression. Model-estimated rates for HCV infections and fatal drug poisonings were individually considered as proxies for vulnerability. The estimated rates were ranked from lowest to highest, with the highest rankings indicating considerable vulnerability.
Questions about the model output (e.g., county vulnerability rankings) required further review. Thus, maps were developed to show significant variables compared with the model estimates. Critical variables with large variance and high null values prompted combining data across multiple years. Maps and other data visualizations were used to determine if natural breaks or quartile groups were more appropriate. While quartiles are easy to understand, the natural breaks helped to quantify the magnitude of difference between data points.
MDHHS published the vulnerability assessments, coordinated regional meetings, developed a plan to increase harm reduction services, and conducted ongoing monitoring of HIV and HCV diagnoses related to substance use. MDHHS also regularly produces and disseminates reports to local health departments to alert them of increases in HCV diagnoses that might be associated with unsterile use of equipment to inject drugs. In addition, Michigan greatly expanded syringe services programs during 2018-2020, especially in geographic areas indicated to be vulnerable on the county-level vulnerability index. While MDHHS endorses availability of syringe services programs in all Michigan communities, the vulnerability study helped MDHHS programs prioritize areas for investment.
New York State Department of Health (NYSDOH) conducted their jurisdiction vulnerability assessment to identify potential gaps in the services they were already providing and to inform programs for continuous quality improvement of services. New York State has well-established statewide comprehensive harm reduction programs that are overseen and coordinated by the NYSDOH’s Office of Drug User Health, AIDS Institute (AI). Harm reduction initiatives such as syringe services programs, are community-based prevention programs that can provide a range of services, including linkage to substance use disorder treatment; access to and disposal of sterile syringes and injection equipment; and vaccination, testing, and linkage to care and treatment for infectious diseases. In addition, NYSDOH works with local county health departments and community-based organizations to tailor needs-based trainings and provide logistics support to programs. NYSDOH also collaborates with law enforcement agencies, emergency medical services, and the state Department of Corrections and Community Supervision to provide services to those in need. These initiatives have been highly effective in preventing opioid overdose deaths, transmission of bloodborne infections, and understanding barriers and needs for effective treatment and relinkage to care. More detailed information on NYSDOH programs and services targeted to persons who inject drugs and for opioid overdose prevention can be obtained at the department’s websiteexternal icon. Stakeholders for their vulnerability assessment included the offices and bureaus that are responsible for surveillance, data collection, and conducting prevention activities and services, such as those described above.
NYSDOH used a multivariate Negative Binomial modeling approach for their analysis with the Opioid Burden Index (OBI) as the dependent variable. The OBI, available on the New York State Opioid Dashboardexternal icon, is a combination of three components, outpatient ED visits; hospital discharges for non-fatal opioid overdose, abuse, dependence, and unspecified use; and opioid overdose deaths.
To identify potential gaps in their service provision, NYSDOH examined the distribution of harm-reduction programs based on both model-estimated vulnerability rankings and observed OBI. The vulnerability assessment results were used to examine (a) counties with syringe services programs and (b) counties in which resources were allocated based on the OBI.
Specifically, NYSDOH sought to better understand potential prevention gaps in three areas:
- Highly vulnerable counties with no or very few syringe services programs: Usually syringe services program locations are strategic, and counties with no syringe services programs may be served through adjoining county programs. Working with their program staff, NYSDOH wanted to understand whether counties with higher vulnerability were in the catchment areas of syringe services programs located in adjoining counties, and whether they were being adequately served.
- Highly vulnerable counties that were ranked low on the observed Opioid Burden Index: These counties were identified as opportunities for program staff to consider additional information in planning and development or to extend intervention strategies and services.
- Distribution of prevention programs, providers, and the services and tests available in different counties: Service accessibility was assessed using a similar evaluation technique as was used to identify highly vulnerable counties with no or very few syringe services programs.
For the NYSDOH project team, this assessment was an iterative process of using the county-level data to help identify gaps in the county’s understanding and examine various approaches to address county-specific needs. Learning and sharing examples of what works well at the local level, such as academic detailing and engaging prescribers to provide buprenorphine, a medication for opioid use disorder, also bolstered local response to the opioid crisis.
Oregon’s County-Level Jurisdiction Vulnerability Assessment aimed to better understand the areas within the state at risk for opioid-related harm and in need of prevention services. The team applied spatial epidemiology using a variety of choropleth map approaches. Oregon used multiple methodological approaches beginning with a high number of key indicator variables that were reduced using backward stepwise regression modelling until only significantly associated variables were included. Their final model included four variables: high intensity drug trafficking area, premature deaths, risky opioid prescribing, and lack of transportation or vehicle availability. Using this final model, a vulnerability score was generated. Oregon used Esri ArcGISexternal icon, a geographic information system, to generate a map showing the overall vulnerability scores using Jenks natural breaks to categorize variable values into groups described as: lowest, low, mid-range, high, highest priority for intervention as shown in the Figure.
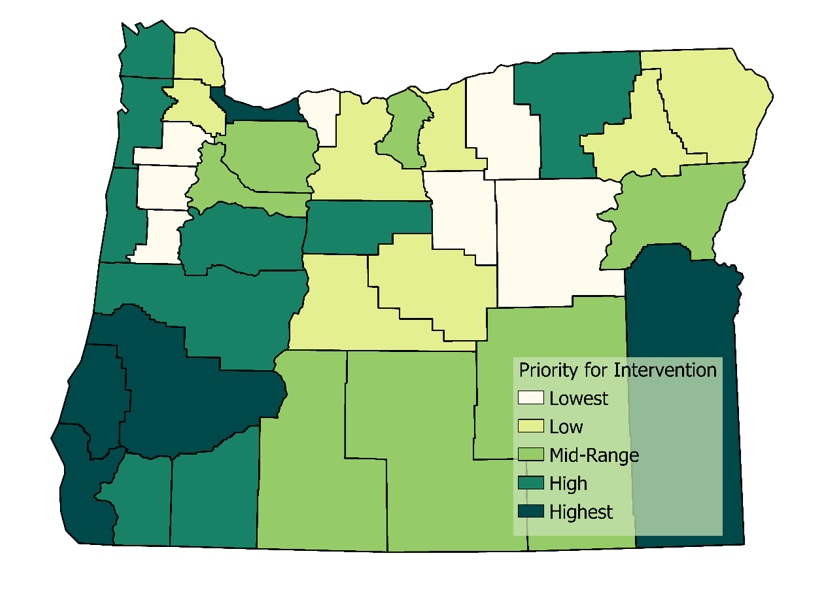
Figure: Jurisdiction Vulnerability Assessment Groups in Oregon
Oregon also produced a similar stylized county-level map for each variable in the final model. Categorical breaks in these maps were chosen based on the statistical properties of each variable mapped, and additional geospatial layers were added for context. For example, Oregon layered interstate and highway data on top of the county map showcasing high intensity drug trafficking areas. Layering these data helped demonstrate the reliance on interstate travel for drug movement.
Oregon faced limitations in their analyses due to the small number of counties in the state, which reduced their statistical power. Geographically, large sized rural counties made it difficult to discern elevated risk in communities within a county. Use of choropleth maps and contextual information gathered from other projects provided further detail of potential risk for use by stakeholders interested in these areas of Oregon. In addition, the findings were used to help prioritize regions of the state to promote harm-reduction interventions and decide where to allocate grant funds for opioid misuse prevention and screening for and treatment of infectious diseases related to injection drug use.
The Rhode Island Department of Health (RIDOH) employed a sophisticated statistical model approach featuring machine learning techniques for their 2019 opioid-related vulnerability assessment project. The model was proposed by Brown University partners and ultimately included more than 300 variables that explored units as geographically nuanced as census tracts and ZIP codes. Rhode Island’s administrative geography is limited to five U.S. counties, to examine population characteristics more closely, it was important and helpful to review census tracts and even ZIP codes in some cases. The granularity of census tract data helped the RIDOH understand and implement community-level approaches with greater detail and accuracy.
Input and output data from the model aligned well with overdose surveillance programs in Rhode Island that provided overdose death data, which were used as a proxy for injection drug use, HCV infection, and HIV incidence rates. Other critical variables included single member households, complete kitchen in housing units, divorce, housing unit type, race, less than $10,000 in annual income, and binary variables for non-employed households and households with no vehicles.
RIDOH used Esri ArcGISexternal icon, a geographic information system, to visualize the model results across census tracts. Using the scores from the machine learning model, tracts were ultimately ranked and categorized into groups from lower to higher vulnerability. Choropleth maps with shades of blue and red were used and worked well with audiences. Some risk factor data provided high enough definition to identify individual neighborhoods with heightened vulnerability. In addition to ESRI ArcGIS, Adobe Illustrator was used to inset the maps and publish content online as well as layer content onto Google Maps for street-level review.
For RIDOH, the JVA work has been a turning point in terms of advancing the Rhode Island’s HIV program, overdose prevention program, Health and Human Services programs, and for the Governor’s Overdose Prevention and Intervention Task Force. Overall, the work has generated much interest from other agencies and the general public. Maps were developed for and presented to community leaders in Providence and in rural areas of the state. Additionally, the RIDOH team offered extended 3-hour trainings for technical support in developing planning efforts and investment scenarios, and collaboration building.
Partnering with Brown University and other subcontractors helped RIDOH make use of detailed variables and geography, encouraging activities at the neighborhood level. A Request for Proposal (RFP) announcement was released soliciting proposals for the “Syringe Services Access and Drug User Health” program that includes syringe services, naloxone distribution, safe injection equipment, and referrals for overdose treatment where appropriate, particularly in vulnerable areas. RIDOH required applicants to use data provided by the map to ensure that they were reaching these vulnerable areas. RIDOH has continued to have ongoing discussions with key stakeholders including the City of Providence to identify future opportunities for collaboration. Overall, the assessment improved the understanding of essential services provided through these programs, leveraging additional sources of funding to address vulnerabilities and facilitating action-oriented successes.
- Californiaexternal icon
- Georgiaexternal icon
- Illinoisexternal icon
- Iowapdf iconexternal icon
- Kansaspdf iconexternal icon
- Mainepdf iconexternal icon
- Michiganpdf iconexternal icon
- Minnesotaexternal icon
- Mississippipdf iconexternal icon
- Missouripdf iconexternal icon
- New Jerseyexternal icon
- Oklahomapdf iconexternal icon
- Pennsylvaniapdf iconexternal icon
- Rhode Islandpdf iconexternal icon
- South Carolinapdf iconexternal icon
- South Dakotaexternal icon
- Utahexternal icon
- Washingtonexternal icon
- West Virginiapdf iconexternal icon
- Wisconsinpdf iconexternal icon