NoroSTAT Data
What this graph shows:
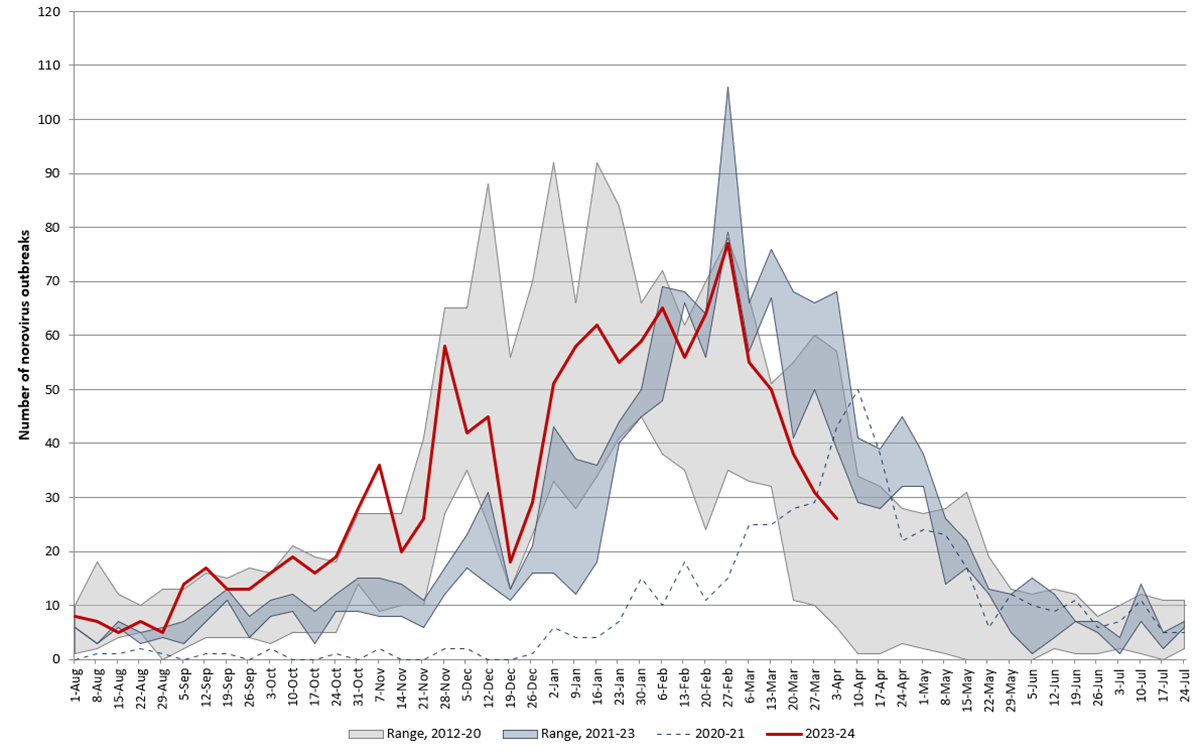
- The total number of suspected and confirmed norovirus outbreaks reported each week by states* participating in NoroSTAT.
- The gray area: highest and lowest number of norovirus outbreaks reported each week for the 2012 through 2020 seasonal years (August–July).
- The blue dashed line: data from the 2020-2021 surveillance year. During the initial months of the COVID-19 pandemic, reported norovirus outbreaks fell to unusually low levels, and therefore have not been added to the pre-pandemic range.
- The blue area: highest and lowest number of norovirus outbreaks reported each week for the 2021 through 2023 seasonal years (August–July). Outbreak data post-2021 are being monitored for changes to outbreak seasonality and trends.
- The solid red line: latest data for the current seasonal year (2023-2024). State health departments participating in NoroSTAT have 7 business days to report norovirus outbreaks to CDC.
A seasonal year’s line that consistently falls above the gray or blue areas, especially during the peak of the season (December to March), might indicate unusually high norovirus activity.
Number of Suspected or Confirmed Norovirus Outbreaks Reported by
NoroSTAT-Participating States Per Week, 2012–2024
See data table for this chart.
*reported by the state health departments in Alabama, Colorado, Massachusetts, Michigan, Minnesota, Nebraska, New Mexico, North Carolina, Ohio, Oregon, South Carolina, Tennessee, Virginia, Wisconsin, and Wyoming to CDC through the National Outbreak Reporting System (NORS) by week of illness onset, 2012–2024.
More information about the current norovirus season:
- During August 1, 2023–April 9, 2024, there were 1,208 norovirus outbreaks reported by NoroSTAT-participating states. During the same period last seasonal year, there were 986 norovirus outbreaks reported by these states.
- The total number of outbreaks reported during the 2023–2024 seasonal year is within the range reported during the same period during the 2012–2020 seasonal years.
- To see what norovirus genotypes are currently circulating in the United States visit the CaliciNet data page.