Services Program
The services sector is highly diverse, encompassing 11 major NAICS (North American Industry Classification System) industry groups. The National Institute for Occupational Safety and Health (NIOSH) Services Program works with partners in industry, labor, government, and academia to prevent and reduce illness and injury, such as the following (with examples of priority industries):
- Cardiovascular disease and reproductive disorders (education)
- Hazardous noise exposure and hearing loss (building services, entertainment)
- Musculoskeletal disorders (repair/maintenance, hotels)
- Falls (waste management, restaurants)
- Conduct research to identify the causes of work-related injury and illness among service workers.
- Develop and test interventions to reduce work-related injury and illness in the services sector.
- Publish the findings of services sector Health Hazard Evaluation (HHE) field investigations of potential workplace hazards and promote the adoption of recommended practices.
- Conduct research and produce NIOSH communication products that address the needs of contingent workers and those in non-standard work arrangements (such as temporary agency, contract, and “gig” workers).
- Incorporate questions of employment type into national surveys to better understand the exposure and health issues of service workers.
- Published a new set of workplace safety and health best practices for host employers of temporary workers, which is co-branded by NIOSH and partners.
- Published articles on injuries and illnesses among landscaping workers and birth defects among nail technicians and hairdressers.
- Published HHE reports evaluating environmental quality and health concerns in an elementary school and tuberculosis (TB) transmission from elephants to zoo employees, including recommended actions employers can take to improve health conditions. The zoo adopted recommendations to implement a TB Exposure Control Program.
- Published a Fatality Assessment and Control Evaluation report about an electrocuted maintenance worker.
- Published and disseminated a Workplace Solutions document on Conducting a Periodic Inspection on Each Procedure in a Hazardous Energy Control (Lockout/Tagout) Program for owners/operators of multi-energy source equipment.
- Collected air and dust samples from 12 schools in South Korea as part of international collaborative research to better understand mixed microbial exposures and how to promote the respiratory health of teachers.
- Publish an article on workplace leave policies and COVID-19 mitigation strategies.
- Conduct focus groups to better understand how to increase the impact of NIOSH communication products related to heat stress in outdoor worker populations.

Mention of any company or product does not constitute endorsement by the National Institute for Occupational Safety and Health, Centers for Disease Control and Prevention.
The Services Program aims to prevent work-related injuries, illnesses, and fatalities among the nation’s service workers. This snapshot shows recent accomplishments and upcoming projects.

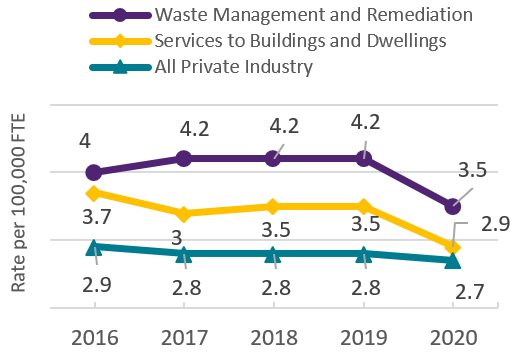
Source: U.S. Bureau of Labor Statistics

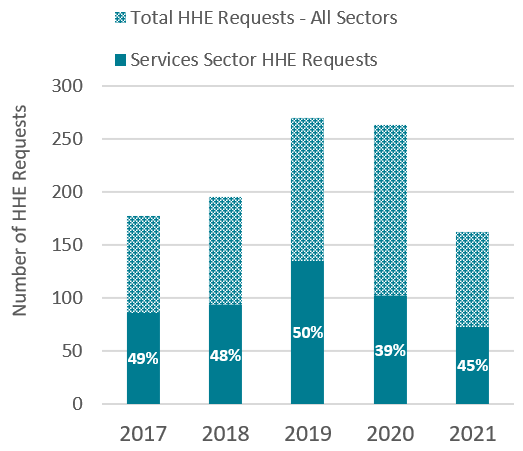
Source: NIOSH Program Records
 External Link Icon
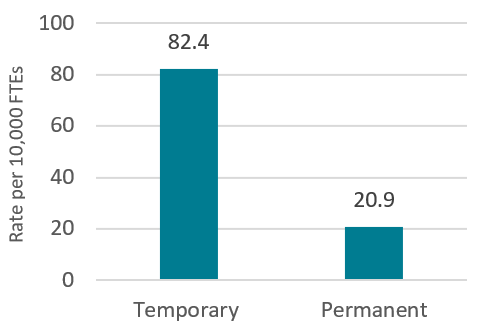
Source: Al-Tarawneh et al. [2020]. Am J Ind Med. 63:3-22.
To learn more, visit
https://www.cdc.gov/niosh/programs/pps/
October 2022
