Infectious Disease Prevalence in Los Angeles County–A Comparison to National Estimates, 1999–2004
- Key findings
- How does LAC compare with the total United States with respect to race and ethnicity?
- How does LAC compare with the total United States with respect to seropositivity to vaccine preventable diseases such as measles, mumps, rubella, and varicella?
- How does LAC compare with the total United States with respect to seropositivity to the enteric diseases hepatitis A virus (HAV)and Toxoplasma gondii (T. gondii)?
- How does LAC compare with the total United States with respect to seropositivity to herpes viral infections such as cytomegalovirus (CMV), herpes simplex virus type 1 (HSV-1), and herpes simplex virus type 2 (HSV-2)?
- Summary
- Definitions
- Data source and methods
- About the authors
- References
- Suggested citation
NCHS Data Brief No. 90, April 2012
PDF Version (690 KB)
Deanna Kruszon-Moran, Sc.M.; Kathryn S. Porter, M.D., M.S.; Geraldine McQuillan, Ph.D.; Veena Goud Billioux, Sc.M.; Robert Kim-Farley, M.D., M.P.H; and Rosemarie Hirsch, M.D., M.P.H.
Key findings
Data from the National Health and Nutrition Examination Survey 1999–2004
- Los Angeles County (LAC) had more Mexican American or “Other” and fewer non-Hispanic white persons as compared with the U.S. population.
- Seropositivity, measured as the presence of antibody, to hepatitis A virus (HAV) was greater among the total and Mexican-American populations in LAC as compared with the United States.
- There were no significant differences in seropositivity to measles, mumps, rubella, varicella, herpes simplex virus type 1 (HSV-1) and type 2 (HSV-2) between LAC and the U.S. total populations.
- Differences in seropositivity to cytomegalovirus (CMV) and to Toxoplasma gondii (T. gondii) between LAC and the U.S. total populations were no longer significant when comparing the two Mexican-American populations.
Antibody prevalence estimates, markers of infection with T. gondii, HAV, CMV, HSV-1 or HSV-2, or vaccination to measles, mumps, rubella, or varicella have been available for the United States but not at the local level (1–8). Los Angeles County (LAC) was the only county selected each year into the NHANES sample. Six years of data (1999–2004) were combined to provide sufficient sample size to create the first estimates of antibody prevalence to these nine infectious diseases based on direct laboratory measures for LAC. These estimates of disease burden or immunization success are compared between LAC and the United States.
Keywords: Seroprevalence, National Health and Nutrition Examination Survey, cross-sectional study
How does LAC compare with the total United States with respect to race and ethnicity?
LAC had significantly more persons of Mexican American (34.7%) or “Other” (29.2%) race and ethnicity then the total U.S. population (10.2% and 12.1%, respectively) (Figure 1). LAC also had fewer persons of non-Hispanic white (27.2%) race and ethnicity as compared with the race and ethnicity distribution in the total U.S. population (64.6%). Differences in the race and ethnicity demographic distribution observed between the United States and LAC are supported by census data.
Figure 1. Race and ethnicity in LAC and U.S. populations, ages 6–49 years, 1999–2004
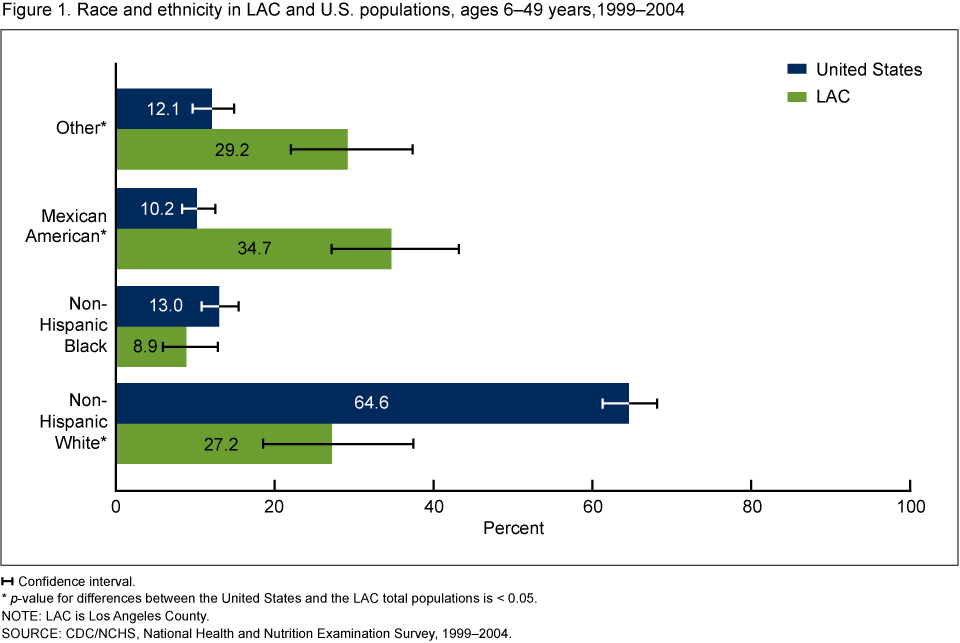
 Confidence interval.
* p-value for differences between the United States and the LAC total populations is < 0.05.
NOTE: LAC is Los Angeles County.
SOURCE: CDC/NCHS, National Health and Nutrition Examination Survey, 1999–2004.
How does LAC compare with the total United States with respect to seropositivity to vaccine preventable diseases such as measles, mumps, rubella, and varicella?
Seropositivity to all four vaccine preventable diseases, measles, mumps, rubella, and varicella was above 90% for both the U.S. and LAC populations (Figure 2). No significant differences between the United States and LAC were found in seropositivity for these four diseases in both the total population and the Mexican-American subgroup.
Figure 2. Seropositivity to measles, mumps, rubella, and varicella in LAC and the United States total populations and among the Mexican-American populations, ages 6–49 years, 1999–2004
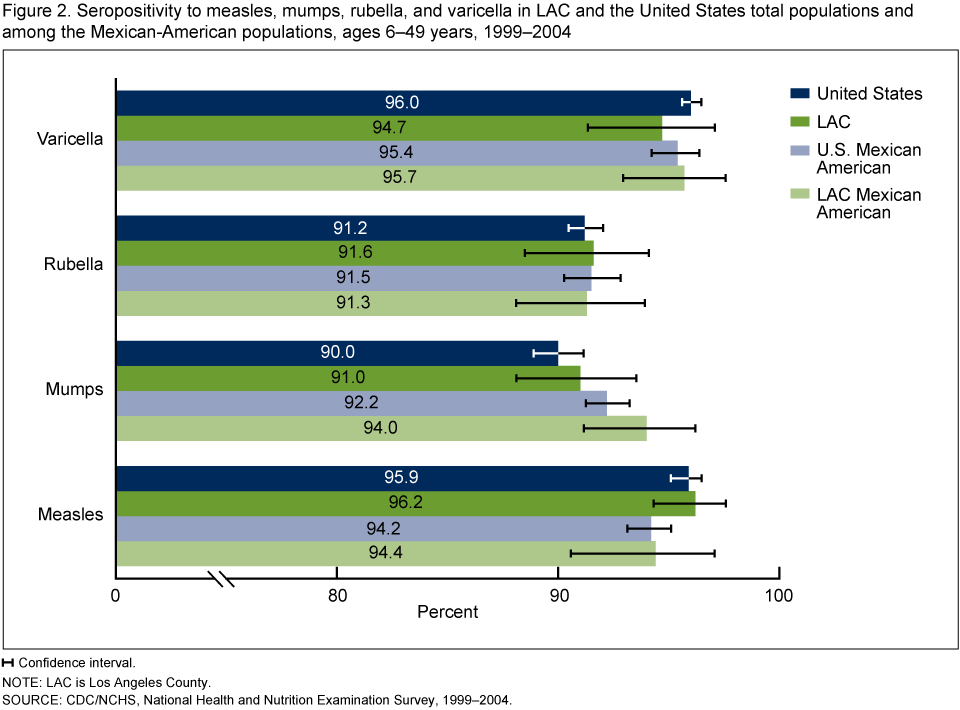
Confidence interval.
NOTE: LAC is Los Angeles County.
SOURCE: CDC/NCHS, National Health and Nutrition Examination Survey, 1999–2004.
How does LAC compare with the total United States with respect to seropositivity to the enteric diseases hepatitis A virus (HAV)and Toxoplasma gondii (T. gondii)?
Seropositivity to HAV, due to either natural infection or vaccination, was greater in LAC (64.8%) as compared with the United States (35.9%) and this difference remained when we looked at the Mexican-American subgroups alone (76.6% for the United States and 71.3% for LAC) (Figure 3). Seropositivity to T. gondii, due to natural infection, was greater in LAC (16.0%) as compared with the United States (11.0%). However, there was no significant difference in seroprevalence to T. gondii between the U.S. Mexican-American population compared with the Mexican-American population in LAC.
Figure 3. Seropositivity to HAV (ages 6 years and over) and T. gondii (ages 6–49 years) in LAC and the United States total populations and among the Mexican-American populations, 1999–2004
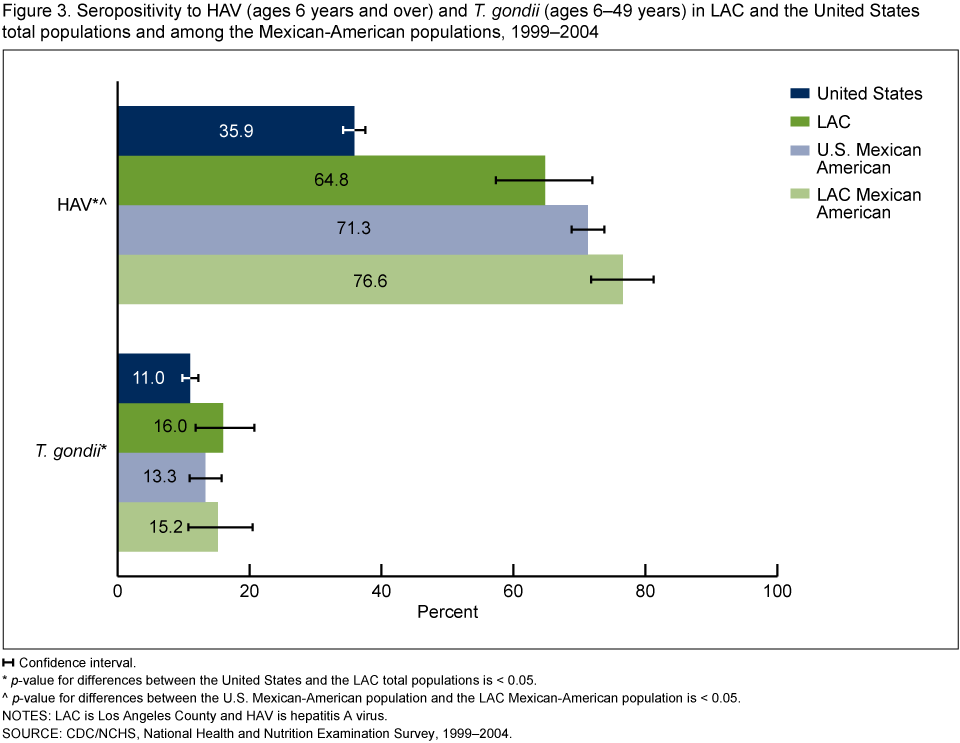
Confidence interval.
* p-value for differences between the United States and the LAC total populations is < 0.05.
^ p-value for differences between the U.S. Mexican-American population and the LAC Mexican-American population is < 0.05.
NOTES: LAC is Los Angeles County and HAV is hepatitis A virus.
SOURCE: CDC/NCHS, National Health and Nutrition Examination Survey, 1999–2004.
How does LAC compare with the total United States with respect to seropositivity to herpes viral infections such as cytomegalovirus (CMV), herpes simplex virus type 1 (HSV-1), and herpes simplex virus type 2 (HSV-2)?
Seropositivity to CMV, due to natural infection, was greater in LAC (69.7%) as compared with the United States (50.9%) (Figure 4). However, there was no significant difference in seroprevalence to CMV between the Mexican-American population in the United States compared with the Mexican American-population in LAC (75.9% and 79.7%, respectively). No significant differences between the United States and LAC were found in seropositivity to HSV-1 or HSV-2.
Figure 4. Seropositivity to CMV (ages 6–49 years) and HSV-1 and HSV-2 (ages 14–49 years) in LAC and the United States total populations and among the Mexican-American populations, 1999–2004

Confidence interval.
* p-value for differences between the U.S. and the LAC total populations is < 0.05.
NOTES: LAC is Los Angeles County, CMV is cytomegalovirus, HSV-1 is herpes simplex virus type 1 and HSV-2 is herpes simplex virus type 2.
SOURCE: CDC/NCHS, National Health and Nutrition Examination Survey, 1999–2004.
Summary
This is the first time seroprevalence of antibody to these nine infectious diseases have been available for LAC. Differences in the race and ethnicity distribution of the United States and LAC were observed. Because disease prevalence varies by race and ethnicity, in some instances these demographic differences affected the population differences seen between the United States and LAC in the seroprevalence of the infectious diseases reported in this study.
Seroprevalence for HAV was higher in LAC as compared with the United States among the total population and among the Mexican-American population. California is 1 of 11 states in which routine vaccination of children was recommended in 1999 by the Advisory Committee on Immunization Practices (ACIP) because mean incidence rates in these states were at least twice the national mean from 1987–1997 (9).
Seroprevalence to CMV and T. gondii have been shown to be higher among Mexican-American persons then other race and ethnicity groups (1,3). The higher seropositivity for CMV and T. gondii among persons from LAC is due to the higher proportion of Mexican-American persons in the LAC population. No differences in seropositivity were observed when comparing Mexican-American persons in the United States and LAC for these two outcomes.
No significant differences in seroprevalence between the United States and LAC were seen for measles, mumps, rubella, varicella, HSV-1, and HSV-2. Estimates of seropositivity from immunization or disease for LAC may assist in policy development, program planning, and measuring health disparities.
Definitions
Race and ethnicity: Race and ethnicity was based on self-report and categorized as non-Hispanic white, non-Hispanic black, and Mexican American. Persons not fitting into these categories were classified as “Other” and included in the total population estimates (10).
Measles positivity: Presence of antibody to measles in blood from either infection or immunization (5); measured on those persons ages 6–49 years.
Mumps positivity: Presence of antibody to mumps in blood from either infection or immunization (6); measured on those persons ages 6–49 years.
Rubella positivity: Presence of antibody to rubella in blood from either infection or immunization (7); measured on those persons ages 6–49 years.
Varicella positivity: Presence of antibody to varicella in blood from either infection or immunization (8); measured on those persons ages 6–49 years.
Toxoplasma gondii positivity: Presence of antibody to T. gondii in blood, a marker of past or current infection (1); measured on those persons ages 6–49 years.
Hepatitis A positivity: Presence of antibody to HAV in blood from either infection or immunization (2); measured on those persons ages 6–49 years and over.
Cytomegalovirus positivity: Presence of antibody to CMV in serum (3); measured on those ages 6–49 years.
HSV-1 and HSV-2 positivity: Presence of antibody to HSV-1 or HSV-2 in blood, a marker of current or past infection (4); measured on those ages 14–49 years.
Data source and methods
National Health and Nutrition Examination Surveys (NHANES) data were used for these analyses. NHANES is a cross-sectional survey designed to monitor the health and nutritional status of the civilian, noninstitutionalized U.S. population (10). The survey consists of interviews conducted in participants’ homes, standardized physical examinations conducted in specially outfitted mobile examination centers, and laboratory tests utilizing blood and urine specimens provided by participants during the physical examination.
The NHANES sample is selected through a complex, multistage design that includes selection of primary sampling units (PSU-counties), household segments within the counties, and finally sample persons from selected households. The sample design includes oversampling to obtain reliable estimates of health and nutritional measures for population subgroups. In 1999–2006, African Americans, Mexican Americans, persons with low-income, persons 12–19 years of age, and persons 60 years and over were oversampled. Because of the size and population density of LAC and the large Mexican-American population, a PSU in LAC was chosen with certainty in each 1-year sample in NHANES. It was the only county sampled in NHANES every year. In 1999, NHANES became a continuous survey, fielded on an ongoing basis. Public-use data files are released in 2-year cycles for U.S. estimates and can be grouped across cycles. Data was aggregated over these 6 years (1999–2004), which allowed for adequate sample size to make estimates for LAC (10).
Sample base weights were calculated to account for the differential probabilities of selection. Adjustment to base weights to account for nonresponse was done separately for the LAC sample and the U.S. sample. Weights for the U.S. sample were post-stratified to the population control totals for the United States at the midpoint of each survey cycle. Weights for the LAC sample were post-stratified to the midpoint of the 1999–2004 population control totals for LAC (11).
Standard errors of the percentages were estimated using Taylor Series Linearization in SUDAAN version 10.0 (RTI, Research Triangle Park, N.C.), a method that incorporates the sample weights and sample design. Ninety-five percent confidence intervals were estimated by using the exact binomial method (12). Differences in prevalence between the United States and LAC were evaluated by examining p-values calculated using a univariate t-statistic obtained from the combined standard errors between the two samples. All differences reported are statistically significant (p < 0.5) unless otherwise indicated.
Because 69% of the unweighted LAC sample was Mexican-American persons and there were relatively small numbers of non-Hispanic white and non-Hispanic black persons in the LAC sample, race and ethnicity specific estimates were only calculated for Mexican-American persons.
About the authors
Deanna Kruszon-Moran, Kathryn Porter, Geraldine McQuillan, and Rosemarie Hirsch are with the Centers for Disease Control and Prevention’s National Center for Health Statistics (NCHS), Division of Health and Nutrition Examination Surveys. Veena Goud Billioux is with NCHS’ Division of Vital Statistics. Dr. Robert Kim-Farley is Director of the Division of Communicable Disease Control and Prevention of the Los Angeles County Department of Public Health.
Acknowledgments
Leyla Mohadjer, Ph.D.; Jill Montaquila, Ph.D.; and Sylvia Dohrmann, M.S. of Westat for developing the Los Angeles County Weights.
References
- Jones JL, Kruszon-Moran D, Sanders-Lewis K, Wilson M. Toxoplasma gondii infection in the United States, 1999–2004, Decline from the Prior Decade. Am J Trop Med Hyg 77(3):405–10. 2007.
- Klevens RM, Kruszon-Moran D, Wasley A, Gallagher K, McQuillan GM, Kuhnert W, Teshale EH, Drobeniuc J, Bell BP. Seroprevalence of hepatitis A virus antibodies in the U.S.: Results from the National Health and Nutrition Examination Survey. Public Health Rep 126:522–32. 2011.
- Bate SL, Dollard SC, Cannon MJ. Cytomegalovirus seroprevalence in the United States: The National Health and Nutrition Examination Surveys, 1988–2004. Clin Infect Dis 50 (11):1439–47. 2010.
- Xu F, Sternberg MR, Kottiri BJ, McQuillan GM, Lee FK, Nahmias AJ, Berman SM, Markowitz LE. Trends in herpes simplex virus type 1 and type 2 in the United States: JAMA 296(8):964–73. 2006.
- McQuillan GM, Kruszon-Moran D, Hyde TB, Forghani B, Bellini W, Dayan GH. Seroprevalence of measles antibody in the U.S. population, 1999–2004. J Infect Dis 196(10):1459–64. 2007.
- Kutty PK, Kruszon-Moran DM, Dayan GH, Alexander JP, Williams NJ, Garcia PE, Hickman CJ, McQuillan GM, Bellini WJ. Seroprevalence of antibody to mumps virus in the U.S. population, 1999–2004. J Infect Dis 202 (5):667–4. 2010.
- Hyde TB, Kruszon-Moran D, McQuillan GM, Cossen C, Forghani B, Reef SE. Rubella immunity levels in the United States population: Has the threshold of viral elimination been reached? Clin Infect Dis 43:S146–50. 2006.
- Reynolds MA, Kruszon-Moran D, Jumaan A, Schmid DS, McQuillan GM. Varicella seroprevalence in the U.S.: Data from the National Health and Nutrition Examination Survey, 1999–2004. Public Health Rep 125(6):860–9. 2010
- CDC. Prevention of hepatitis A through active or passive immunization: Recommendations of the Advisory Committee on Immunization Practices (ACIP). MMWR Recomm Rep. 48(RR-12):1–37. 1999.
- Centers for Disease Control and Prevention. National Center for Health Statistics. National Health and Nutrition Examination Survey. Accessed January 2010.
- Porter KS, Curtin LR, Carroll MD, Li X, Mohadjer L, Shih M, Simon PA, Fielding JE. Health of adults in Los Angeles County: Findings from the National Health and Nutrition Examination Survey 1999–2004. National health statistics report; No 42. Hyattsville, MD: National Center for Health Statistics. 2011.
- Korn LK, Graubard BI. Confidence intervals for proportions with small expected number of positive counts estimated from survey data. Surv Methodol 24:193–201. 1998.
Suggested citation
Kruszon-Moran D, Porter KS, McQuillan G, Goud Billioux V, Kim-Farley R, Hirsch R. Infectious disease prevalence in Los Angeles County–A comparison to national estimates, 1999–2004. NCHS data brief, no 90. Hyattsville, MD: National Center for Health Statistics. 2012.
Copyright information
All material appearing in this report is in the public domain and may be reproduced or copied without permission; citation as to source, however, is appreciated.
National Center for Health Statistics
Edward J. Sondik, Ph.D., Director
Jennifer H. Madans, Ph.D., Associate Director for Science
Division of Health and Nutrition Examination Surveys
Clifford L. Johnson, M.S.P.H., Director