Telemedicine Use Among Adults: United States, 2021
NCHS Data Brief No. 445, October 2022
PDF Version (464 KB)
- Key findings
- What percentage of adults used telemedicine in the past 12 months, and were differences observed by sex and age?
- Did telemedicine use in the past 12 months differ by race and Hispanic origin?
- Were differences observed in the percentage of adults who used telemedicine in the past 12 months by family income as a percentage of the federal poverty level (FPL) and education level?
- Did telemedicine use in the past 12 months differ by region and urbanization level?
- Summary
Data from the National Health Interview Survey
- In 2021, 37.0% of adults used telemedicine in the past 12 months.
- Telemedicine use increased with age, and was higher among women (42.0%) compared with men (31.7%).
- Non-Hispanic White (39.2%) and non-Hispanic American Indian or Alaska Native (40.6%) adults were more likely to use telemedicine compared with Hispanic (32.8%), non-Hispanic Black (33.1%), and non-Hispanic Asian (33.0%) adults.
- The percentage of adults who used telemedicine increased with education level and varied by family income.
- The percentage of adults who used telemedicine varied by region and decreased with decreasing urbanization level.
Telemedicine is a way for health care providers to deliver clinical health care to patients remotely through a computer or telephone, without an in-person office visit (1). The demonstrated benefits of telemedicine include improved access to care, convenience, and slowing spread of infection (1,2). During the COVID-19 pandemic, legislation expanded coverage for telemedicine health care services (3). This report uses 2021 National Health Interview Survey (NHIS) data to describe the percentage of adults who used telemedicine in the past 12 months by sociodemographic and geographic characteristics.
Keywords: telehealth, health care use, National Health Interview Survey
What percentage of adults used telemedicine in the past 12 months, and were differences observed by sex and age?
- Among all adults aged 18 and over, 37.0% used telemedicine in the past 12 months (Figure 1).
- Women (42.0%) were more likely than men (31.7%) to use telemedicine.
- The percentage of adults who used telemedicine increased with age, from 29.4% among adults aged 18–29 to 43.3% among adults aged 65 and over.
Figure 1. Percentage of adults aged 18 and over who used telemedicine in the past 12 months, by sex and age: United States, 2021
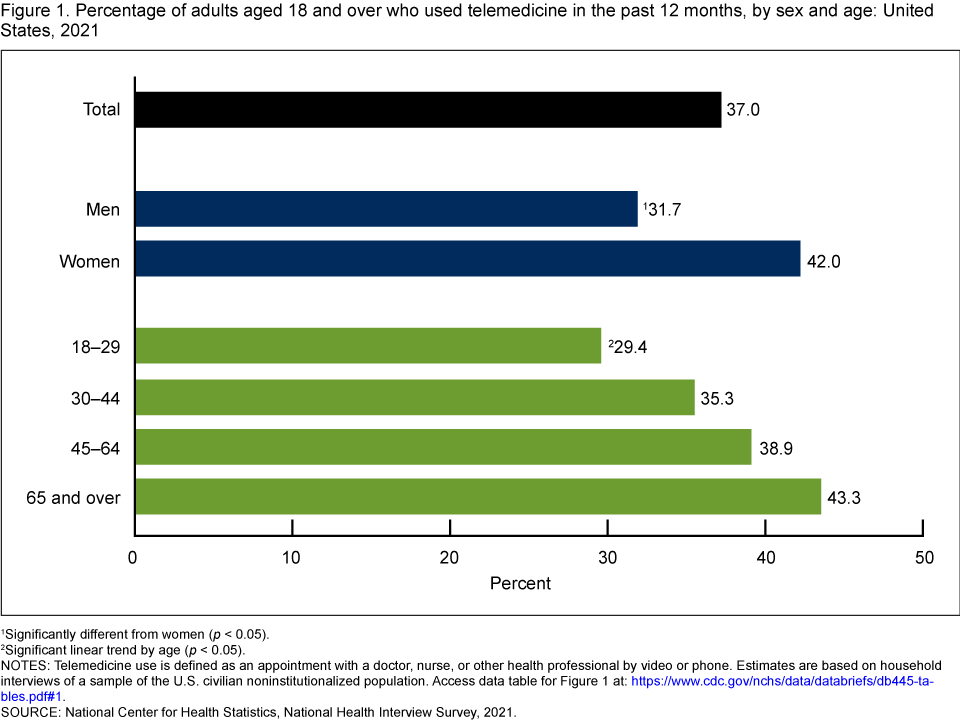
1Significantly different from women (p < 0.05).
2Significant linear trend by age (p < 0.05).
NOTES: Telemedicine use is defined as an appointment with a doctor, nurse, or other health professional by video or phone. Estimates are based on household interviews of a sample of the U.S. civilian noninstitutionalized population. Access data table for Figure 1.
SOURCE: National Center for Health Statistics, National Health Interview Survey, 2021.
Did telemedicine use in the past 12 months differ by race and Hispanic origin?
- Non-Hispanic White adults (39.2%) were more likely than Hispanic (32.8%), non-Hispanic Black (33.1%), and non-Hispanic Asian (33.0%) adults to have used telemedicine in the past 12 months (Figure 2).
- Non-Hispanic American Indian or Alaska Native (AIAN) adults (40.6%) were more likely to use telemedicine than Hispanic, non-Hispanic Black, and non-Hispanic Asian adults.
Figure 2. Percentage of adults aged 18 and over who used telemedicine in the past 12 months, by race and Hispanic origin: United States, 2021
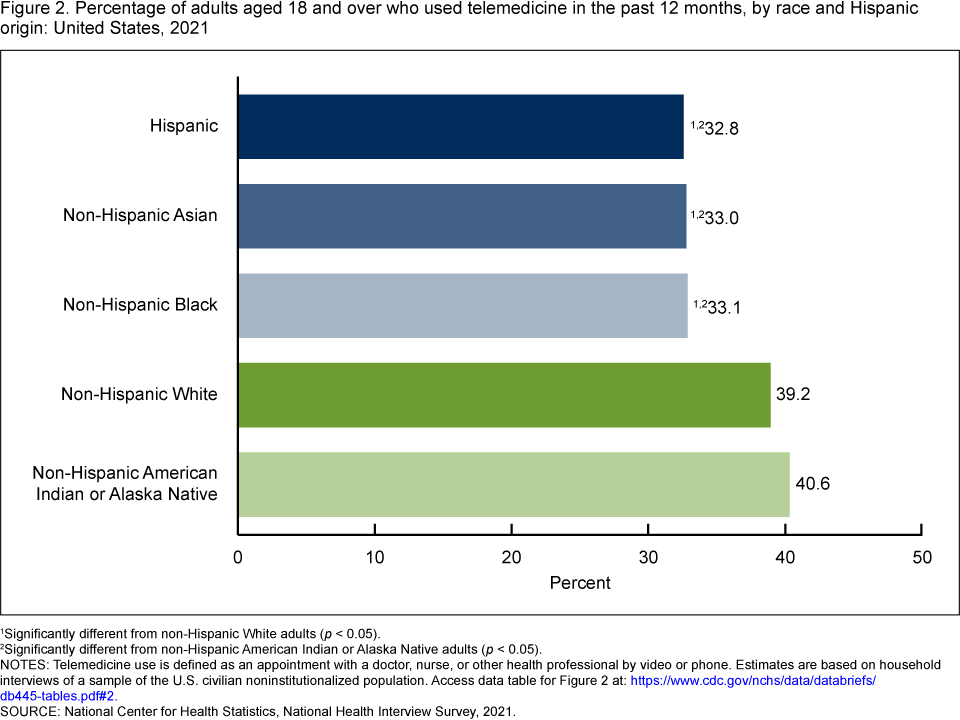
1Significantly different from non-Hispanic White adults (p < 0.05).
2Significantly different from non-Hispanic American Indian or Alaska Native adults (p < 0.05).
NOTES: Telemedicine use is defined as an appointment with a doctor, nurse, or other health professional by video or phone. Estimates are based on household interviews of a sample of the U.S. civilian noninstitutionalized population. Access data table for Figure 2.
SOURCE: National Center for Health Statistics, National Health Interview Survey, 2021.
Were differences observed in the percentage of adults who used telemedicine in the past 12 months by family income as a percentage of the federal poverty level (FPL) and education level?
- The percentage of adults who used telemedicine was similar for those with family incomes of less than 100% of FPL (33.1%) and those with incomes of 100% to less than 200% of FPL (32.1%), and then increased with increasing family income to 40.7% for those with family incomes of 400% or greater of FPL (Figure 3).
- The percentage of adults who used telemedicine increased with education level, from 28.7% among adults with less than a high school diploma or GED to 43.2% among adults with a college degree or higher.
Figure 3. Percentage of adults aged 18 and over who used telemedicine in the past 12 months, by family income and education level: United States, 2021
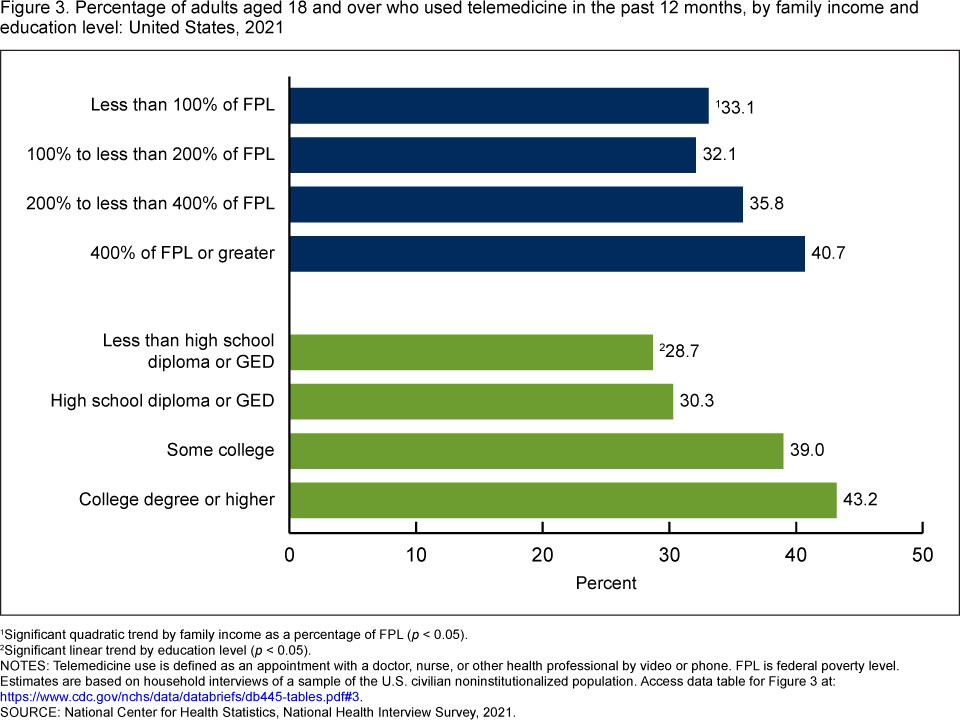
1Significant quadratic trend by family income as a percentage of FPL (p < 0.05).
2Significant linear trend by education level (p < 0.05).
NOTES: Telemedicine use is defined as an appointment with a doctor, nurse, or other health professional by video or phone. FPL is federal poverty level. Estimates are based on household interviews of a sample of the U.S. civilian noninstitutionalized population. Access data table for Figure 3.
SOURCE: National Center for Health Statistics, National Health Interview Survey, 2021.
Did telemedicine use in the past 12 months differ by region and urbanization level?
- Adults living in the Northeast (40.0%) and West (42.4%) were more likely to use telemedicine than adults living in the Midwest (33.3%) and South (34.3%) (Figure 4).
- Adults living in the Northeast were less likely to use telemedicine than adults living in the West.
- Telemedicine use by adults decreased with decreasing urbanization level, from 40.3% among adults living in central counties of large metropolitan areas to 27.5% among adults living in noncore areas.
Figure 4. Percentage of adults aged 18 and over who used telemedicine in the past 12 months, by region and urbanization level: United States, 2021
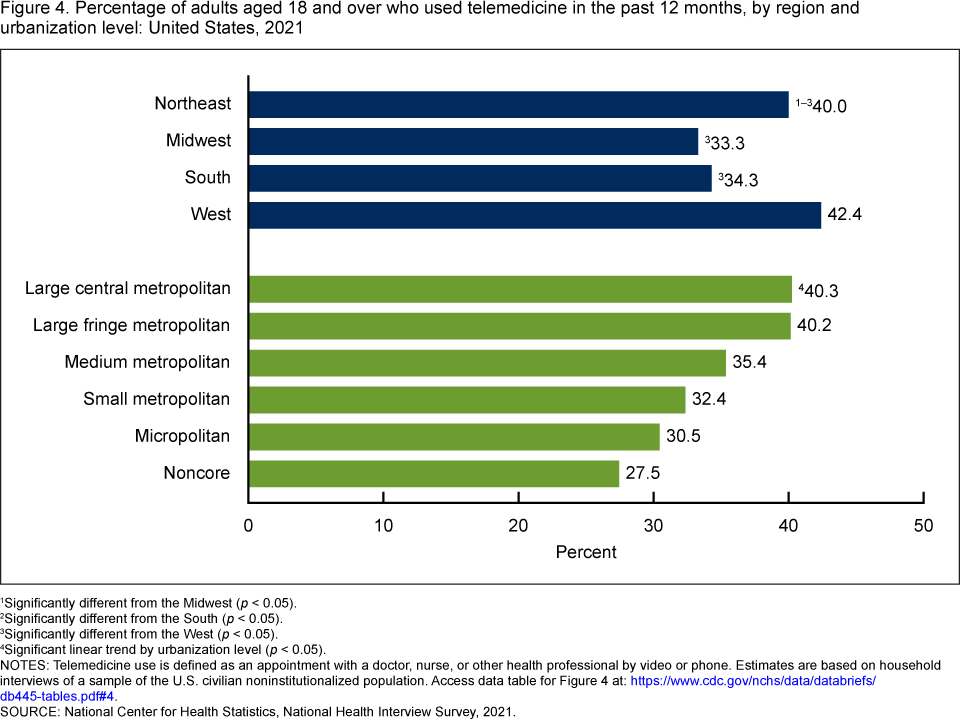
1Significantly different from the Midwest (p < 0.05).
2Significantly different from the South (p < 0.05).
3Significantly different from the West (p < 0.05).
4Significant linear trend by urbanization level (p < 0.05).
NOTES: Telemedicine use is defined as an appointment with a doctor, nurse, or other health professional by video or phone. Estimates are based on household interviews of a sample of the U.S. civilian noninstitutionalized population. Access data table for Figure 4.
SOURCE: National Center for Health Statistics, National Health Interview Survey, 2021.
Summary
In 2021, 37.0% of adults used telemedicine in the past 12 months. Differences in telemedicine use were observed by sex, age, race and Hispanic origin, family income, education level, region, and urbanicity. Women were more likely than men to have used telemedicine. Non-Hispanic White and non-Hispanic AIAN adults were more likely to use telemedicine than non-Hispanic Black, non-Hispanic Asian, and Hispanic adults. Additionally, telemedicine use was highest among those living in the Northeast and West regions, and use increased with age, education level, and with family incomes at or above 200% of FPL. Telemedicine use was highest in large metropolitan areas and decreased with decreasing urbanization level.
Only a few population-based estimates of telemedicine use in the United States are available (4). Because of its large sample size and the availability of demographic, geographic, and other health measures, NHIS is uniquely positioned to provide national estimates of, and examine differences in, telemedicine use.
Definitions
Family income: Based on the federal poverty level, which was calculated from the family’s income in the previous calendar year and family size using the U.S. Census Bureau’s poverty thresholds (5). Family income was imputed when missing (6).
Race and Hispanic origin: Based on two separate questions that determine Hispanic or Latino origin and race. Adults of Hispanic or Latino origin may be of any race. Adults categorized as non-Hispanic White, non-Hispanic Black, non-Hispanic AIAN, and non-Hispanic Asian indicated one race only. Estimates for non-Hispanic adults of other races are not shown.
Region: Based on the geographic classification of the U.S. population, where states are grouped into four regions used by the U.S. Census Bureau:
- Northeast: Connecticut, Maine, Massachusetts, New Hampshire, New Jersey, New York, Pennsylvania, Rhode Island, and Vermont
- Midwest: Illinois, Indiana, Iowa, Kansas, Michigan, Minnesota, Missouri, Nebraska, North Dakota, Ohio, South Dakota, and Wisconsin
- South: Alabama, Arkansas, Delaware, District of Columbia, Florida, Georgia, Kentucky, Louisiana, Maryland, Mississippi, North Carolina, Oklahoma, South Carolina, Tennessee, Texas, Virginia, and West Virginia
- West: Alaska, Arizona, California, Colorado, Hawaii, Idaho, Montana, Nevada, New Mexico, Oregon, Utah, Washington, and Wyoming
Telemedicine use: Based on a “yes” response to the question, “In the past 12 months, have you had an appointment with a doctor, nurse, or other health professional by video or by phone?”
Urbanization level: Metropolitan size and status was determined using the 2013 NCHS Urban–Rural Classification Scheme for counties (7). Large metropolitan areas are metropolitan statistical areas (MSAs) of 1 million or more people and are categorized into central and fringe counties. Medium metropolitan areas are MSAs of 250,000–999,999 people. Small metropolitan areas are MSAs of less than 250,000 people. Micropolitan are micropolitan statistical areas, and noncore are all remaining nonmetropolitan counties.
Data source and methods
NHIS is a nationally representative household survey of the U.S. civilian noninstitutionalized population. It is conducted continuously throughout the year by the National Center for Health Statistics (NCHS). Interviews are typically conducted in respondents’ homes, but follow-ups to complete interviews may be conducted over the telephone. Because of the COVID-19 pandemic, interviewing procedures were disrupted, and during 2021, 62.8% of the Sample Adult interviews were conducted at least partially by telephone (8). For more information about NHIS, visit: https://www.cdc.gov/nchs/nhis.htm.
Point estimates and their corresponding variances were calculated using SAS-callable SUDAAN software (9) to account for the complex sample design of NHIS. All estimates are based on self-report and meet NCHS data presentation standards for proportions (10). Differences between percentages were evaluated using two-sided significance tests at the 0.05 level. Linear and quadratic trends by age group, education level, urbanization level, and family income were evaluated using orthogonal polynomials in logistic regression.
About the authors
Jacqueline W. Lucas and Maria A. Villarroel are with the National Center for Health Statistics, Division of Health Interview Statistics.
References
- U.S. Department of Health and Human Services, Health Resources and Services Administration. What is telehealth?
- Gajarawala SN, Pelkowski JN. Telehealth benefits and barriers. J Nurse Prac 17(2):218–21. 2021.
- U.S. Department of Health and Human Services, Health Resources and Services Administration. Billing for telehealth during COVID-19.
- National Center for Health Statistics. Telemedicine use: Household Pulse Survey.
- U.S. Census Bureau. Poverty thresholds.
- National Center for Health Statistics. Multiple imputation of family income in 2021 National Health Interview Survey: Methods. 2022.
- Ingram DD, Franco SJ. 2013 NCHS urban–rural classification scheme for counties. National Center for Health Statistics. Vital Health Stat 2(166). 2014.
- National Center for Health Statistics. National Health Interview Survey, 2021 survey description. 2022.
- RTI International. SUDAAN (Release 11.0.3) [computer software]. 2018.
- Parker JD, Talih M, Malec DJ, Beresovsky V, Carroll M, Gonzalez JF Jr, et al. National Center for Health Statistics data presentation standards for proportions. National Center for Health Statistics. Vital Health Stat 2(175). 2017.
Suggested citation
Lucas JW, Villarroel MA. Telemedicine use among adults: United States, 2021. NCHS Data Brief, no 445. Hyattsville, MD: National Center for Health Statistics. 2022. DOI: https://dx.doi.org/10.15620/cdc:121435.
Copyright information
All material appearing in this report is in the public domain and may be reproduced or copied without permission; citation as to source, however, is appreciated.
National Center for Health Statistics
Brian C. Moyer, Ph.D., Director
Amy M. Branum, Ph.D., Associate Director for Science
Division of Health Interview Statistics
Stephen J. Blumberg, Ph.D., Director
Anjel Vahratian, Ph.D., M.P.H., Associate Director for Science