Decline in Perinatal Mortality in the United States, 2017–2019
NCHS Data Brief No. 429, January 2022
PDF Version (571 KB)
- Key findings
- Late fetal, early neonatal, and perinatal mortality rates declined from 2017 through 2019.
- Declines in perinatal mortality rates were not significant for most maternal age groups from 2017 through 2019.
- Perinatal mortality rates declined for non-Hispanic White, non-Hispanic Black, and Hispanic women from 2017 through 2019.
- Perinatal mortality rates declined in three states and were essentially unchanged for most U.S. jurisdictions in 2019 compared with 2017.
- Summary
Data from the National Vital Statistics System
- The U.S. perinatal mortality rate declined by 4% from 2017 to 2019, to 5.69 perinatal deaths per 1,000 live births and late fetal deaths in 2019.
- Late fetal and early neonatal mortality, the two components of perinatal mortality, each declined by 4% from 2017 through 2019.
- Perinatal mortality rates declined by 4%–5% for the three largest race and Hispanic-origin groups (non-Hispanic Black, non-Hispanic White, and Hispanic women) for 2017 through 2019.
- The perinatal mortality rate declined by 10% for women under age 20, from 7.61 in 2017 to 6.86 in 2019; declines for other age groups were not significant.
- Compared with 2017, perinatal mortality rates declined in 3 states and were essentially unchanged for 47 states and the District of Columbia in 2019.
Perinatal mortality (late fetal deaths at 28 completed weeks of gestation or more and early neonatal deaths under age 7 days) can be an indicator of the quality of health care before, during, and after delivery, and of the health status of the nation (1,2). The U.S. perinatal mortality rate declined 30% from 1990 to 2011, but was stable from 2011 through 2016 (1,3,4). This report presents trends in perinatal mortality as well as its components, late fetal and early neonatal mortality, for 2017 through 2019. Also shown are perinatal mortality trends by mother’s age, race and Hispanic origin, and state for 2017–2019.
Keywords: perinatal death, trends, race and ethnicity, age, National Vital Statistics System
Late fetal, early neonatal, and perinatal mortality rates declined from 2017 through 2019.
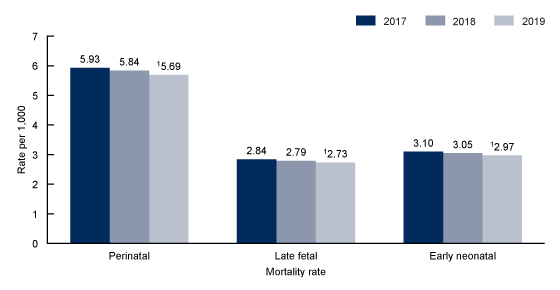
- The perinatal mortality rate declined 4%, from 5.93 in 2017 to 5.69 in 2019 (Figure 1).
- Early neonatal and late fetal mortality rates also declined by 4% from 2017 through 2019. The late fetal mortality rate was 2.84 in 2017 compared with 2.73 in 2019; the early neonatal mortality rate was 3.10 in 2017 compared with 2.97 in 2019.
Figure 1. Perinatal, late fetal, and early neonatal mortality rates: United States, 2017–2019

1Significant decreasing trend (p < 0.05).
NOTES: Perinatal mortality rate is the number of infant deaths under age 7 days and fetal deaths at 28 weeks of gestation or more per 1,000 live births and fetal deaths at 28 weeks of gestation or more. Late fetal mortality rate is the number of fetal deaths at 28 weeks of gestation or more per 1,000 live births and fetal deaths at 28 weeks of gestation or more. Early neonatal mortality rate is the number of infant deaths under age 7 days per 1,000 live births. Access data table for Figure 1.
SOURCE: National Center for Health Statistics, National Vital Statistics System.
Declines in perinatal mortality rates were not significant for most maternal age groups from 2017 through 2019.
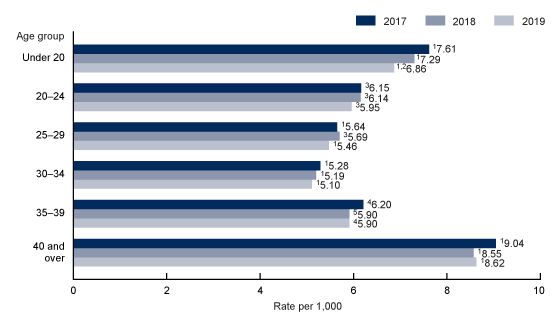
- The perinatal mortality rate declined by 10% for women under age 20, from 7.61 in 2017 to 6.86 in 2019; declines for other age groups were not significant (Figure 2).
- Age-specific perinatal mortality rates decreased with age, starting with women under 20 (6.86 in 2019) through 30-34 (5.10 in 2019) and then increased among older women, reaching a high of 8.62 for women aged 40 and over.
Figure 2. Perinatal mortality rates, by age of mother: United States, 2017–2019

1Significant difference from other age groups (p < 0.05).
2Significant decreasing linear trend from 2017 through 2019 (p < 0.05).
3Significant difference from other age groups except 35–39 (p < 0.05).
4Significant difference from other age groups except 20–24 (p < 0.05).
5Significant difference from other age groups except 20–24 and 25–29 (p < 0.05).
NOTES: Perinatal mortality rate is the number of infant deaths under age 7 days and fetal deaths at 28 weeks of gestation or more per 1,000 live births and fetal deaths at 28 weeks of gestation or more in a specified age group. Access data table for Figure 2.
SOURCE: National Center for Health Statistics, National Vital Statistics System.
Perinatal mortality rates declined for non-Hispanic White, non-Hispanic Black, and Hispanic women from 2017 through 2019.
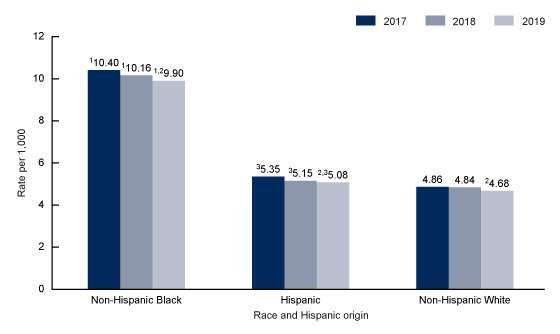
- Perinatal mortality rates declined from 2017 through 2019 for the three largest race and Hispanic-origin groups (Figure 3). Rates declined 4% for non-Hispanic White women (4.86 to 4.68), and 5% for non-Hispanic Black (10.40 to 9.90) and Hispanic (5.35 to 5.08) women.
- The perinatal mortality rate for non-Hispanic Black women was approximately twice as high as the rates for both non-Hispanic White and Hispanic women for each year.
- The perinatal mortality rate for Hispanic women was 6%–10% higher than the rate for non-Hispanic White women for all three years.
Figure 3. Perinatal mortality rates, by race and Hispanic origin of mother: United States, 2017–2019

1Significant difference from Hispanic and non-Hispanic White women (p < 0.05).
2Significant decreasing trend (p < 0.05).
3Significant difference from non-Hispanic White women (p < 0.05).
NOTES: Perinatal mortality rate is the number of infant deaths under age 7 days and fetal deaths at 28 weeks of gestation or more per 1,000 live births and fetal deaths at 28 weeks of gestation or more in a specified race and Hispanic-origin group. Access data table for Figure 3.
SOURCE: National Center for Health Statistics, National Vital Statistics System.
Perinatal mortality rates declined in three states and were essentially unchanged for most U.S. jurisdictions in 2019 compared with 2017.
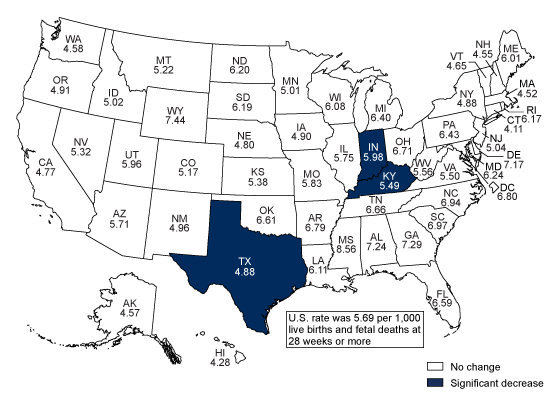
- Perinatal mortality rates declined by 19% in Kentucky (from 6.79 to 5.49), 13% in Indiana (from 6.90 to 5.98), and 11% in Texas (from 5.50 to 4.88) but were essentially unchanged in 47 states and the District of Columbia in 2019 compared with 2017 (Figure 4).
- Perinatal mortality rates for 2019 ranged from a low of 4.11 in Connecticut to a high of 8.56 in Mississippi.
- Compared with the U.S. rate of 5.69, the perinatal mortality rate was lower in 12 states, higher in 12 states, and not significantly different for 26 states and the District of Columbia.
Figure 4. Perinatal mortality rates, by state for 2019 and change in 2019 compared with 2017

NOTES: Rate per 1,000 live births and fetal deaths at 28 weeks or greater. Significant decrease at p < 0.05. Access data table for Figure 4.
SOURCE: National Center for Health Statistics, National Vital Statistics System.
Summary
After being essentially stable during 2011–2016, total perinatal mortality and late fetal and early neonatal mortality rates declined 4% from 2017 through 2019 (1, 5). Rates for the three largest race and Hispanic-origin groups also declined from 4% to 5%. During this time, rates declined by 10% for women under age 20, while declines for other age groups were not significant. Declines ranging from 11%–19% were seen for three states; rates in the remaining jurisdictions were essentially unchanged. As observed in previous years, the perinatal mortality rate for non-Hispanic Black women was about twice as high as the rates for non-Hispanic White and Hispanic women for each year from 2017 through 2019 (4).
Definitions
Late fetal death: A fetal death at 28 completed weeks of gestation or more.
Late fetal mortality rate: Number of fetal deaths at 28 completed weeks of gestation or more per 1,000 live births and fetal deaths at 28 completed weeks of gestation or more.
Early neonatal death: Death of a live-born infant under age 7 days.
Early neonatal mortality rate: Number of infant deaths under age 7 days per 1,000 live births.
Perinatal death: Infant deaths under age 7 days and fetal deaths at 28 completed weeks of gestation or more.
Perinatal mortality rate: Number of infant deaths under age 7 days and fetal deaths at 28 completed weeks of gestation or more per 1,000 live births and fetal deaths at 28 completed weeks of gestation or more.
Data sources and methods
This report uses data from the Fetal Death Data File and the Linked Birth/Infant Death Data File from the National Vital Statistics System (NVSS). The national vital statistics fetal death data file includes information from all reports of fetal death filed in the 50 states, the District of Columbia, and the U.S. territories. Although reporting requirements for fetal deaths vary somewhat by state, fetal mortality rates from NVSS generally represent fetal deaths of 20 weeks of gestation or more (1). Fetal death data from NVSS are available by a wide range of maternal and infant characteristics (6). The Linked Birth/Infant Death Data File provides information on infant deaths and live births in the United States (7). Fetal Death and Linked Birth/Infant Death data sets are available from: https://www.cdc.gov/nchs/data_access/Vitalstatsonline.htm.
Race and Hispanic origin are reported separately on the U.S. Standard Report of Fetal Death. Data shown by Hispanic origin include all people of Hispanic origin of any race. Race categories in this report are based on bridged race and are consistent with the 1977 Office of Management and Budget (OMB) standards (8), as not all states had implemented the 2003 revision of the U.S. Standard Report of Fetal Death (9), which allows the reporting of more than one race (multiple races) for the mother in accordance with the revised standards issued by OMB in 1997 (10), until 2018.
The differences between rates noted in the text are statistically significant at the 0.05 level unless otherwise noted. References to decreasing or increasing linear trends are statistically significant at the 0.05 level and were assessed using the Cochran-Armitage test for trends, a modified chi-squared test. Comparisons between state rates and U.S. rates took the individual state’s contribution to the U.S. rate into account. Therefore, each state rate is compared with a unique U.S. rate independent of the state’s contribution to the total U.S. rate.
About the authors
Claudia P. Valenzuela, Elizabeth C.W. Gregory, and Joyce A. Martin are with the National Center for Health Statistics, Division of Vital Statistics.
References
- MacDorman MF, Gregory ECW. Fetal and perinatal mortality: United States, 2013. National Vital Statistics Reports; vol 64 no 8. Hyattsville, MD: National Center for Health Statistics. 2015.
- World Health Organization. Neonatal and perinatal mortality: Country, regional and global estimates. 2006.
- MacDorman MF, Kirmeyer SE, Wilson EC. Fetal and perinatal mortality, United States, 2006. National Vital Statistics Reports; vol 60 no 8. Hyattsville, MD: National Center for Health Statistics. 2012.
- Gregory ECW, Drake P, Martin JA. Lack of change in perinatal mortality in the United States, 2014–2016. NCHS Data Brief, no 316. Hyattsville, MD: National Center for Health Statistics. 2018.
- National Center for Health Statistics. User guide to the period linked birth/infant death public use file (published annually).
- National Center for Health Statistics. Fetal death public-use file (published annually).
- National Center for Health Statistics. Linked birth/infant death public-use file (published annually).
- Office of Management and Budget. Race and ethnic standards for federal statistics and administrative reporting. Statistical Policy Directive No. 15. 1977.
- National Center for Health Statistics. 2003 revisions of the U.S. Standard Certificates and Reports.
- Office of Management and Budget. Revisions to the standards for the classification of federal data on race and ethnicity. Fed Regist 62(210):58782–90. 1997.
Suggested citation
Valenzuela CP, Gregory ECW, Martin JA. Decline in perinatal mortality in the United States, 2017–2019. NCHS Data Brief, no 429. Hyattsville, MD: National Center for Health Statistics. 2022. DOI: https://dx.doi.org/10.15620/cdc:112643.
Copyright information
All material appearing in this report is in the public domain and may be reproduced or copied without permission; citation as to source, however, is appreciated.
National Center for Health Statistics
Brian C. Moyer, Ph.D., Director
Amy M. Branum, Ph.D., Associate Director for Science
Division of Health Interview Statistics
Steven Schwartz, Ph.D., Director
Isabelle Horon, Dr.P.H., Acting Associate Director for Science