Trends in Death Rates in Urban and Rural Areas: United States, 1999–2019
NCHS Data Brief No. 417, September 2021
PDF Version (508KB)
- Key findings
- The difference in age-adjusted death rates between urban and rural areas increased from 1999 through 2019.
- The percentage difference in rural and urban death rates for both males and females widened over the period.
- Rates for each of the 10 leading causes of death in 2019 were higher in rural than in urban areas.
- Differences between rural and urban areas in death rates for heart disease, cancer, and CLRD widened over the period.
Data from the National Vital Statistics System
- From 1999 through 2019, age-adjusted death rates in urban areas declined from 865.1 per 100,000 to 693.4, whereas rates in rural areas initially declined from 1999 (923.8) through 2010 (837.6) and then stabilized through 2019 (834.0).
- Death rates for both males and females were higher in rural than in urban areas from 1999 through 2019, and the differences in rates widened over the period.
- In 2019, rates for the 10 leading causes of death were higher in rural areas than in urban areas, with the greatest difference in rates for deaths due to heart disease (189.1 compared with 156.3), cancer (164.1 compared with 142.8), and chronic lower respiratory disease (CLRD) (52.5 compared with 35.4).
- Differences between rural and urban death rates for heart disease, cancer, and CLRD widened from 1999 through 2019.
In the United States, approximately 15% of the population resides in counties located in rural areas (1). Those living in rural areas often face greater public health challenges as they have more limited access to health care, are less likely to be insured, and are more likely to live in poverty (1,2). This report provides the latest national data for trends in age-adjusted death rates for all causes of death among rural and urban areas by sex. Rates for rural and urban areas for the 10 leading causes of death in 2019 are also presented by urban-rural status along with trends in selected causes of death.
Key words: mortality rates, leading causes of death, National Vital Statistics System
The difference in age-adjusted death rates between urban and rural areas increased from 1999 through 2019.
- In rural areas, age-adjusted death rates declined by 1.0% annually from 1999 (923.8 per 100,000) through 2010 (837.6), and then stabilized through 2019 (834.0) (Figure 1).
- Rates in urban areas declined from 1999 (865.1) through 2019 (693.4), by 1.7% annually from 2000 through 2011, and by 0.3% annually from 2011 through 2019.
- In 1999, the age-adjusted death rate in rural areas was 7% higher than in urban areas; by 2019, the rate in rural areas was 20% higher than in urban areas.
Figure 1. Age-adjusted death rates, by urban-rural classification: United States, 1999–2019
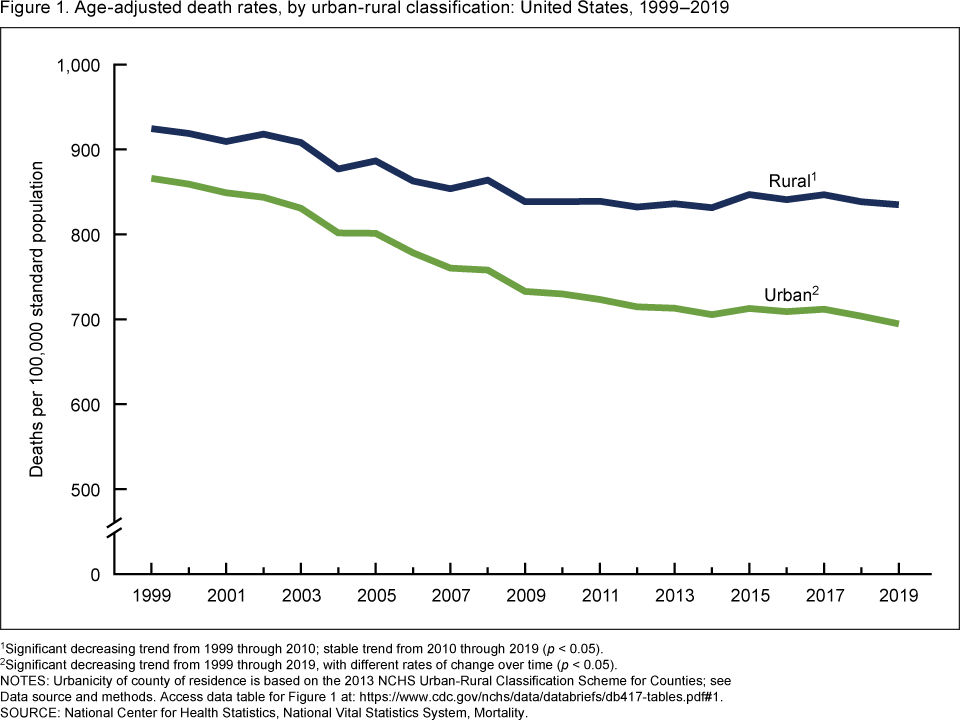
1Significant decreasing trend from 1999 through 2010; stable trend from 2010 through 2019 (p < 0.05).
2Significant decreasing trend from 1999 through 2019, with different rates of change over time (p < 0.05).
NOTES: Urbanicity of county of residence is based on the 2013 NCHS Urban-Rural Classification Scheme for Counties; see Data source and methods. Access data table for Figure 1.
SOURCE: National Center for Health Statistics, National Vital Statistics System, Mortality.
The percentage difference in rural and urban death rates for both males and females widened over the period.
- Death rates for males and females in rural areas declined from 1999 through 2010, and then leveled off through 2019 (Figure 2). Rates for males declined from 1,140.4 per 100,000 in 1999 to 991.3 in 2010, and generally remained stable through 2019 (977.3); rates for females declined from 760.2 in 1999 to 708.7 in 2010, and also remained stable through 2019 (704.5).
- Death rates for males in urban areas declined over the period, from 1,050.3 in 1999 to 865.5 in 2010 (1.9% annual average), and then to 821.9 in 2019 (0.3% annual average).
- After an initial period of stability from 1999 through 2002, the rate for females in urban areas declined from 714.8 in 2002 to 622.7 in 2009 (2.0% annual average) and continued to decline at a slower pace to 584.6 in 2019 (0.6% annual average).
- By 2019, rates in rural areas were 19% higher than in urban areas for males and 21% higher for females.
Figure 2. Age-adjusted death rates, by urban-rural classification and sex: United States, 1999–2019
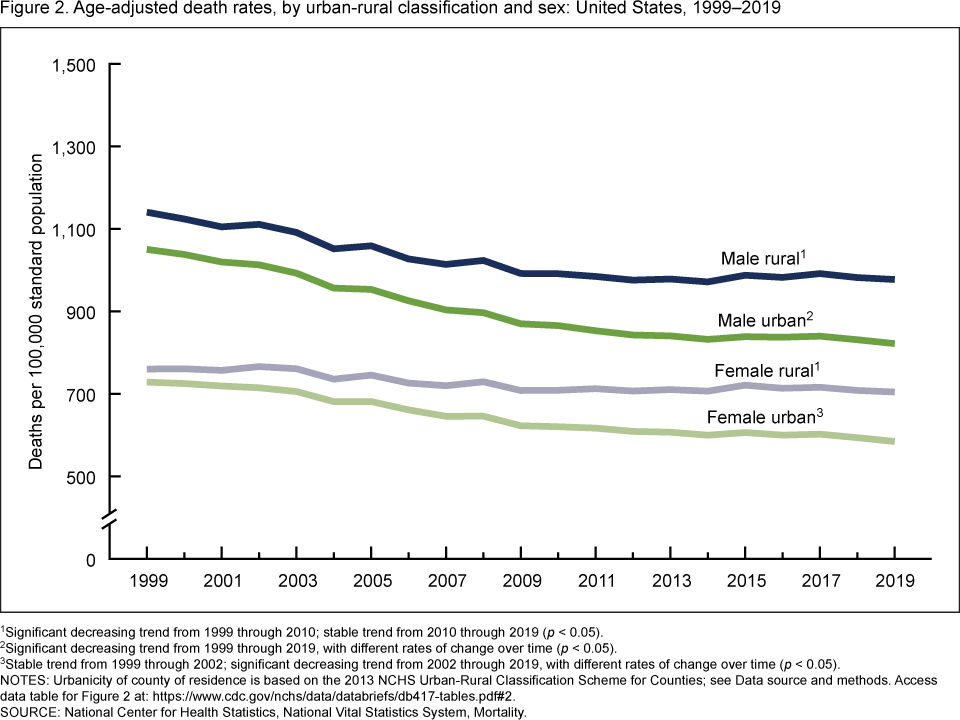
1Significant decreasing trend from 1999 through 2010; stable trend from 2010 through 2019 (p < 0.05).
2Significant decreasing trend from 1999 through 2019, with different rates of change over time (p < 0.05).
3Stable trend from 1999 through 2002; significant decreasing trend from 2002 through 2019, with different rates of change over time (p < 0.05).
NOTES: Urbanicity of county of residence is based on the 2013 NCHS Urban-Rural Classification Scheme for Counties; see Data source and methods. Access data table for Figure 2.
SOURCE: National Center for Health Statistics, National Vital Statistics System, Mortality.
Rates for each of the 10 leading causes of death in 2019 were higher in rural than in urban areas.
- In 2019, the largest differences between rural and urban rates of the leading causes of death were for heart disease (189.1 per 100,000 compared with 156.3, respectively), cancer (164.1 compared with 142.8), and chronic lower respiratory disease (CLRD) (52.5 compared with 35.4) (Figure 3).
- The smallest difference between rural and urban death rates was for stroke (39.0 compared with 36.6, respectively).
- Rates for the remaining causes of death were also higher in rural than in urban areas.
Figure 3. Age-adjusted death rates for the 10 leading causes of death, by urban-rural classification: United States, 2019
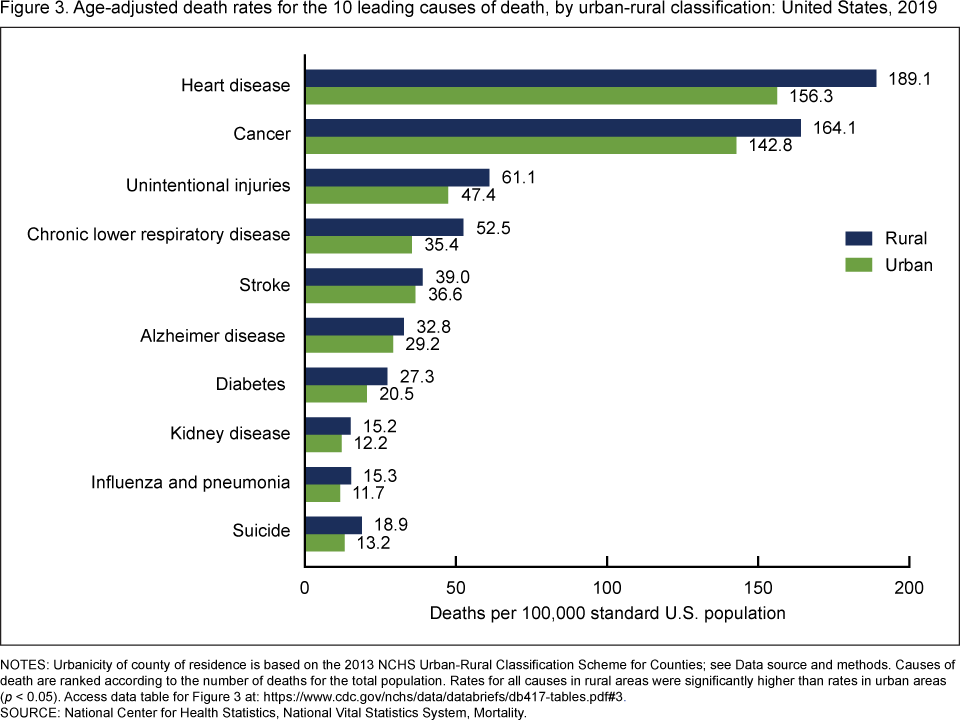
NOTES: Urbanicity of county of residence is based on the 2013 NCHS Urban-Rural Classification Scheme for Counties; see Data source and methods. Causes of death are ranked according to the number of deaths for the total population. Rates for all causes in rural areas were significantly higher than rates in urban areas (p < 0.05). Access data table for Figure 3.
SOURCE: National Center for Health Statistics, National Vital Statistics System, Mortality.
Differences between rural and urban areas in death rates for heart disease, cancer, and CLRD widened over the period.
- In both rural and urban areas, heart disease death rates declined at a greater pace from 1999 through 2010 than from 2010 through 2019 (Figure 4).
- Rates for cancer in both rural and urban areas declined over the period; greater percentage declines occurred after 2015.
- Differences in rural and urban death rates for heart disease and cancer increased over the period; by 2019, rates in rural areas were 21% higher than rates in urban areas for deaths from heart disease (189.1 per 100,000 compared with 156.3, respectively) and 15% higher for cancer (164.1 compared with 142.8).
- Differences in rates of CLRD between rural and urban areas increased from 11% higher in rural areas in 1999 (49.5 compared with 44.5) to 48% higher in 2019 (52.5 compared with 35.4).
Figure 4. Age-adjusted death rates for heart disease, cancer, and chronic lower respiratory disease, by urban-rural classification: United States, 1999–2019
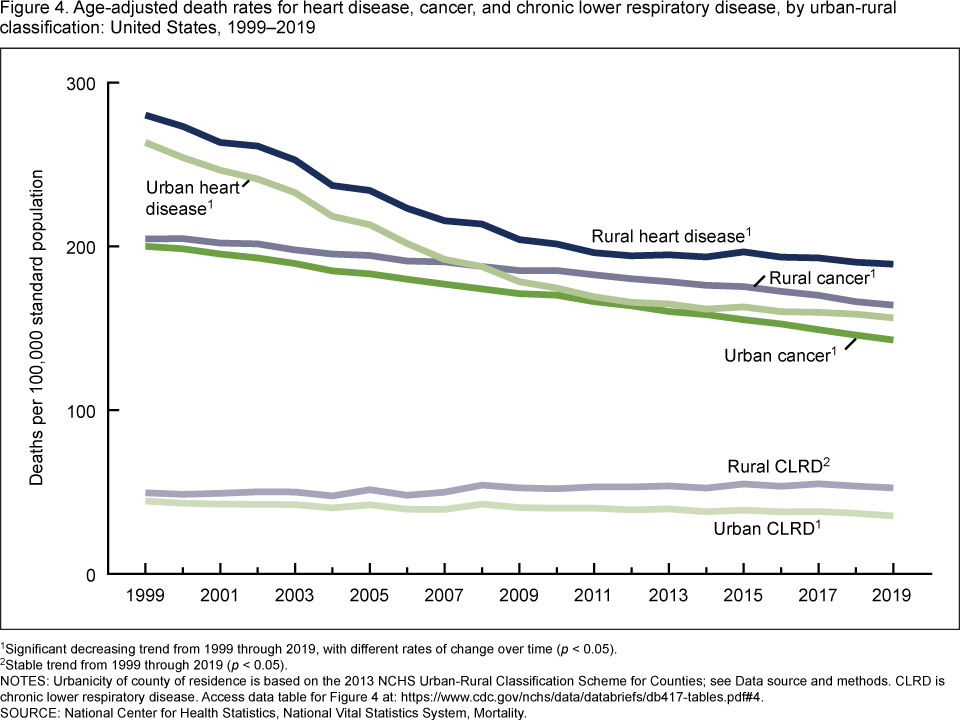
1Significant decreasing trend from 1999 through 2019, with different rates of change over time (p < 0.05).
2Stable trend from 1999 through 2019 (p < 0.05).
NOTES: Urbanicity of county of residence is based on the 2013 NCHS Urban-Rural Classification Scheme for Counties; see Data source and methods. CLRD is chronic lower respiratory disease. Access data table for Figure 4.
SOURCE: National Center for Health Statistics, National Vital Statistics System, Mortality.
Summary
During 1999 through 2019, age-adjusted death rates in rural areas were higher than in urban areas for the entire period, and the difference increased over time. Differences between rural and urban death rates widened over the period for both males and females.
In 2019, rates for the 10 leading causes of death were higher in rural than in urban areas. The greatest differences in rural and urban death rates were for heart disease, cancer, and CLRD. The smallest difference in death rates between rural and urban areas were among those who died of stroke.
The rates for heart disease, cancer, and CLRD were higher in rural than in urban areas over the entire period, but the differences by urban-rural status increased over time. By 2019, the rate in rural areas was 21% higher than the rate in urban areas for heart disease, 15% higher for cancer, and 48% higher for CLRD.
Data source and methods
Mortality and population data are from the National Center for Health Statistics’ 1999–2019 underlying cause-of-death mortality files (3). Age-adjusted death rates were calculated using the direct method and the 2000 U.S. standard population (4). Population data for 2000 and 2010 are April 1 bridged-race census counts, for 2001–2009 they are July 1 bridged-race intercensal estimates, and for 2011–2019 they are bridged-race July 1 postcensal estimates based on the 2010 census.
Urbanization level of the decedent’s county of residence was categorized using the 2013 National Center for Health Statistics Urban–Rural Classification Scheme for Counties (1). In this scheme, counties are classified into six urbanization levels based primarily on metropolitan–nonmetropolitan status and population distribution. In this report, the urban or rural classification was based on the following groupings: the urban classification contains the four metropolitan groups of large central, large fringe, medium, and small metro; the rural classification contains the two nonmetropolitan groups of micropolitan and noncore.
The 10 leading causes in 2019 by urban and rural classification are presented (Figure 3). Causes of death are classified using International Classification of Diseases, 10th Revision (ICD–10) (5) and are ranked according to the number of deaths assigned to rankable causes for the total population (6). Trends in age-adjusted death rates for heart disease, cancer, and CLRD are presented (Figure 4). These three causes accounted for 51% of all deaths in rural areas and 49% in urban areas in 2019.
Trends in age-adjusted death rates were evaluated using the Joinpoint Regression Program (7). The authors used the Joinpoint software to fit weighted least-squares regression models to the estimated proportions on the logarithmic scale. The default settings allowed for as few as three observed time points in the beginning, ending, and middle line segments, including the joinpoints. Using these settings, the grid search algorithm and permutation test searched for a maximum of three joinpoints, and an overall alpha level of 0.05. Pairwise comparisons between rural and urban areas were tested using the z test statistic at the 0.05 level of significance.
About the authors
Sally C. Curtin is with the Division of Vital Statistics and Merianne Rose Spencer is with the Division of Analysis and Epidemiology, National Center for Health Statistics.
References
- Ingram DD, Franco SJ. 2013 NCHS urban–rural classification scheme for counties. National Center for Health Statistics. Vital Health Stat 2(166). 2014.
- Leider JP, Meit M, McCullough JM, Resnick B, Dekker D, Alfonso YN, Bashai D. The state of rural public health: Enduring needs in a new decade. Am J Public Health. 110(9):1283–90. 2020.
- National Center for Health Statistics. About underlying cause of death, 1999–2019. CDC WONDER online database. 2021.
- Murphy SL, Xu JQ, Kochannek KD, Arias E. Deaths: Final data for 2019. National Vital Statistics Reports; vol 69 no 13. Hyattsville, MD: National Center for Health Statistics. 2021.
- World Health Organization. International statistical classification of diseases and related health problems, 10th revision. 2008 ed. Geneva, Switzerland. 2009.
- Heron M. Deaths: Leading causes for 2019. National Vital Statistics Reports; vol 70 no 9. Hyattsville, MD: National Center for Health Statistics. 2021.
- National Cancer Institute. Joinpoint Regression Program (Version 4.8.0.1) [computer software]. 2020.
Suggested citation
Curtin SC, Spencer MR. Trends in death rates in urban and rural areas: United States, 1999–2019. NCHS Data Brief, no 417. Hyattsville, MD: National Center for Health Statistics. 2021. DOI: https://dx.doi.org/10.15620/cdc:109049.
Copyright information
All material appearing in this report is in the public domain and may be reproduced or copied without permission; citation as to source, however, is appreciated.
National Center for Health Statistics
Brian C. Moyer, Ph.D., Director
Amy M. Branum, Ph.D., Associate Director for Science
Division of Vital Statistics
Steven Schwartz, Ph.D., Director
Andrés A. Berruti, Ph.D., M.A., Associate Director for Science
Division of Analysis and Epidemiology
Irma E. Arispe, Ph.D., Director
Kevin C. Heslin, Ph.D., Associate Director for Science