Secondhand Smoke Exposure Among Nonsmoking Adults: United States, 2015–2018
NCHS Data Brief No. 396, February 2021
PDF Version (466 KB)
Debra J. Brody, M.P.H., Erika Faust, and James Tsai, M.D., M.P.H.
- Key findings
- What percentage of nonsmoking adults were exposed to SHS, and were there differences by sex and age in 2015–2018?
- Did SHS exposure among nonsmoking adults vary by sex and race and Hispanic origin in 2015–2018?
- Were there differences in the percentage of nonsmoking adults exposed to SHS by education or family income in 2015–2018?
- Has SHS exposure among nonsmoking adults changed from 2009 to 2018?
- Summary
Data from the National Health and Nutrition Examination Survey
- During 2015–2018, 20.8% of nonsmoking U.S. adults aged 18 and over were exposed to secondhand tobacco smoke (SHS) as measured by cotinine in the blood.
- The prevalence of SHS exposure was greater for adults aged 18–39 (25.6%) than for those aged 40–59 (19.1%) and 60 and over (17.6%).
- Exposure to SHS was more prevalent among non-Hispanic black adults (39.7%) compared with non-Hispanic white (18.4%), non-Hispanic Asian (20.9%), and Hispanic (17.2%) adults.
- Adults with some college education had a lower prevalence of SHS exposure compared with those with a high school education or less, and the percentage of SHS-exposed adults decreased with increasing family income.
- From 2009 through 2018, the prevalence of SHS exposure declined from 27.7% to 20.7%.
Secondhand smoke (SHS) exposure results when smoke from burning tobacco products is inhaled by nonsmokers (1,2). Acute respiratory effects, coronary heart disease, stroke, lung cancer, and premature death are associated with SHS exposure (2,3). There is no risk-free level of SHS exposure (1). The prevalence of SHS exposure declined by 71.2% from 1988 to 2014 (4). This report examines the prevalence of SHS exposure among nonsmoking U.S. adults in 2015–2018 based on blood levels of cotinine, a metabolite of nicotine. Trends in SHS exposure are also presented.
Keywords: tobacco, nicotine, cotinine, NHANES
What percentage of nonsmoking adults were exposed to SHS, and were there differences by sex and age in 2015–2018?
Overall, 20.8% of nonsmoking adults were exposed to SHS, and the prevalence was similar for men (20.8%) and women (20.7%) (Figure 1).
Among nonsmoking adults aged 18 and over, the prevalence of SHS exposure decreased with increasing age, from 25.6% in adults aged 18–39 to 19.1% in adults aged 40–59 to 17.6% in adults aged 60 and over.
Similar patterns in the prevalence of SHS exposure by age were observed for men and women. Among men, SHS exposure decreased from 25.0% (aged 18–39) to 18.7% (aged 60 and over). Among women, SHS exposure decreased from 26.0% (aged 18–39) to 16.7% (aged 60 and over).
Figure 1. Percentage of secondhand smoke exposure among nonsmoking adults, by sex and age: United States, 2015–2018
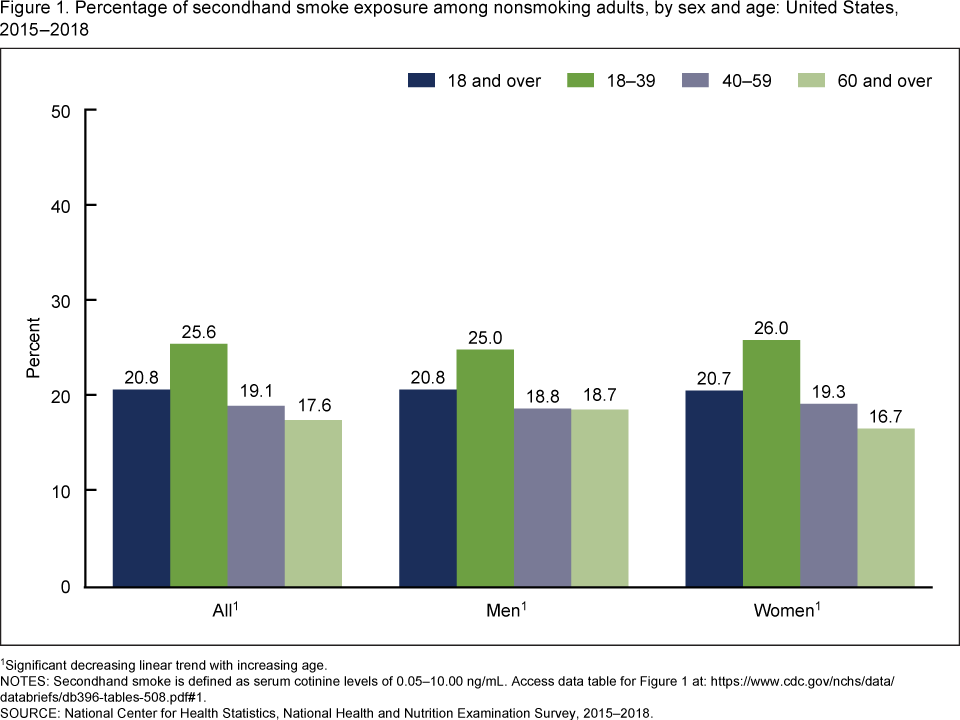
1Significant decreasing linear trend with increasing age.
NOTE: Secondhand smoke is defined as serum cotinine levels of 0.05–10.00 ng/mL. Access data table for Figure 1.
SOURCE: National Center for Health Statistics, National Health and Nutrition Examination Survey, 2015–2018.
Did SHS exposure among nonsmoking adults vary by sex and race and Hispanic origin in 2015–2018?
The prevalence of SHS exposure was highest among non-Hispanic black adults (39.7%) compared with non-Hispanic white (18.4%), non-Hispanic Asian (20.9%), and Hispanic (17.2%) adults (Figure 2). No other significant differences by race and Hispanic origin were observed.
A similar pattern in the prevalence of SHS exposure by race and Hispanic origin was observed for men and women. Exposure was most prevalent for non-Hispanic black men and women (38.4% and 40.5%, respectively) compared with non-Hispanic white (18.8% and 18.1%), non-Hispanic Asian (20.2% and 21.4%), and Hispanic (18.1% and 16.4%) men and women. Among women, the observed difference between Hispanic and non-Hispanic Asian women was not significant.
Figure 2. Percentage of secondhand smoke exposure among nonsmoking adults, by sex and race and Hispanic origin: United States, 2015–2018
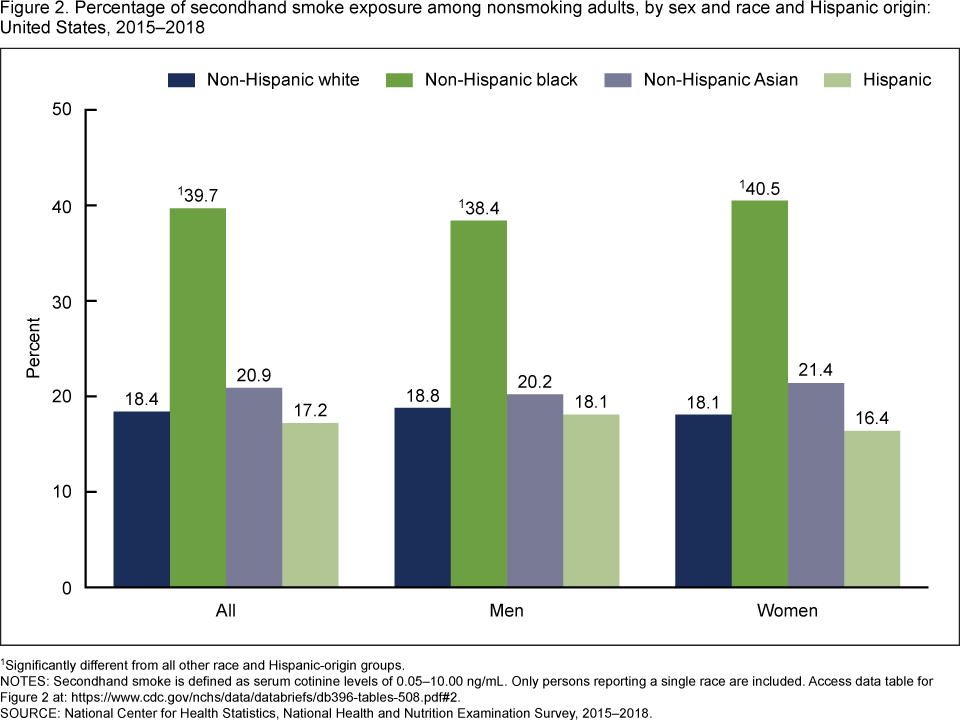
1Significantly different from all other race and Hispanic-origin groups.
NOTES: Secondhand smoke is defined as serum cotinine levels of 0.05–10.00 ng/mL. Only persons reporting a single race are included. Access data table for Figure 2.
SOURCE: National Center for Health Statistics, National Health and Nutrition Examination Survey, 2015–2018.
Were there differences in the percentage of nonsmoking adults exposed to SHS by education or family income in 2015–2018?
Nonsmoking adults with some college education or more had significantly lower SHS exposure (16.8%) compared with adult high school graduates (29.5%) and adults with less than a high school education (27.3%) (Figure 3).
The prevalence of SHS exposure among nonsmoking adults decreased with increasing family income (Figure 3). More than one-third (35.1%) of adults living below the federal poverty level (FPL) were exposed to SHS compared with 11.8% of adults living at or above 400% of the FPL.
Figure 3. Percentage of secondhand smoke exposure among nonsmoking adults, by education and income: United States, 2015–2018
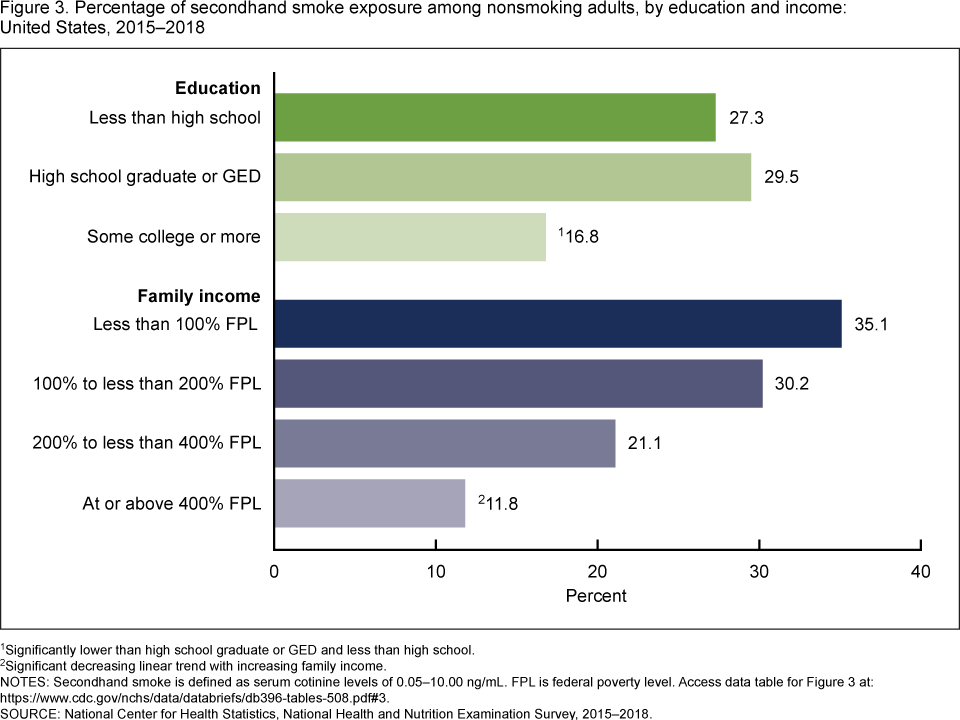
1Significantly lower than high school graduate or GED and less than high school.
2Significant decreasing linear trend with increasing family income.
NOTES: Secondhand smoke is defined as serum cotinine levels of 0.05–10.00 ng/mL. FPL is federal poverty level. Access data table for Figure 3.
SOURCE: National Center for Health Statistics, National Health and Nutrition Examination Survey, 2015–2018.
Has SHS exposure among nonsmoking adults changed from 2009 to 2018?
Over the 10-year period, the prevalence of SHS exposure among nonsmoking adults decreased by 7.0 percentage points, from 27.7% in 2009–2010 to 20.7% in 2017–2018 (Figure 4).
Figure 4. Trends in the percentage of secondhand smoke exposure among nonsmoking adults: United States, 2009–2018
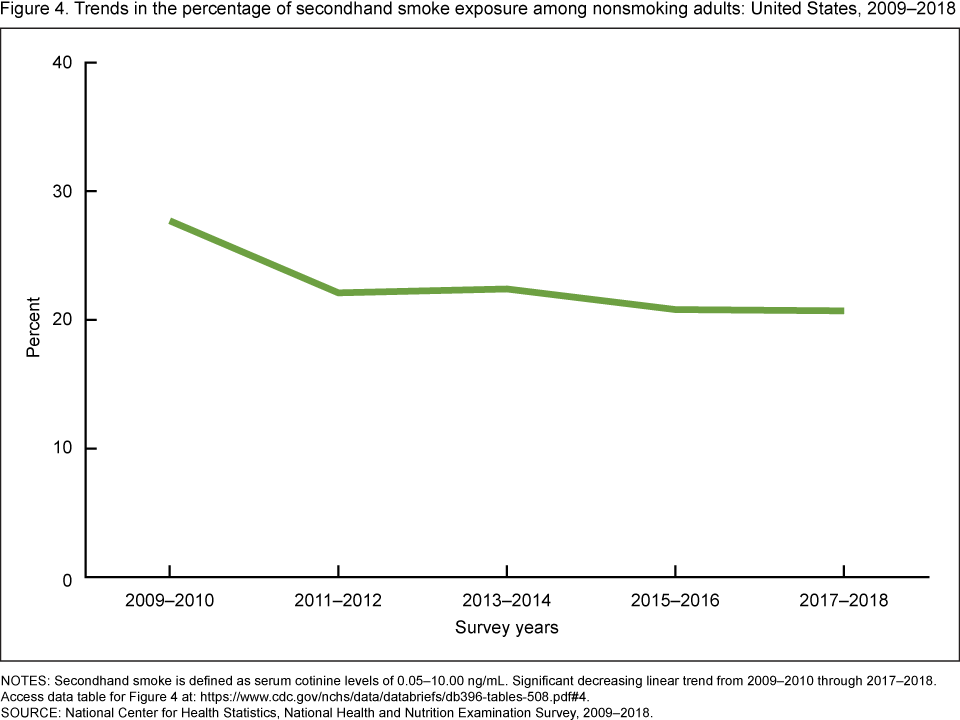
NOTES: Secondhand smoke is defined as serum cotinine levels of 0.05–10.00 ng/mL. Significant decreasing linear trend from 2009–2010 through 2017–2018. Access data table for Figure 4.
SOURCE: National Center for Health Statistics, National Health and Nutrition Examination Survey, 2009–2018.
Summary
During 2015 through 2018, about one in five (20.8%) nonsmoking U.S. adults were exposed to SHS. The prevalence of SHS exposure was similar for men and women, and SHS exposure decreased with increasing age. Exposure was most prevalent among non-Hispanic black nonsmoking adults compared with non-Hispanic white, non-Hispanic Asian, and Hispanic nonsmoking adults. The prevalence of SHS exposure increased with decreasing years of education and with decreasing income. More than one-third (35.1%) of nonsmoking adults with family income below the federal poverty level were exposed to SHS. The differences in the prevalence of SHS exposure by race and Hispanic origin, education, and income level are consistent with previous findings from 1988 through 2014 (4).
Since the late 1980s, the percentage of nonsmoking adults exposed to SHS decreased, but the decrease has slowed in recent years (4). Findings in this report showed that over the 10-year period from 2009–2010 through 2017–2018, SHS exposure declined by 7.0 percentage points. Waning cigarette smoking, awareness of SHS health risks, and adoption of smoke-free policies may have contributed to this reduction (1,2,5).
Definitions
Secondhand smoke exposure: Adults with serum cotinine values from 0.05 through 10.00 ng/mL were considered exposed to SHS. Adults with cotinine values above 10.00 ng/mL, or who reported smoking cigarettes in the previous 30 days during a household interview, or who answered affirmatively to questions about past 5-day tobacco use (including pipes, cigars, little cigars or cigarillos, water pipes, hookahs, e-cigarettes, chewing tobacco, snuff, snus, dissolvable tobacco, or nicotine replacement therapy products) during the examination were excluded from this analysis. Serum cotinine values were determined from blood samples collected by venipuncture during the examination. Laboratory analyses were performed at the Division of Laboratory Sciences at the National Center for Environmental Health using an isotope-dilution liquid chromatography-tandem mass spectrometry method (6).
Family income: A measure of the annual total family income divided by the dollar amount defined by the U.S. Department of Health and Human Services poverty guidelines (also called the federal poverty level), which account for inflation and family size (7).
Data source and methods
The National Health and Nutrition Examination Survey (NHANES), a cross-sectional survey conducted by the National Center for Health Statistics (NCHS), is designed to monitor the health and nutritional status of the civilian noninstitutionalized U.S. population. The survey consists of household interviews followed by standardized physical examinations in mobile examination centers (8).
The NHANES sample is selected through a complex, multistage probability design. From 2009 through 2018, non-Hispanic black, non-Hispanic Asian, and Hispanic persons were oversampled (6). Race and non-Hispanic origin-specific estimates reflect participants reporting only one race; persons reporting more than one race are included in all other estimates but are not reported separately.
Data from two combined cycles (2015–2016 and 2017–2018) were used to test differences between subgroups. Trends in secondhand smoke exposure reflect a 10-year period of five 2-year NHANES survey cycles, from 2009 through 2018. Examination sample weights were incorporated to account for differential probabilities of selection, nonresponse, and noncoverage. Taylor series linearization was used to compute variance estimates (9). Pairwise differences between groups were tested using a univariate t statistic. Tests for linear trends were evaluated using orthogonal polynomial contrasts. The significance level for statistical testing was p < 0.05. All differences reported are statistically significant unless otherwise indicated. All reported estimates met NCHS presentation standards (10). Statistical analyses were conducted using SAS System for Windows version 9.4 (SAS Institute, Inc., Cary, N.C.), and SUDAAN version 11.0 (RTI International, Research Triangle Park, N.C.).
About the authors
Debra J. Brody is with the National Center for Health Statistics, Division of Health and Nutrition Examination Surveys. Erika Faust is a Master of Public Health candidate in Epidemiology at the Milken Institute School of Public Health at the George Washington University. James Tsai is with the National Center for Chronic Disease Prevention and Health Promotion, Office on Smoking and Health.
References
- U.S. Department of Health and Human Services. The health consequences of smoking—50 years of progress: A report of the Surgeon General. 2014.
- U.S. Department of Health and Human Services. The health consequences of involuntary exposure to tobacco smoke: A report of the Surgeon General. 2006.
- U.S. Department of Health and Human Services. Smoking cessation: A report of the Surgeon General. 2020.
- Tsai J, Homa DM, Gentzke AS, Mahoney M, Sharapova SR, Sosnoff CS, et al. Exposure to secondhand smoke among nonsmokers—United States, 1988–2014. MMWR Morb Mortal Wkly Rep 67(48):1342–6. 2018.
- American Nonsmokers’ Rights Foundation. Summary of 100% smokefree state laws and population protected by 100% U.S. smokefree laws. Berkeley, CA: American Nonsmokers’ Rights Foundation. 2020.
- National Center for Environmental Health. Laboratory procedure manual: Cotinine and hydroxycotinine. 2018.
- U.S. Department of Health and Human Services, Assistant Secretary of Planning and Evaluation. 2018 poverty guidelines.
- Johnson CL, Paulose-Ram R, Ogden CL, Carroll MD, Kruszon-Moran D, Dohrmann SM, Curtin LR. National Health and Nutrition Examination Survey: Analytic guidelines, 1999–2010. National Center for Health Statistics. Vital Health Stat 2(161). 2013.
- Wolter KM. Chapter 6: Taylor series methods. In: Introduction to variance estimation. 2nd ed. New York, NY: Springer. 226–71. 2007.
- Parker JD, Talih M, Malec DJ, Beresovsky V, Carroll M, Gonzales Jr JF, et al. National Center for Health Statistics Data presentation standards for proportions. National Center for Health Statistics. Vital Health Stat 2(175). 2017.
Suggested citation
Brody DJ, Faust E, Tsai J. Secondhand smoke exposure among nonsmoking adults: United States, 2015–2018. NCHS Data Brief, no 396. Hyattsville, MD: National Center for Health Statistics. 2021. DOI: https://doi.org/10.15620/cdc:101197.
Copyright information
All material appearing in this report is in the public domain and may be reproduced or copied without permission; citation as to source, however, is appreciated.
National Center for Health Statistics
Brian C. Moyer, Ph.D., Director
Amy M. Branum, Ph.D., Acting Associate Director for Science
Division of Health and Nutrition Examination Surveys
Ryne Paulose-Ram, M.A., Ph.D., Acting Director
Lara J. Akinbami, M.D., Acting Associate Director for Science