Antidepressant Use Among Adults: United States, 2015-2018
- Key findings
- During 2015–2018, what percentage of adults used antidepressants in the past 30 days?
- Was there a difference in antidepressant use in the past 30 days by race and Hispanic origin and sex?
- Did antidepressant use in the past 30 days vary by level of education and sex?
- What were the trends in antidepressant use from 2009–2010 through 2017–2018?
- Summary
- Definition
- Data source and methods
- About the authors
- References
- Suggested citation
PDF Version (403 KB)
Key findings
Data from the National Health and Nutrition Examination Survey
- During 2015–2018, 13.2% of adults aged 18 and over used antidepressant medications in the past 30 days. Use was higher among women (17.7%) than men (8.4%).
- Antidepressant use increased with age, overall and in both sexes—use was highest among women aged 60 and over (24.3%).
- Antidepressant use was higher among non-Hispanic white (16.6%) adults compared with non-Hispanic black (7.8%), Hispanic (6.5%), and non-Hispanic Asian (2.8%) adults.
- Antidepressant medication use was higher for adults with at least some college education (14.3%) compared with those with a high school education (11.5%) or less (11.4%).
- From 2009–2010 through 2017–2018, the percentage of adults who used antidepressants increased among women, but not men.
In 2018, an estimated 7.2% of American adults had a major depressive episode in the past year (1). Depression is associated with diminished quality of life and increased disability (2). Antidepressants are one of the primary treatments for depression (3) and are among the most frequently used therapeutic medications in the United States (4).
This data brief provides recent prevalent estimates for antidepressant use among U.S. adults aged 18 and over, by age, sex, race and Hispanic origin, and education. Trends in antidepressant use over the decade from 2009–2010 through 2017–2018 are described.
Keywords: antidepressant medication, National Health and Nutrition Examination Survey (NHANES)
During 2015–2018, what percentage of adults used antidepressants in the past 30 days?
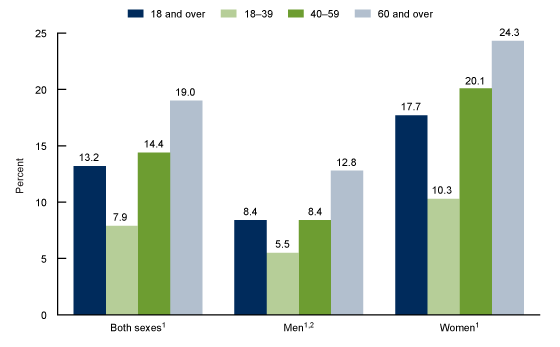
During 2015–2018, 13.2% of adults used antidepressants in the past 30 days (Figure 1). Use was higher among women (17.7%) than men (8.4%).
The percentage of antidepressant use increased with age, from 7.9% among adults aged 18–39 to 14.4% for those aged 40–59 to 19.0% for those aged 60 and over. A similar increase in the use of antidepressant medications by age was observed for men and women. Among men, use was lowest among those aged 18–39 (5.5%) and highest among those aged 60 and over (12.8%). Among women, use rose from 10.3% among those aged 18–39 to 24.3% among those aged 60 and over.
In all age groups, antidepressant use was higher among women compared with men.
Figure 1. Percentage of adults aged 18 and over who used antidepressant medication over past 30 days, by age and sex: United States, 2015–2018
1Significant increasing trend by age.
2Significantly lower than women in the same age group.
NOTE: Access data table for Figure 1.
SOURCE: National Center for Health Statistics, National Health and Nutrition Examination Survey, 2015–2018.
Was there a difference in antidepressant use in the past 30 days by race and Hispanic origin and sex?
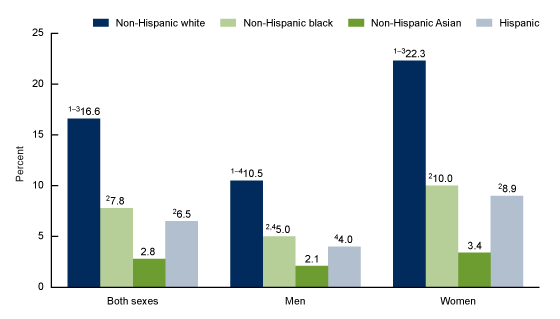
The percentage of antidepressant use in the past 30 days was highest among non-Hispanic white adults (16.6%) compared with non-Hispanic black (7.8%), Hispanic (6.5%), and non-Hispanic Asian (2.8%) adults (Figure 2). Use was also higher among non-Hispanic black and Hispanic adults compared with non-Hispanic Asian adults.
Among men, use was highest among non-Hispanic white (10.5%) compared with non-Hispanic black (5.0%), Hispanic (4.0%), and non-Hispanic Asian (2.1%) men. Use did not differ significantly among non-Hispanic black and Hispanic men, nor among non-Hispanic Asian and Hispanic men.
A similar pattern in antidepressant use by race and Hispanic origin was observed among women, although use was higher among Hispanic women (8.9%) than non-Hispanic Asian women (3.4%). Use was highest among non-Hispanic white women (22.3%).
The percentage of antidepressant use was higher among women than men for all race and Hispanic origin groups except among non-Hispanic Asian adults, where the difference did not reach significance.
Figure 2. Percentage of adults aged 18 and over who used antidepressant medication over past 30 days, by race and Hispanic origin and sex: United States, 2015–2018
1Significantly higher than Non-Hispanic black.
2Significantly higher than Non-Hispanic Asian.
3Significantly higher than Hispanic.
4Significantly lower than women in same race or Hispanic origin group.
NOTE: Access data table for Figure 2.
SOURCE: National Center for Health Statistics, National Health and Nutrition Examination Survey, 2015–2018.
Did antidepressant use in the past 30 days vary by level of education and sex?
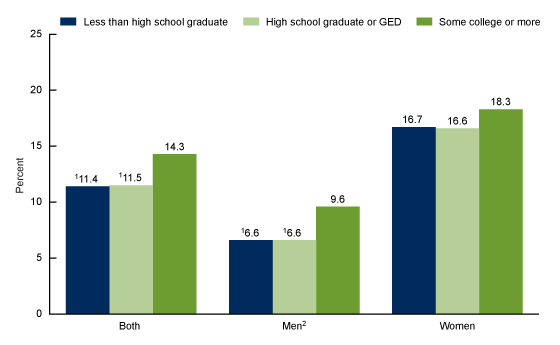
Overall, the percentage of adults who took antidepressants in the past 30 days was lower among those with less than a high school (11.4%) or a high school (11.5%) education compared with those who attended college (14.3%) (Figure 3). This same pattern was observed among men, with the highest use among those with at least some college education (9.6%). Among women, antidepressant use did not differ significantly by level of education.
Across all levels of education, the percentage of antidepressant use was higher among women than men.
Figure 3. Percentage of adults aged 18 and over who used antidepressant medication over past 30 days, by education level and sex: United States, 2015–2018
1Significantly lower than some college or more.
2Significantly lower than women at the same education level.
NOTES: GED is General Educational Development. Access data table for Figure 3.
SOURCE: National Center for Health Statistics, National Health and Nutrition Examination Survey, 2015–2018.
What were the trends in antidepressant use from 2009–2010 through 2017–2018?
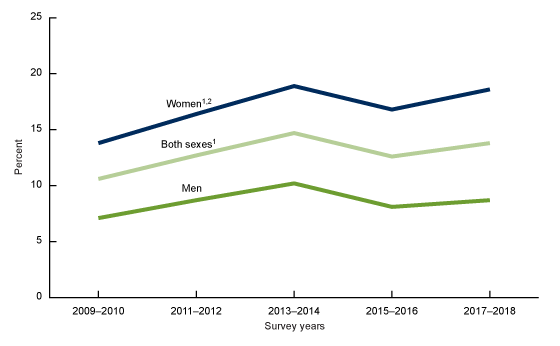
Overall, during the decade between 2009–2010 and 2017–2018, antidepressant use increased from 10.6% to 13.8% (Figure 4).
A significant increasing trend was observed for women from 2009–2010 through 2017–2018 in antidepressant use during the past 30 days (from 13.8% to 18.6%), but not for men (from 7.1% to 8.7%). The percentage of women taking antidepressant medication was higher than in men at all points over the 10-year period.
Figure 4. Trends in antidepressant use over past 30 days among adults aged 18 and over, by sex: United States, 2009–2018
1Significantly increasing linear trend.
2Significantly higher percentage than men in all years.
NOTE: Access data table for Figure 4.
SOURCE: National Center for Health Statistics, National Health and Nutrition Examination Survey, 2009–2018.
Summary
During 2015–2018, 13.2% of Americans aged 18 and over reported taking antidepressant medication in the past 30 days. Antidepressant use was higher among women than men in every age group. Use increased with age, in both men and women. Almost one-quarter of women aged 60 and over (24.3%) took antidepressants.
Antidepressant use was lowest among non-Hispanic Asian adults, and use among Hispanic and non-Hispanic black adults was lower than among non-Hispanic white adults. More than 1 in 5 non-Hispanic white women took antidepressants in the past 30 days (22.3%).
Overall and among men, antidepressant use was higher among those with some college education compared with those having a high school degree or less. Among women, the pattern was the same, although the differences did not reach significance.
Over the decade from 2009–2010 through 2017–2018, the percentage of adults using antidepressants increased. This rise in use was observed among women, but not men.
Definition
Antidepressant medication: During the household interview, participants were asked if they had taken any prescription drug in the past 30 days. Those who answered “yes” were asked to show the interviewer the medication containers of all prescription drugs. For each drug reported, the interviewer recorded the product’s complete name from the container or pharmacy list, if available. Prescription drugs were classified based on the three-level nested therapeutic classification scheme of Cerner Multum’s Lexicon (5). Antidepressants were identified using the second level of drug ingredient categorical codes, specifically code 249. A combination of bupropion and naltrexone, which is primarily used for obesity, overweight, and weight-related medical problems, was excluded.
Data source and methods
The National Health and Nutrition Examination Survey (NHANES) is a continuous survey conducted to assess the health and nutrition of Americans. The survey is designed to be nationally representative of the U.S. civilian noninstitutionalized population. Survey participants complete a household interview and visit a mobile examination center for a standardized physical examination.
NHANES data from 2009–2010 through 2017–2018 were used for these analyses (6). NHANES 2015–2018 data were used to estimate the proportion of antidepressant use by demographic characteristics. Five 2-year cycles (2009–2018) were used to test for trends. Of the 11,848 adults aged 18 and over who participated in the household interview during NHANES 2015–2018, 11,704 persons had information on prescription medication use. Interview weights, which account for the differential probabilities of selection, nonresponse, and noncoverage, were used for all analyses. Standard errors of the percentages were estimated using Taylor series linearization, a method that incorporates the sample design and weights.
Differences between men and women, and for race and Hispanic-origin subgroups, were tested using a t statistic at the p < 0.05. significance level. Linear trends were tested using orthogonal contrast matrices. All differences reported are statistically significant unless otherwise indicated. Reported estimates meet NCHS reliability standards (7). Data analyses were performed using SAS version 9.4 (SAS Institute, Cary, N.C.) and SUDAAN version 11.1 (RTI International, Research Triangle Park, N.C.).
About the authors
Debra J. Brody and Qiuping Gu are with the National Center for Health Statistics, Division of Health and Nutrition Examination Surveys.
References
- Substance Abuse and Mental Health Services Administration. Key substance use and mental health indicators in the United States: Results from the 2018 National Survey on Drug Use and Health (HHS Publication No. PEP19-5068, NSDUH Series H-54). Rockville, MD: Center for Behavioral Health Statistics and Quality. 2019.
- GBD 2017 SDG Collaborators. Measuring progress from 1990 to 2017 and projecting attainment to 2030 of the health-related sustainable development goals for 195 countries and territories: A systematic analysis for the Global Burden of Disease Study 2017. Lancet 392(10159):2091–138.
- Cipriani A, Furukawa TA, Salanti G, Chaimani A, Atkinson LZ, Ogawa Y, et al. Comparative efficacy and acceptability of 21 antidepressant drugs for the acute treatment of adults with major depressive disorder: A systematic review and network meta-analysis. Lancet 391(10128):1357–66. 2018.
- Martin CB, Hales CM, Gu Q, Ogden CL. Prescription drug use in the United States,
2015–2016. NCHS Data Brief, no 334. Hyattsville, MD: National Center for Health Statistics. 2019. - National Center for Health Statistics. National Health and Nutrition Examination Survey: 1988–2018 data documentation, codebook, and frequencies.
- National Center for Health Statistics. National Health and Nutrition Examination Survey: Questionnaires, datasets, and related documentation.
- Parker JD, Talih M, Malec DJ, Beresovsky V, Carroll M, Gonzalez JF Jr, et al. National Center for Health Statistics data presentation standards for proportions. National Center for Health Statistics. Vital Health Stat 2(175). 2017.
Suggested citation
Brody DJ, Gu Q. Antidepressant use among adults: United States, 2015–2018. NCHS Data Brief, no 377. Hyattsville, MD: National Center for Health Statistics. 2020.
Copyright information
All material appearing in this report is in the public domain and may be reproduced or copied without permission; citation as to source, however, is appreciated.
National Center for Health Statistics
Brian C. Moyer, Ph.D., Director
Amy M. Branum, Ph.D., Acting Associate Director for Science
Division of Health and Nutrition Examination Surveys
Ryne Paulose-Ram, M.A., Ph.D., Acting Director
Lara J. Akinbami, M.D., Acting Associate Director for Science


