Fast Food Intake Among Children and Adolescents in the United States, 2015–2018
- Key findings
- What percentage of children and adolescents consumed fast food on a given day?
- Did the percentage of calories consumed from fast food on a given day differ by sex or age?
- Did the percentage of calories consumed from fast food on a given day differ by race and Hispanic origin?
- Has the percentage of calories consumed from fast food on a given day among children and adolescents changed between 2003 and 2018?
- Summary
- Definitions
- Data source and methods
- About the authors
- References
- Suggested citation
PDF Version (422 KB) | Visual Abstract
Key findings
Data from the National Health and Nutrition Examination Survey
- During 2015–2018, over one-third (36.3%) of children and adolescents consumed fast food on a given day.
- During 2015–2018, children and adolescents consumed on average 13.8% of their daily calories from fast food on a given day. Adolescents aged 12–19 consumed a higher percentage of calories from fast food than children aged 2–11 years.
- Non-Hispanic white adolescents aged 12–19 consumed a lower percentage of calories from fast food on a given day than both non-Hispanic black and Hispanic adolescents.
- The percentage of calories from fast food in children and adolescents decreased from 14.1% in 2003–2004 to 10.6% in 2009–2010, and then increased to 14.4% in 2017–2018
Fast food has been associated with higher caloric intake and poorer diet quality in children and adolescents (1). In 2011–2012, children and adolescents aged 2–19 years consumed on average 12.4% of their daily calories from fast food on a given day (2). This report presents 2015–2018 estimates of the percentage of calories consumed from fast food on a given day among U.S. children and adolescents by demographic characteristics and trends since 2003.
Keywords: diet, restaurant, pizza, calories, NHANES
What percentage of children and adolescents consumed fast food on a given day?
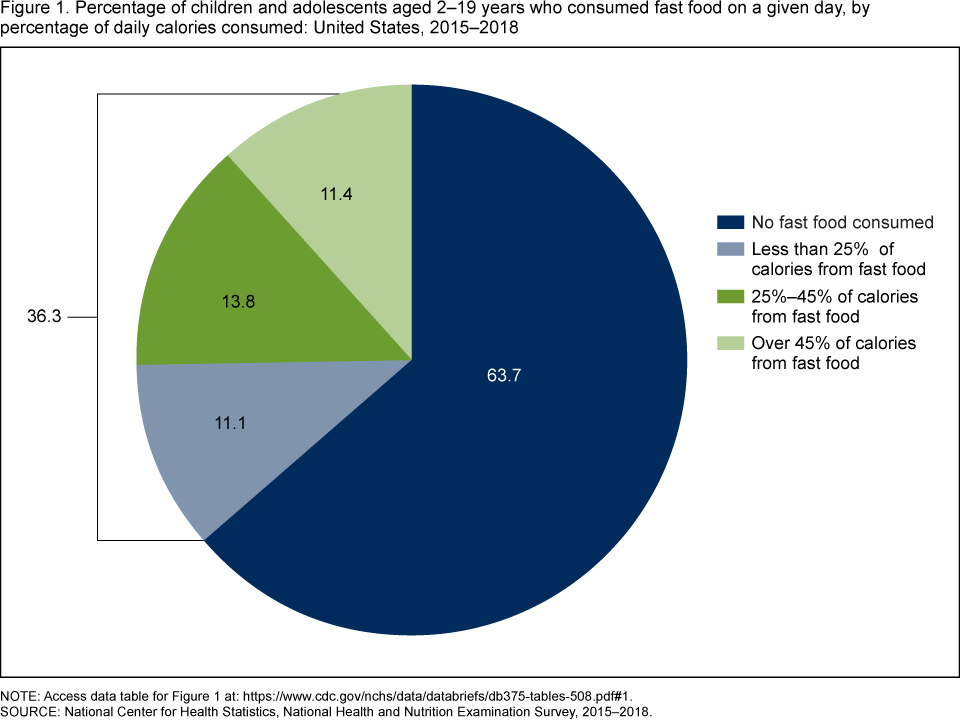
During 2015–2018, 36.3% of children and adolescents aged 2–19 years consumed fast food on a given day (Figure 1). Among children and adolescents, 11.1% obtained less than 25% of their daily calories from fast food, 13.8% obtained 25%–45% of their daily calories from fast food, and 11.4% obtained more than 45% of their daily calories from fast food.
Figure 1. Percentage of children and adolescents aged 2–19 years who consumed fast food on a given day, by percentage of daily calories consumed: United States, 2015–2018
NOTE: Access data table for Figure 1.
SOURCE: National Center for Health Statistics, National Health and Nutrition Examination Survey, 2015–2018.
Did the percentage of calories consumed from fast food on a given day differ by sex or age?
During 2015–2018, children and adolescents aged 2–19 years consumed on average 13.8% of their daily calories from fast food (Figure 2). For boys and girls overall, the observed difference in the percentage of calories from fast food was not significant. There was no difference by sex for children aged 2–11 years but in adolescents aged 12–19, girls (18.5%) had a higher average daily intake than boys (14.9%)
The percentage of calories consumed from fast food increased with age. In children aged 2–11 years, the average percentage of calories consumed from fast food was 11.4%, while in adolescents aged 12–19, the average percentage of calories consumed was 16.7%. This difference by age was seen among both boys and girls.
Figure 2. Mean percentage of calories from fast food on a given day among children and adolescents aged 2–19 years, by sex and age: United States, 2015–2018
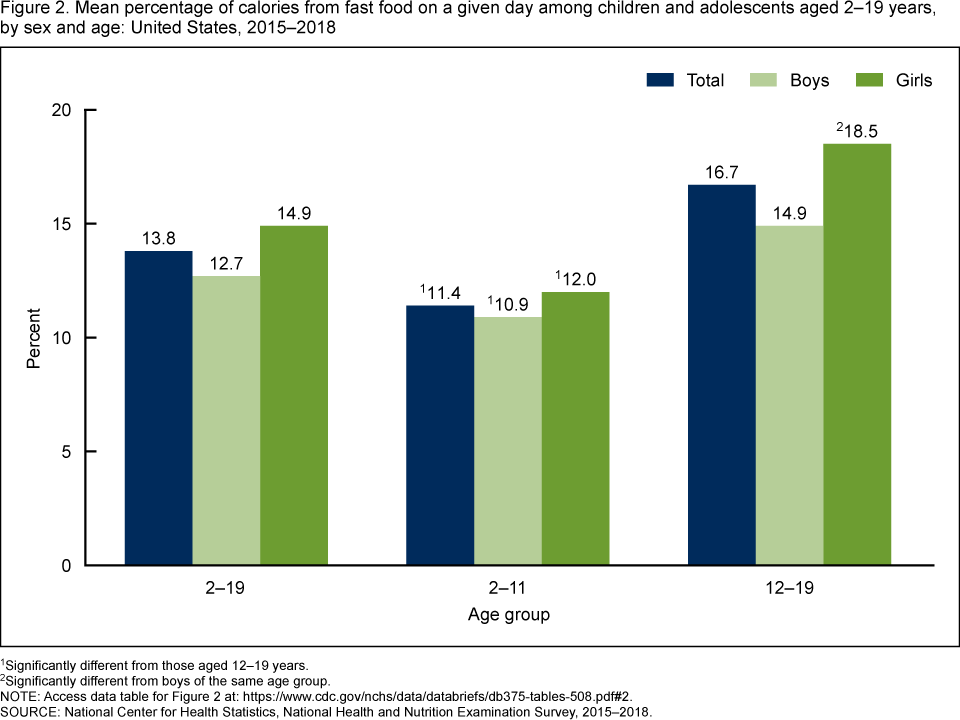
1Significantly different from those aged 12–19 years.
2Significantly different from boys of the same age group.
NOTE: Access data table for Figure 2.
SOURCE: National Center for Health Statistics, National Health and Nutrition Examination Survey, 2015–2018.
Did the percentage of calories consumed from fast food on a given day differ by race and Hispanic origin?
Non-Hispanic white children and adolescents aged 2–19 years consumed a significantly lower percentage of daily calories from fast food (12.9%) compared with non-Hispanic black (16.9%) and Hispanic (14.8%) children and adolescents (Figure 3). No significant difference was seen between Hispanic and non-Hispanic black children and adolescents.
There was no significant difference by race and Hispanic origin for children aged 2–11 years. However, among adolescents aged 12–19, non-Hispanic white adolescents consumed a significantly lower percentage of daily calories (14.8%) from fast food, compared with non-Hispanic black (21.5%) and Hispanic (18.5%) adolescents. The observed difference between non-Hispanic black and Hispanic adolescents was not significant.
Adolescents aged 12–19 consumed a higher percentage of calories from fast food than did children aged 2–11 years for all race and Hispanic origin-groups
Figure 3. Mean percentage of calories from fast food on a given day among children and adolescents aged 2–19 years, by race and Hispanic origin and age: United States, 2015–2018
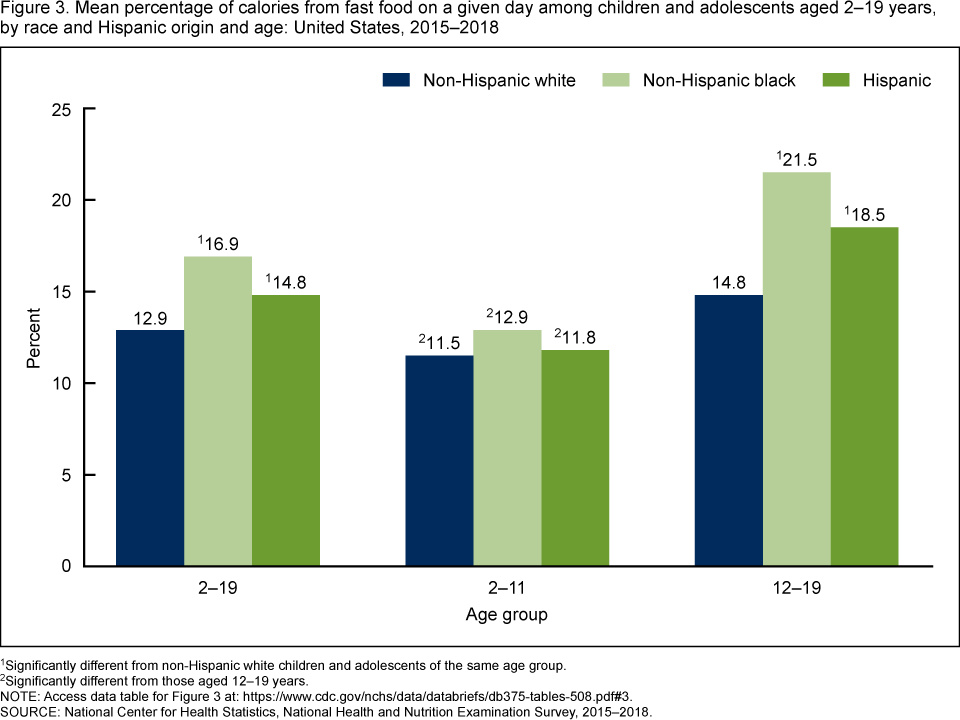
1Significantly different from non-Hispanic white children and adolescents of the same age group.
2Significantly different from those aged 12–19 years.
NOTE: Access data table for Figure 3.
SOURCE: National Center for Health Statistics, National Health and Nutrition Examination Survey, 2015–2018.
Has the percentage of calories consumed from fast food on a given day among children and adolescents changed between 2003 and 2018?
Overall, the average percentage of calories consumed from fast food among children and adolescents decreased from 14.1% in 2003–2004 to 10.6% in 2009–2010, and then increased to 14.4% in 2017–2018 (Figure 4).
A similar pattern was observed by age group. In children aged 2–11 years, the average percentage of calories consumed from fast food decreased from 12.1% in 2003–2004 to 8.5% in 2009–2010, and then increased to 11.5% in 2017–2018. For adolescents aged 12–19, the average percentage of calories consumed from fast food decreased from 16.4% in 2003–2004 to 13.1% in 2009–2010, and then increased to 18.0% in 2017–2018.
Figure 4. Trends in mean percentage of calories from fast food on a given day among children and adolescents aged 2–19 years: United States, 2003–2004 through 2017–2018
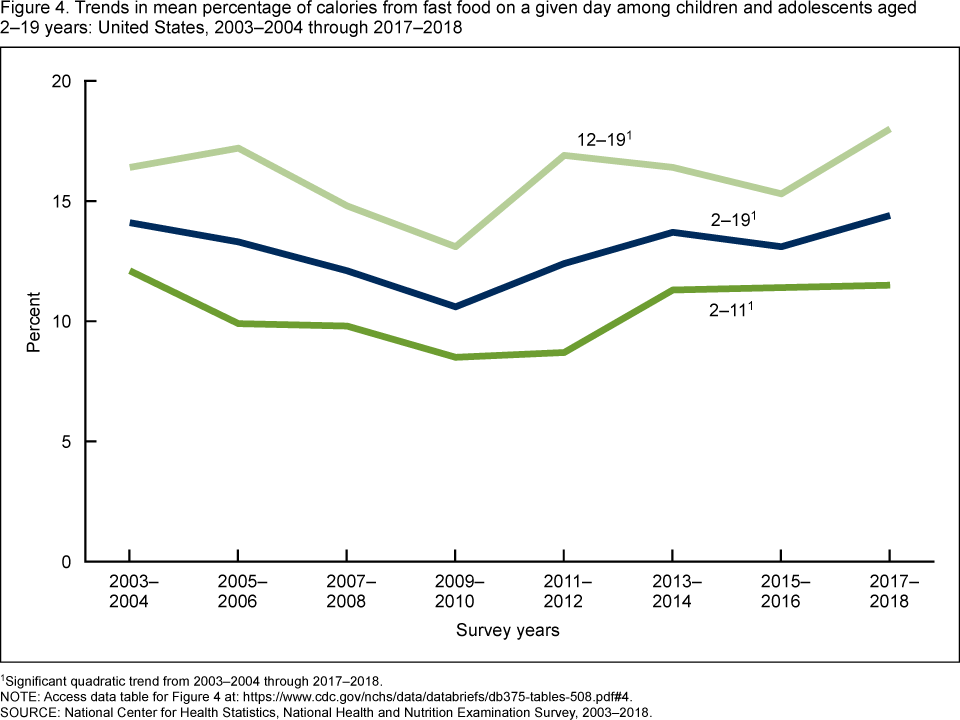
1Significant quadratic trend from 2003–2004 through 2017–2018
NOTE: Access data table for Figure 4.
SOURCE: National Center for Health Statistics, National Health and Nutrition Examination Survey, 2003–2018.
Summary
Fast food has been associated with increased intake of calories, fat, and sodium (3). During 2015–2018, over one-third of U.S. children and adolescents aged 2–19 years consumed fast food. Children and adolescents consumed an average 13.8% of their calories from fast food on any given day. Adolescents aged 12–19 consumed a higher average percentage of daily calories from fast food than did younger children, overall and across all demographics. The average percentage of calories from fast food was higher among non-Hispanic black and Hispanic adolescents than non-Hispanic white adolescents. The average percentage of calories consumed from fast food among children and adolescents decreased from 2003–2004 to 2009–2010, and then increased after 2009–2010.
Definitions
Fast-food: For each food and beverage item that respondents reported consuming during their 24-hour dietary recall, the participant is also asked about the source where they obtained those items. Food reported as “restaurant fast food/pizza” was considered fast food for these analyses.
Calories, kilocalories: A calorie is a measure of the energy produced as foods or beverages are burned for energy in the body. The term calorie is usually used when discussing energy from foods and diets, but the calorie being referred to is actually a kilocalorie (4). In this report, the term calorie refers to kilocalorie.
Percentage of daily calories from fast food: Computed as the calories from foods reported as fast foods divided by total calories reported for an individual on a given day multiplied by 100.
Data source and methods
Data from the National Health and Nutrition Examination Survey (NHANES) 2003–2018 were used for these analyses (5). Data from 2015–2018 were used to test differences between subgroups. Eight, 2-year cycles were used in testing trends over time in mean percentage of calories from fast food
NHANES is a cross-sectional survey conducted by the National Center for Health Statistics (NCHS) designed to monitor the health and nutritional status of the civilian noninstitutionalized U.S. population. It consists of home interviews followed by standardized physical examinations in mobile examination centers (MEC). The NHANES sample is selected through a complex, multistage probability design (6).
Dietary information was obtained via an in-person, 24-hour (midnight to midnight) dietary recall interview with trained interviewers in the MEC (7). Dietary interviews for participants less than six years of age were conducted with a proxy. Interviews of children aged 6 to 8 years were conducted with a proxy, and the child was present to assist in reporting intake information. Interviews of children aged 9–11 years were conducted with the child and the assistance of a proxy familiar with the child’s intake. Participants aged 12 years or older answered for themselves. Limitations, such as underreporting, are associated with 24-hour recalls and have been well characterized (7,8). However, despite these limitations, dietary data still have utility in assessing population outcomes (9). Fast food consumption, expressed as a percentage of total energy intake, partially adjusts for misreporting (8).
Day 1 dietary sample weights, which accounted for the differential probabilities of selection, nonresponse, and noncoverage, as well as day of the week of dietary recall and nonresponse to the dietary interview, were incorporated into the estimation process. Taylor series linearization was used to compute variance estimates. Differences between subgroups, as well as linear trends, were evaluated using orthogonal contrasts to calculate a Student’s t statistic. If a quadratic trend was found, Joinpoint software and piecewise regression were used to determine if changes in trend occurred over time (10). Differences were considered significant at p < 0.05. Statistical analyses were conducted using SAS-callable SUDAAN version 11.0 (RTI International, Research Triangle Park, N.C.).
About the authors
Cheryl D. Fryar, Margaret D. Carroll, Namanjeet Ahluwalia, and Cynthia L. Ogden are with the National Center for Health Statistics, Division of Health and Nutrition Examination Surveys.
References
- Powell LM, Nguyen BT. Fast-food and full-service restaurant consumption among children and adolescents: Effect on energy, beverage, and nutrient intake. JAMA Pediatr 167(1):14–20. 2013.
- Vikraman S, Fryar CD, Ogden CL. Caloric intake from fast food among children and adolescents in the United States, 2011–2012. NCHS Data Brief, no 213. Hyattsville, MD: National Center for Health Statistics. 2015.
- Wu HW, Sturm R. What’s on the menu? A review of the energy and nutritional content of U.S. chain restaurant menus. Public Health Nutr 16(1):87–96. 2013
- Energy. In: Food, nutrition, and diet therapy. 7th ed. Krause MV, Mahan LK, editors. Philadelphia, PA: WB Saunders Company. p 9–23. 1984.
- National Center for Health Statistics. National Health and Nutrition Examination Survey: Questionnaires, datasets, and related documentation.
- Chen TC, Clark J, Riddles MK, Mohadjer LK, Fakhouri THI. National Health and Nutrition Examination Survey, 2015−2018: Sample design and estimation procedures. National Center for Health Statistics. Vital Health Stat 2(184). 2020.
- Ahluwalia N, Dwyer J, Terry A, Moshfegh A, Johnson C. Update on NHANES dietary data: Focus on collection, release, analytical considerations, and uses to inform public policy. Adv Nutr 7(1):121–34. 2016.
- Subar AF, Freedman LS, Tooze JA, Kirkpatrick SI, Boushey C, Neuhouser ML, et al. Addressing current criticism regarding the value of self-report dietary data. J Nutr 145(12): 2639–45. 2015.
- Hebert JR, Hurley TG, Steck SE, Miller DR, Tabung FK, Peterson KE, et al. Considering the value of dietary assessment data in informing nutrition-related health policy. Adv Nutr 5(4):447–55. 2014.
- National Cancer Institute. Joinpoint trend analysis software (Version 4.5.0.1). 2017.
Suggested citation
Fryar CD, Carroll MD, Ahluwalia N, Ogden CL. Fast food intake among children and adolescents in the United States, 2015–2018. NCHS Data Brief, no 375. Hyattsville, MD: National Center for Health Statistics. 2020.
Copyright information
All material appearing in this report is in the public domain and may be reproduced or copied without permission; citation as to source, however, is appreciated.
National Center for Health Statistics
Brian C. Moyer, Ph.D., Director
Amy M. Branum, Ph.D., Acting Associate Director for Science
Division of Health and Nutrition Examination Surveys
Ryne Paulose-Ram, M.A., Ph.D., Acting Director
Lara Akinbami, M.D., Acting Associate Director for Science