Beverage Consumption Among Youth in the United States, 2013–2016
- Key findings
- What was the contribution of different beverage types to total beverage consumption among youth in 2013–2016?
- Were there differences in the contribution of different types of beverages to total beverage consumption among youth, by sex, in 2013–2016?
- Were there differences in the contribution of different types of beverages consumed among youth, by age, in 2013–2016?
- Were there differences in the contribution of different types of beverages consumed among youth, by race and Hispanic origin, in 2013–2016?
- Summary
- Definition
- Data source and methods
- About the authors
- References
- Suggested citation
PDF Version (357 KB)
Kirsten A. Herrick, Ph.D., M.Sc., Ana L. Terry, M.S., R.D., and Joseph Afful, M.S.
Key findings
Data from the National Health and Nutrition Examination Survey
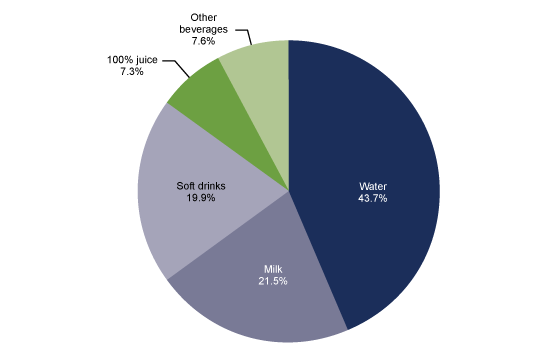
- In 2013–2016, water accounted for 43.7% of total beverage consumption among U.S. youth, followed by milk (21.5%), soft drinks (19.9%), 100% juice (7.3%), and other beverages (7.6%).
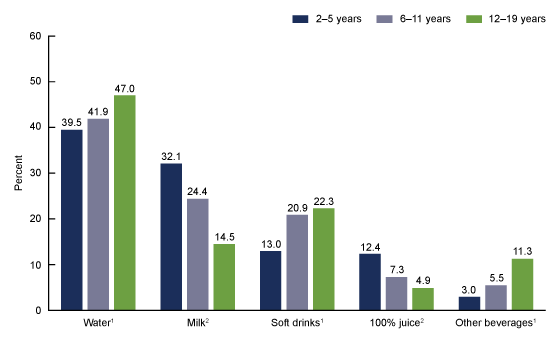
- The contribution of milk and 100% juice to total beverage consumption decreased with age, while the contribution of water and soft drinks increased with age.
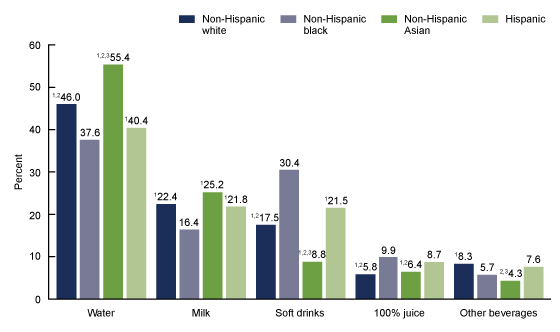
- The contribution of water and milk to total beverage consumption was higher for non-Hispanic Asian youth (55.4% and 25.2%) and lower for non-Hispanic black youth (37.6% and 16.4%).
- The contribution of soft drinks to total beverage consumption was higher among non-Hispanic black (30.4%) compared with non-Hispanic white (17.5%), non-Hispanic Asian (8.8%), and Hispanic youth (21.5%).
Beverages contribute to hydration and affect total calorie intake (1). For all individuals aged 2 years and over, the 2015–2020 Dietary Guidelines for Americans recommend that water, fat-free and low-fat milk, and 100% juice be the primary beverages consumed (2). The American Academy of Pediatrics also supports this advice for youth (3). This report describes the contribution of different beverage types to total beverage consumption, by grams, among U.S. youth.
Keywords: drinks, NHANES
What was the contribution of different beverage types to total beverage consumption among youth in 2013–2016?
Water accounted for 43.7% of total beverage consumption among U.S. youth, followed by milk (21.5%), soft drinks (19.9%), 100% juice (7.3%), and other beverages (7.6%) (Figure 1).
Figure 1. Contribution of beverage types to total beverage consumption among youth aged 2–19 years: United States, 2013–2016
NOTES: Percentages are based on total grams of reported beverage intake. Other beverages include: coffee, tea, sports and energy drinks, and other miscellaneous beverages. Access data table for Figure 1.
SOURCE: NCHS, National Health and Nutrition Examination Survey, 2013–2016>.
Were there differences in the contribution of different types of beverages to total beverage consumption among youth, by sex, in 2013–2016?
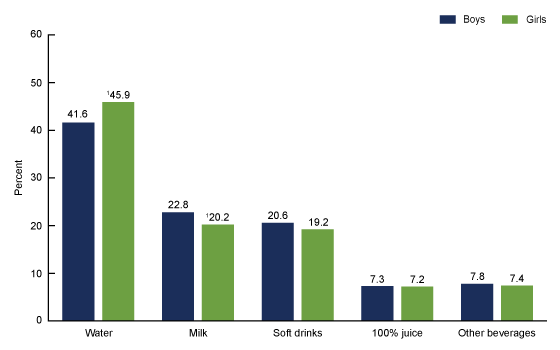
Water accounted for a smaller percentage of total beverage consumption among boys compared with girls, 41.6% and 45.9% (Figure 2). Milk accounted for a larger percentage of total beverage consumption among boys compared with girls, 22.8% and 20.2%. The contribution of 100% juice, soft drinks, and other beverages to total beverage consumption did not differ by sex.
Figure 2. Contribution of beverage types to total beverage consumption among youth aged 2–19 years, by sex: United States, 2013–2016
1Significantly different from boys.
NOTES: Percentages are based on total grams of reported beverage intake. Other beverages include: coffee, tea, sports and energy drinks, and other miscellaneous beverages. Access data table for Figure 2.
SOURCE: NCHS, National Health and Nutrition Examination Survey, 2013–2016.
Were there differences in the contribution of different types of beverages consumed among youth, by age, in 2013–2016?
The contribution of water to total beverage consumption increased with age, from 39.5% to 41.9% and 47.0%, among youth aged 2–5, 6–11, and 12–19 years (Figure 3). Soft drink consumption also increased with age (13.0%, 20.9%, and 22.3%), as did other beverages (3.0%, 5.5%, and 11.3%). The contribution of milk to total beverage consumption decreased with age, from 32.1% among those aged 2–5 years, to 24.4% and 14.5% among those aged 6–11 and 12–19 years, respectively. 100% juice followed a similar pattern, decreasing from 12.4% to 7.3% and 4.9%.
Figure 3. Contribution of beverage types to total beverage consumption among youth aged 2–19 years, by age: United States, 2013–2016
1Significant increasing trend with age.
2Significant decreasing trend with age.
NOTES: Percentages are based on total grams of reported beverage intake. Other beverages include: coffee, tea, sports and energy drinks, and other miscellaneous beverages. Access data table for Figure 3.
SOURCE: NCHS, National Health and Nutrition Examination Survey, 2013–2016.
Were there differences in the contribution of different types of beverages consumed among youth, by race and Hispanic origin, in 2013–2016?
Water contributed to more than one-half (55.4%) of total beverage consumption among non-Hispanic Asian youth, higher than non-Hispanic white (46.0%), non-Hispanic black (37.6%) and Hispanic (40.4%) youth (Figure 4). All differences by race and Hispanic origin were significant.
Milk accounted for 25.2% of total beverage intake among non-Hispanic Asian youth, 22.4% among non-Hispanic white youth, and 21.8% among Hispanic youth, all higher than among non-Hispanic black youth (16.4%).
Soft drinks accounted for the greatest proportion of total beverage consumption for non-Hispanic black youth (30.4%), followed by Hispanic (21.5%), non-Hispanic white (17.5%), and non-Hispanic Asian youth (8.8%). All differences by race and Hispanic origin were significant.
For non-Hispanic black and Hispanic youth, 100% juice accounted for 9.9% and 8.7% of total beverage consumption, higher than non-Hispanic white (5.8%) and non-Hispanic Asian (6.4%) youth.
Other beverages accounted for 4.3% of total beverage consumption among non-Hispanic Asian youth, less than non-Hispanic white (8.3%) and Hispanic (7.6%) youth. Other beverages also accounted for less total beverage consumption among non-Hispanic black (5.7%) compared with non-Hispanic white youth. The observed difference between non-Hispanic black and Hispanic youth was not significant.
Figure 4. Contribution of beverage types to total beverage consumption among youth aged 2–19 years, by race and Hispanic origin: United States, 2013–2016
1Significantly different from non-Hispanic black persons.
2Significantly different from Hispanic persons.
3Significantly different from non-Hispanic white persons.
NOTES: Percentages are based on total grams of reported beverage intake. Other beverages include: coffee, tea, sports and energy drinks, and other miscellaneous beverages. Access data table for Figure 4.
SOURCE: NCHS, National Health and Nutrition Examination Survey, 2013–2016.
Summary
In 2013–2016, water and milk accounted for close to two-thirds of total beverage intake among youth aged 2–19 years. Soft drinks accounted for one-fifth of total beverage intake, followed by other beverages and 100% juice among U.S. youth.
Sex differences in the contribution of water and milk were small. Differences by age were more pronounced. The contribution of water, soft drinks, and other beverages to total beverage intake increased with age, while the contribution of milk and 100% juices to total beverage intake decreased with age.
There were significant differences in the consumption patterns of different beverages by race and Hispanic origin. For non-Hispanic Asian youth, water and milk contributed more to total beverage intake than for other race and Hispanic-origin groups. Soft drinks accounted for almost one-third of total beverage intake for non-Hispanic black youth, significantly more than all other race and Hispanic-origin groups; the next largest contribution of soft drinks to total beverage intake was 21.5% among Hispanic youth.
Beverage choices can impact diet quality and total calorie intake. Soft drinks accounted for 20% of total beverages consumed among youth. They include a wide variety of beverages, typically associated with increased intake of added sugar, thus adding extra calories without the benefit of vitamins, minerals, and fiber. 100% juice, which accounted for 7% of beverage intake, can provide important nutrients, but lacks fiber and can contribute to extra calories when consumed in excess (2).
Definition
Beverages: Beverages were grouped as: water, milk, soft drinks, 100% juice, and other beverages. Water included unsweetened bottled and tap water, both carbonated and non-carbonated varieties. Milk included dairy milk substitutes, such as soy milk. Soft drinks, both diet and non-diet forms, included soda and fruit drinks (including sweetened bottled waters and fruit nectars). 100% juices included fruit and vegetable juices with no added sugar. Other beverages included coffee, tea, sports and energy drinks, and other miscellaneous beverages not included in the groups above. Alcoholic beverages were not included. Estimates represent a ratio of the grams of each beverage type divided by the total grams of all included beverages, multiplied by 100.
Data source and methods
The National Health and Nutrition Examination Survey (NHANES) is a cross-sectional survey conducted by the National Center for Health Statistics (NCHS) designed to monitor the health and nutritional status of the civilian noninstitutionalized U.S. population (4). It consists of home interviews followed by standardized physical examinations conducted in mobile examination centers (MECs). For this report, data were collected through an in-person 24-hour dietary recall interview, which covers intake during the day 24 hours, midnight to midnight) before the standardized physical examination in the MEC (5). Limitations, such as underreporting, associated with 24-hour recalls have been well characterized (6) but do not diminish the utility of the NHANES dietary data in assessing population outcomes (7). Beverage consumption, expressed as a percentage of total beverage consumption, partially adjusts for misreporting (8, 9).
The NHANES sample is selected through a complex, multistage probability design. In 2013–2016, non-Hispanic black, non-Hispanic Asian, and Hispanic persons were oversampled; for more information, visit the NHANES website. Race and Hispanic-origin-specific estimates reflect individuals reporting only one race; those reporting more than one race are included in the total but are not reported separately. Children who consumed breast milk and youth who reported consuming no beverages were excluded from these analyses (less than 0.5%).
Day 1 dietary weights were used to account for the days of the week, differential probabilities of selection, nonresponse, and noncoverage. Taylor series linearization was used to compute variance estimates. Differences between groups were tested using a univariate t statistic. Test for trends by age were evaluated using orthogonal polynomials to determine linear trends. The significance level for statistical testing was set at p < 0.05. All differences reported are statistically significant unless otherwise indicated. Data management and statistical analyses were conducted using SAS System for Windows version 9.4 (SAS Institute, Inc., Cary, N.C.) and SUDAAN version 11.0 (RTI International, Research Triangle Park, N.C.).
About the authors
Kirsten A. Herrick and Ana L. Terry are with the National Center for Health Statistics, Division of Health and Nutrition Examination Surveys. Joseph Afful is with Peraton Corporation.
References
- Institute of Medicine. Dietary reference intakes for water, potassium, sodium, chloride, and sulfate. Washington, DC: The National Academies Press. 2005.
- U.S. Department of Health and Human Services and U.S. Department of Agriculture. 2015–2020 Dietary guidelines for Americans, 8th ed.
- Heyman MB, Abrams SA; Section on Gastroenterology, Hepatology, and Nutrition; Committee on Nutrition. Fruit juice in infants, children, and adolescents: Current recommendations. Pediatrics 139(6). 2017.
- Johnson CL, Dohrmann SM, Burt VL, Mohadjer LK. National Health and Human Examination Survey: Sample design, 2011–2014. National Center for Health Statistics. Vital Health Stat 2(162). 2014.
- National Center for Health Statistics. National Health and Nutrition Examination Survey MEC in-person dietary interviewers procedure manual. 2016.
- Subar AF, Freedman LS, Tooze JA, Kirkpatrick SI, Boushey C, Neuhouser ML, et al. Addressing current criticism regarding the value of self-report dietary data. J Nutr 145(12):2639–45. 2015.
- Ahluwalia N, Dwyer J, Terry A, Moshfegh A, Johnson C. Update on NHANES dietary data: Focus on collection, release, analytical considerations, and uses to inform public policy. Adv Nutr 7(1):121–34. 2016.
- Hebert JR, Hurley TG, Steck SE, Miller DR, Tabung FK, Peterson KE, et al. Considering the value of dietary assessment data in informing nutrition-related health policy. 5(4):447–55. 2014.
- Willett W. Nutritional Epidemiology, 3rd ed. New York: Oxford University Press. 2013.
Suggested citation
Herrick KA, Terry AL, Afful J. Beverage consumption among youth in the United States, 2013–2016. NCHS Data Brief, no 320. Hyattsville, MD: National Center for Health Statistics. 2018.
Copyright information
All material appearing in this report is in the public domain and may be reproduced or copied without permission; citation as to source, however, is appreciated.
National Center for Health Statistics
Charles J. Rothwell, M.S., M.B.A., Director
Jennifer H. Madans, Ph.D., Associate Director for Science
Division of Health and Nutrition Examination Surveys
Kathryn S. Porter, M.D., M.S., Director
Ryne Paulose-Ram, M.A., Ph.D., Associate Director for Science


