Variation in Residential Care Community Resident Characteristics, by Size of Community: United States, 2016
- Key findings
- In 2016, residents in larger communities were older than those in smaller communities.
- A higher percentage of residents in communities with 4–25 beds were receiving Medicaid compared with residents in larger communities.
- The prevalence of Alzheimer disease and depression was higher among residents in communities with 4–25 beds than in larger communities.
- The percentage of residents needing assistance with bathing, dressing, toileting, transferring, walking, or eating was highest in communities with 4–25 beds.
- The percentage of residents who had fallen in the previous 90 days increased with increasing community bed size.
- Summary
- Definitions
- Data source and methods
- About the authors
- References
- Suggested citation
NCHS Data Brief No. 299, February 2018
PDF Version (518 KB)
Christine Caffrey, Ph.D., and Manisha Sengupta, Ph.D.
Key findings
Data from the National Study of Long-Term Care Providers
- More residents in residential care communities with more than 25 beds were aged 85 and over compared with smaller communities.
- A higher percentage of residents in communities with 4–25 beds were receiving Medicaid compared with residents in larger communities.
- The prevalence of Alzheimer disease and depression was higher among residents of communities with 4–25 beds than in larger communities, but the prevalence of cardiovascular disease was lower.
- The percentage of residents needing assistance with bathing, dressing, toileting, transferring, walking, or eating was highest in communities with 4–25 beds.
- The percentage of residents who had fallen in the previous 90 days increased with increasing community bed size.
Residents of residential care communities are persons who cannot live independently but generally do not require the skilled care provided by nursing homes. On any given day in 2016, an estimated 811,500 residents were in residential care communities (1,2). As the population ages, the numbers in residential care communities will likely increase, creating a sizeable group within the long-term care population. This report presents national estimates of selected characteristics of residential care community residents in 2016 and compares them by community size. State-level estimates are available from: https://www.cdc.gov/nchs/nsltcp/nsltcp_products.htm.
Keywords: assisted living, long-term services and supports, National Study of Long-Term Care Providers
In 2016, residents in larger communities were older than those in smaller communities.
- Overall, the majority of residents of residential care communities (52%) were aged 85 and over (Figure 1).
- In 2016, 16% of residents living in residential care communities with 4–25 beds were under age 65, compared with 4% in communities with more than 50 beds.
- Residents aged 85 and over made up a higher percentage in communities with more than 50 beds (54%) than in communities with 4–25 beds (44%).
Figure 1. Age distribution of residential care residents, by community size: United States, 2016
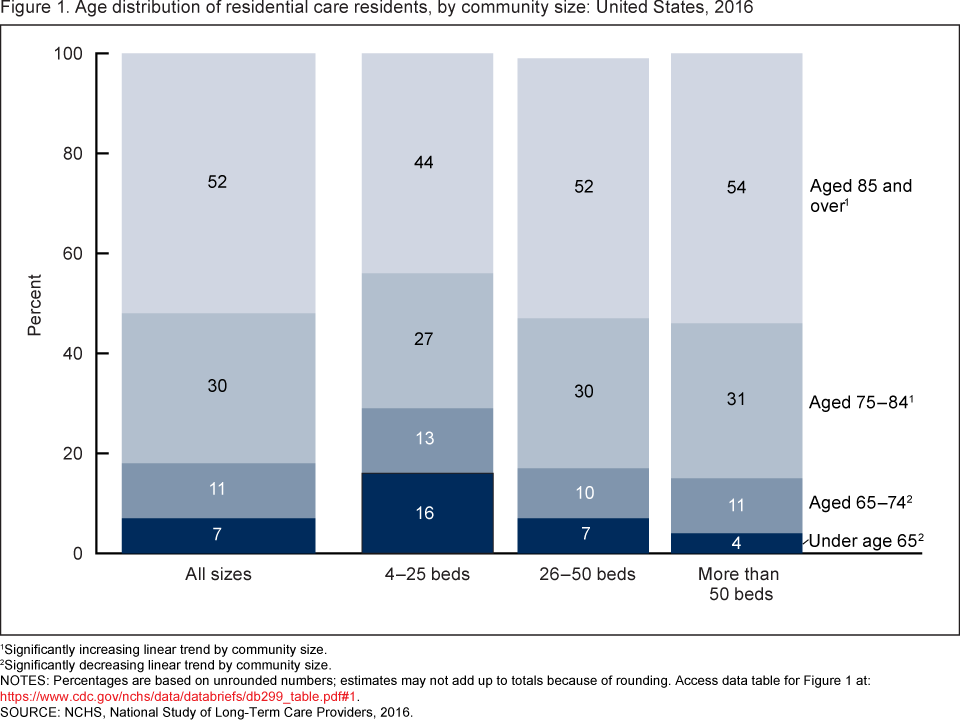
1Significantly increasing linear trend by community size.
2Significantly decreasing linear trend by community size.
NOTES: Percentages are based on unrounded numbers; estimates may not add up to totals because of rounding. Access data table for Figure 1.
SOURCE: NCHS, National Study of Long-Term Care Providers, 2016.
A higher percentage of residents in communities with 4–25 beds were receiving Medicaid compared with residents in larger communities.
- The percentage of residents receiving Medicaid decreased with increasing bed size. Twenty-five percent of residents in communities with 4–25 beds had at least some services paid by Medicaid, compared with 18% of residents in communities with 26–50 beds and 14% in communities with more than 50 beds (Figure 2).
- Overall, 71% of residents in residential care communities were female. The percentage of females was lower in communities with 4–25 beds (67%) than in communities with 26–50 beds (72%) or more than 50 beds (71%).
- Eighty percent of residents in communities with 4–25 beds or more than 50 beds were non-Hispanic white, compared with 88% in communities with 26–50 beds.
Figure 2. Selected characteristics of residential care residents, by community size: United States, 2016
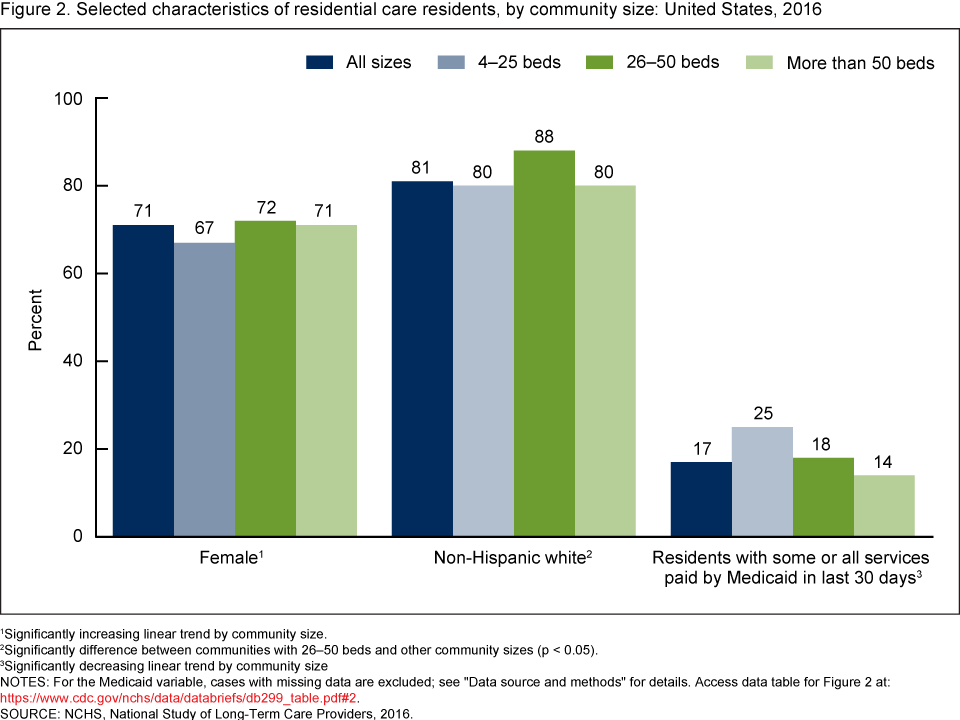
1Significantly increasing linear trend by community size.
2Significantly difference between communities with 26–50 beds and other community sizes (p < 0.05).
3Significantly decreasing linear trend by community size.
NOTES: For the Medicaid variable, cases with missing data are excluded; see “Data source and methods” for details. Access data table for Figure 2.
SOURCE: NCHS, National Study of Long-Term Care Providers, 2016.
The prevalence of Alzheimer disease and depression was higher among residents in communities with 4–25 beds than in larger communities.
- Overall, about 4 in 10 residents were diagnosed with Alzheimer disease or other dementias (42%), about 3 in 10 were diagnosed with heart disease (34%) or depression (31%), and nearly 2 in 10 were diagnosed with diabetes (18%) (Figure 3).
- The percentage of residents with Alzheimer disease and other dementias decreased with increasing community size, from 51% of residents in communities with 4–25 beds to 44% in communities with 26–50 beds and to 39% in larger communities.
- A higher percentage of residents in communities with 26–50 beds and more than 50 beds (35% each) had heart disease compared with residents in smaller communities (32%).
- A higher percentage of residents in communities with 4–25 beds had ever been diagnosed with depression (37%) compared with residents in communities with 26–50 beds (32%) or more than 50 beds (29%).
Figure 3. Selected diagnosed medical conditions among residential care residents, by community size: United States, 2016
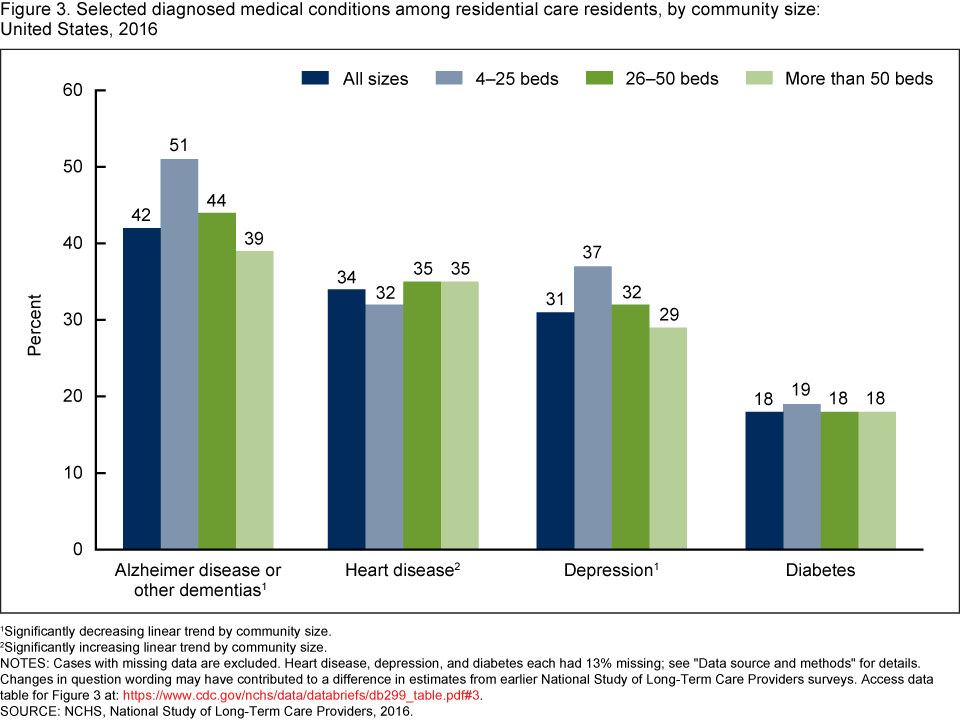
1Significantly decreasing linear trend by community size.
2Significantly increasing linear trend by community size.
NOTES: Cases with missing data are excluded. Heart disease, depression, and diabetes each had 13% missing; see “Data source and methods” for details. Changes in question wording may have contributed to a difference in estimates from earlier National Study of Long-Term Care Providers surveys. Access data table for Figure 3.
SOURCE: NCHS, National Study of Long-Term Care Providers, 2016.
The percentage of residents needing assistance with bathing, dressing, toileting, transferring, walking, or eating was highest in communities with 4–25 beds.
- Overall, 64% of residents needed assistance with bathing, the most frequent functional limitation among residents (Figure 4), and this percentage decreased with increasing community bed size. Of those in communities with 4–25 beds, 76% needed help with bathing compared with 60% of those in communities with more than 50 beds.
- The need for eating assistance decreased with increasing community bed size, from 34% of residents in communities with 4–25 beds to 16% of residents in communities with more than 50 beds.
- The need for assistance with walking, dressing, toileting, and transferring in or out of bed or a chair was higher for residents in communities with 4–25 beds compared with larger communities.
Figure 4. Need for assistance with selected activities of daily living among residential care residents, by community size: United States, 2016
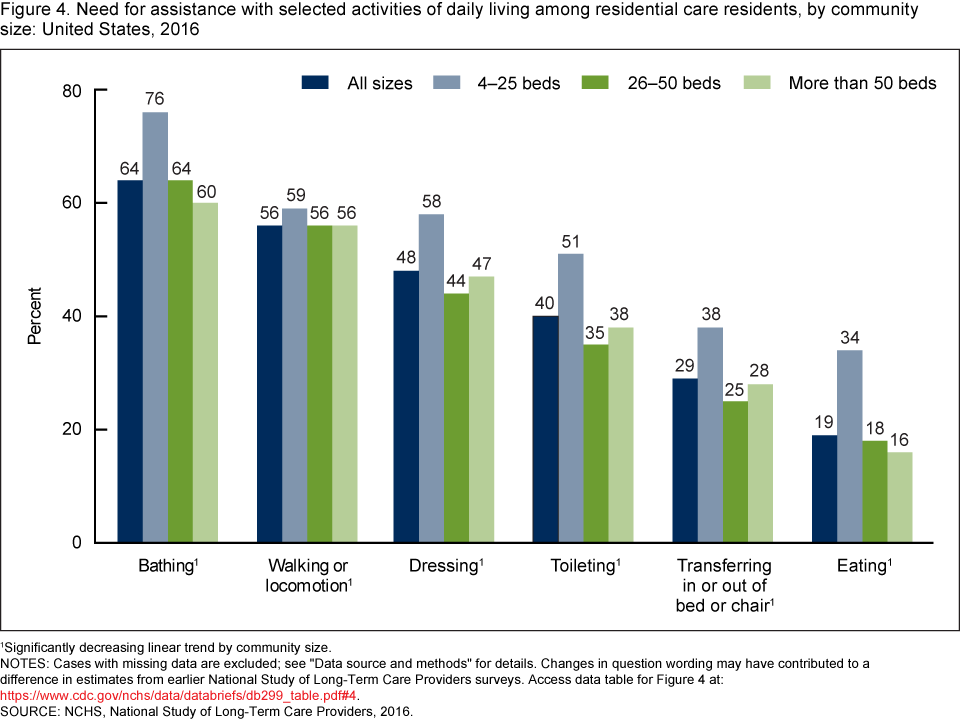
1Significantly decreasing linear trend by community size.
NOTES: Cases with missing data are excluded; see “Data source and methods” for details. Changes in question wording may have contributed to a difference in estimates from earlier National Study of Long-Term Care Providers surveys. Access data table for Figure 4.
SOURCE: NCHS, National Study of Long-Term Care Providers, 2016.
The percentage of residents who had fallen in the previous 90 days increased with increasing community bed size.
- Overall, about 2 in 10 residents in residential care communities had a fall in the previous 90 days (22%). The percentage increased with increasing community bed size, from 12% of residents in communities with 4–25 beds to 24% in communities with more than 50 beds (Figure 5).
- Fourteen percent of residents in residential care communities visited a hospital emergency department in the previous 90 days.
- A slightly higher percentage of residents in communities with 26–50 beds and more than 50 beds were discharged from overnight hospital stays in the previous 90 days (9% each) compared with residents in communities with 4–25 beds (7%).
Figure 5. Falls, emergency department visits, and discharges from overnight hospital stays among residential care residents, by community size: United States, 2016
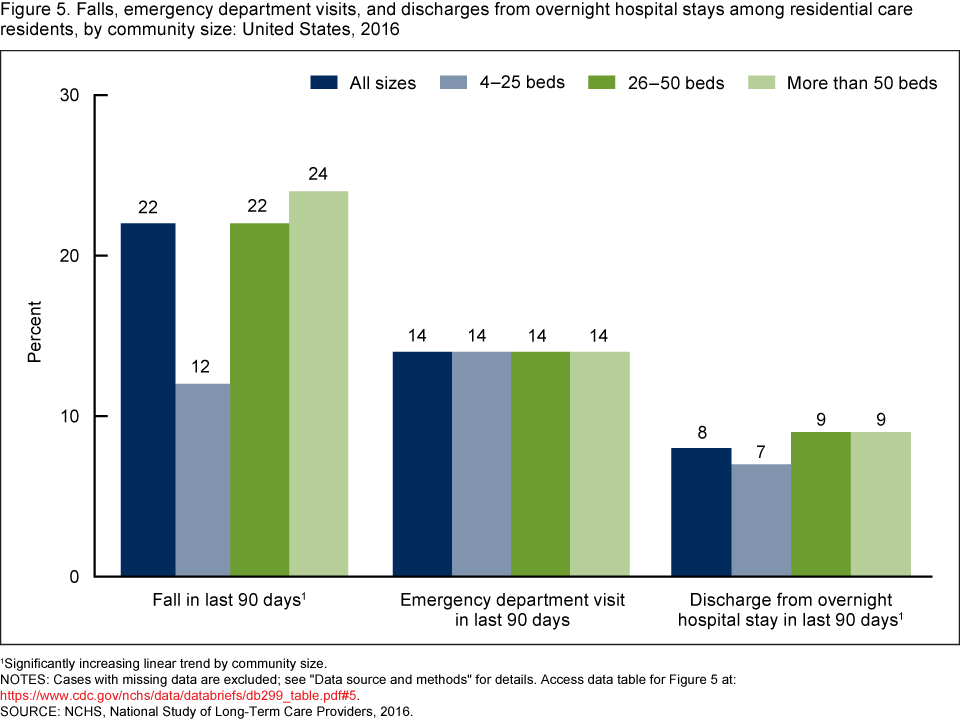
1Significantly increasing linear trend by community size.
NOTES: Cases with missing data are excluded; see “Data source and methods” for details. Access data table for Figure 5.
SOURCE: NCHS, National Study of Long-Term Care Providers, 2016.
Summary
In 2016 in the United States, the resident population living in residential care communities with 4–25 beds differed from the resident population living in larger residential care communities in a variety of sociodemographic, functional and health status, and service utilization characteristics.
Compared with residents in communities with more than 25 beds, a higher percentage of residents in 4– to 25–bed communities were younger; receiving Medicaid; living with Alzheimer disease or other dementias, or depression; and needing assistance with each of the six activities of daily living examined. Conversely, compared with residents in communities with more than 25 beds, a lower percentage of residents in communities with 4–25 beds were female, living with heart disease, or had fallen or had an overnight hospital stay in the previous 90 days.
This report presents the most current national estimates of selected characteristics of residents in residential care communities and compares these characteristics by bed size. This brief profile of residential care residents provides information to policy makers, providers, researchers, and consumer advocates as they plan how best to meet the needs of an aging population. Corresponding state estimates, and their standard errors, for the national figures in this data brief can be found at: https://www.cdc.gov/nchs/nsltcp/nsltcp_products.htm.
Definitions
Assistance with selected activities of daily living (ADLs): Refers to residents needing any help or supervision from another person, or use of assistive devices, with up to six limitations in ADLs (bathing; walking or locomotion—includes using a cane, walker, or wheelchair, or help from another person; dressing; transferring in and out of a bed or chair; toileting; and eating) that reflect a resident’s capacity for self-care.
Community bed size: Residents were grouped based on the number of licensed, registered, or certified residential care beds (both occupied and unoccupied) in their residential care community: 4–25 beds, 26–50 beds, and more than 50 beds.
Emergency department visits: Includes residents who were treated at least once in a hospital emergency department in the 90 days prior to the survey.
Falls: Includes residents with at least one on-site or off-site fall in the 90 days prior to the survey.
Heart disease: Includes conditions such as congestive heart failure, coronary or ischemic heart disease, heart attack, and stroke.
Overnight hospital stays: Includes residents with at least one discharge from an overnight hospital stay in the 90 days prior to the survey. Trips to the emergency department that did not result in a discharge from an overnight hospital stay were excluded.
Residential care communities: Includes assisted living communities and other residential care communities (e.g., personal care homes, adult care homes, board care homes, or adult foster care) that meet the study eligibility criteria described in “Data source and methods.”
Residents with some or all long-term care services paid by Medicaid: Refers to residents who had some or all of their long-term care services paid by Medicaid during the 30 days prior to the survey.
Data source and methods
Data for this report are from the Residential Care Community Survey component of the 2016 wave of the biennial National Study of Long-Term Care Providers (NSLTCP), conducted by the National Center for Health Statistics. To be eligible for the study, a residential care community must (a) be regulated by the state to provide room and board with at least two meals a day, around-the-clock on-site supervision, and help with personal care such as bathing and dressing or with health-related services such as medication management; (b) have four or more licensed, certified, or registered beds; (c) have at least one resident currently living in the community at the time of the survey; and (d) serve a predominantly adult population. The survey used a combination of probability sampling and taking a census. More details about the NSLTCP design and outcomes are available elsewhere (1,2). The percentage of cases with missing data for variables in this report ranged from 2.7% for receiving Medicaid to about 13% for heart disease, depression, and diabetes. These cases were excluded from the analyses on a variable-by-variable basis. If the percentage missing was higher than 10%, it is noted in the data.
Data analyses were performed using the following statistical packages: SAS, version 9.3 (SAS Institute, Cary, N.C.); SAS-callable SUDAAN, version 11.0.0 (RTI International, Research Triangle Park, N.C., 2012); and STATA/SE, version 12.1 (StataCorp, College Station, Texas, 2013). Statements of differences among subgroups are based on two-tailed chi-square and t tests with significance at the p < 0.05 level. If a chi-square test was statistically significant, a post hoc t test procedure was used to make pairwise comparisons among different community bed sizes. A weighted least-squares regression method was used to test the significance of linear trends in bed size. The estimate of the number of residential care communities and residents varied among the 2010 National Survey of Residential Care Facilities and the 2012–2016 waves of NSLTCP (1,2).
About the authors
Christine Caffrey and Manisha Sengupta are with the National Center for Health Statistics, Division of Health Care Statistics, Long-Term Care Statistics Branch.
References
- National Center for Health Statistics. 2016 National Study of Long-Term Care Providers survey methodology for the Adult Day Services Center and Residential Care Community components. Hyattsville, MD. 2017.
- National Center for Health Statistics. 2016 National Study of Long-Term Care Providers (NSLTCP) Residential Care Communities Survey restricted data file: Data description and usage (readme). Hyattsville, MD. 2017.
Suggested citation
Caffrey C, Sengupta M. Variation in residential care community resident characteristics, by size of community: United States, 2016. NCHS Data Brief, no 299. Hyattsville, MD: National Center for Health Statistics. 2018.
Copyright information
All material appearing in this report is in the public domain and may be reproduced or copied without permission; citation as to source, however, is appreciated.
National Center for Health Statistics
Charles J. Rothwell, M.S., M.B.A., Director
Jennifer H. Madans, Ph.D., Associate Director for Science
Division of Health Care Statistics
Denys T. Lau, Ph.D., Acting Director
Alexander Strashny, Ph.D., Associate Director for Science