Hypertension Prevalence and Control Among Adults: United States, 2015–2016
- Key findings
- What was the prevalence of hypertension among adults during 2015–2016?
- Were differences seen in the prevalence of hypertension among adults by race and Hispanic origin during 2015–2016?
- What percentage of adults with hypertension had their blood pressure controlled?
- Among adults with hypertension, were differences seen in blood pressure control by race and Hispanic origin during 2015–2016?
- Has overall prevalence and control of hypertension changed between 1999 and 2016?
- Summary
- Definitions
- Data source and methods
- About the authors
- References
- Suggested citation
NCHS Data Brief No. 289, October 2017
PDF Version (362 KB)
Cheryl D. Fryar, M.S.P.H., Yechiam Ostchega, Ph.D., R.N., Craig M. Hales, M.D., M.P.H., Guangyu Zhang, Ph.D., and Deanna Kruszon-Moran, M.S.
Key findings
Data from the National Health and Nutrition Examination Survey
- During 2015–2016, the prevalence of hypertension was 29.0% and increased with age: age group 18–39, 7.5%; 40–59, 33.2%; and 60 and over, 63.1%.
- Hypertension prevalence was higher among non-Hispanic black (40.3%) than non-Hispanic white (27.8%), non-Hispanic Asian (25.0%), or Hispanic (27.8%) adults.
- Prevalence of controlled hypertension was 48.3% and increased with age for men but not women.
- Hypertension control was higher among non-Hispanic white (50.8%) than non-Hispanic black (44.6%) or non-Hispanic Asian (37.4%) adults.
- From 1999 to 2016, hypertension prevalence was unchanged. For controlled hypertension, prevalence increased from 1999 to 2010 but then did not change through 2016.
Hypertension remains an important public health challenge in the United States because it increases the risk for cardiovascular disease. Effective blood pressure management has been shown to decrease the incidence of stroke, heart attack, and heart failure (1–3). This report presents updated estimates (4) for the prevalence and control of hypertension in the United States for 2015–2016. Trends in hypertension prevalence and control from 1999–2000 through 2015–2016 are also presented.
Keywords: high blood pressure, National Health and Nutrition Examination Survey
What was the prevalence of hypertension among adults during 2015–2016?
Overall, the prevalence of hypertension among adults was 29.0%, and was similar among men (30.2%) and women (27.7%) (Figure 1).
The prevalence of hypertension increased with age, from 7.5% among adults aged 18–39 to 33.2% among those aged 40–59, and 63.1% among those aged 60 and over. A similar pattern was found among both men and women.
Men had a higher prevalence of hypertension than women among adults aged 18–39 (9.2% compared with 5.6%, respectively) and 40–59 (37.2% compared with 29.4%, respectively), but men had a lower prevalence of hypertension than women among adults 60 and over (58.5% compared with 66.8%, respectively).
Figure 1. Prevalence of hypertension among adults aged 18 and over, by sex and age: United States, 2015–2016
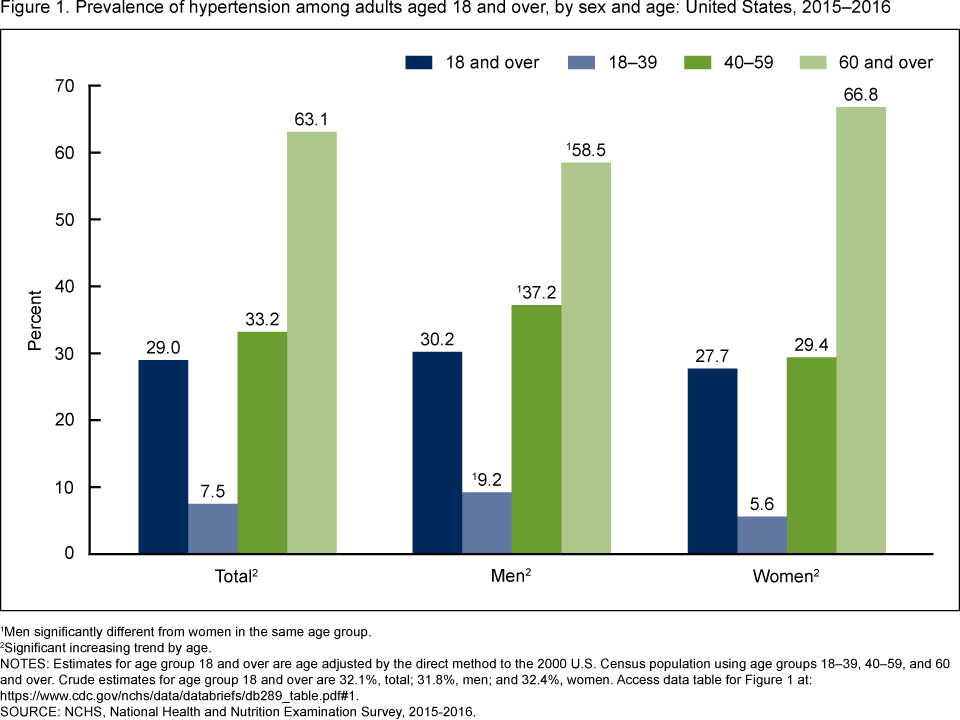
1Men significantly different from women in the same age group.
2Significant increasing trend by age.
NOTES: Estimates for age group 18 and over are age adjusted by the direct method to the 2000 U.S. Census population using age groups 18–39, 40–59, and 60 and over. Crude estimates for age group 18 and over are 32.1%, total; 31.8%, men; and 32.4%, women. Access data table for Figure 1.
SOURCE: NCHS, National Health and Nutrition Examination Survey, 2015–2016.
Were differences seen in the prevalence of hypertension among adults by race and Hispanic origin during 2015–2016?
For all adults, the prevalence of hypertension among non-Hispanic black (40.3%) adults was higher than among non-Hispanic white (27.8%), non-Hispanic Asian (25.0%), and Hispanic (27.8%) adults (Figure 2).
In men, the prevalence of hypertension was higher among non-Hispanic black (40.6%) adults than among non-Hispanic white (29.7%), non-Hispanic Asian (28.7%), and Hispanic (27.3%) adults.
In women, the prevalence of hypertension was higher among non-Hispanic black (39.9%) adults than among non-Hispanic white (25.6%), non-Hispanic Asian (21.9%), and Hispanic (28.0%) adults. Hispanic women had a significantly higher prevalence of hypertension than non-Hispanic Asian women.
No significant differences were observed between men and women within race and Hispanic-origin groups.
Figure 2. Age-adjusted prevalence of hypertension among adults aged 18 and over, by sex and race and Hispanic origin: United States, 2015–2016
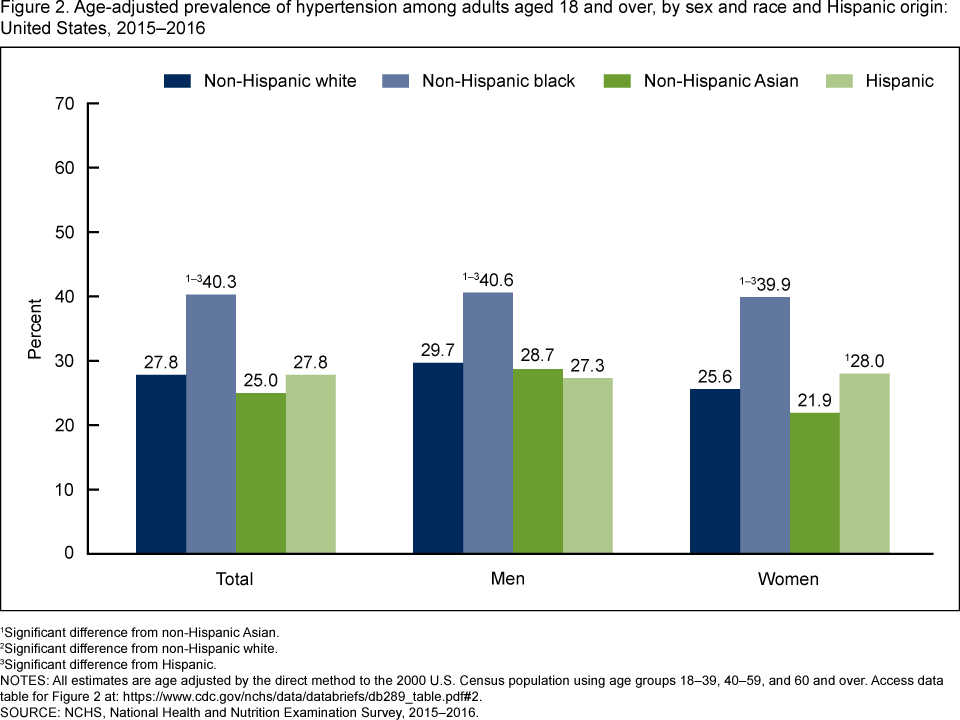
1Significant difference from non-Hispanic Asian.
2Significant difference from non-Hispanic white.
3Significant difference from Hispanic.
NOTES: All estimates are age adjusted by the direct method to the 2000 U.S. Census population using age groups 18–39, 40–59, and 60 and over. Access data table for Figure 2.
SOURCE: NCHS, National Health and Nutrition Examination Survey, 2015–2016.
What percentage of adults with hypertension had their blood pressure controlled?
Among adults with hypertension during 2015–2016, 48.3% had controlled hypertension. The prevalence of controlled hypertension overall increased with age and was lower among those aged 18–39 (32.5%) than among those aged 40–59 (50.8%) and 60 and over (49.4%) (Figure 3). This pattern was similar for men. Among women with hypertension, the observed decline in control with age was not significant.
A higher percentage of women had controlled hypertension than men, both overall (52.5% compared with 45.7%, respectively) and among those aged 18–39 (62.6% compared with 15.5%, respectively).
Figure 3. Prevalence of controlled hypertension among adults with hypertension aged 18 and over, by sex and age: United States, 2015–2016
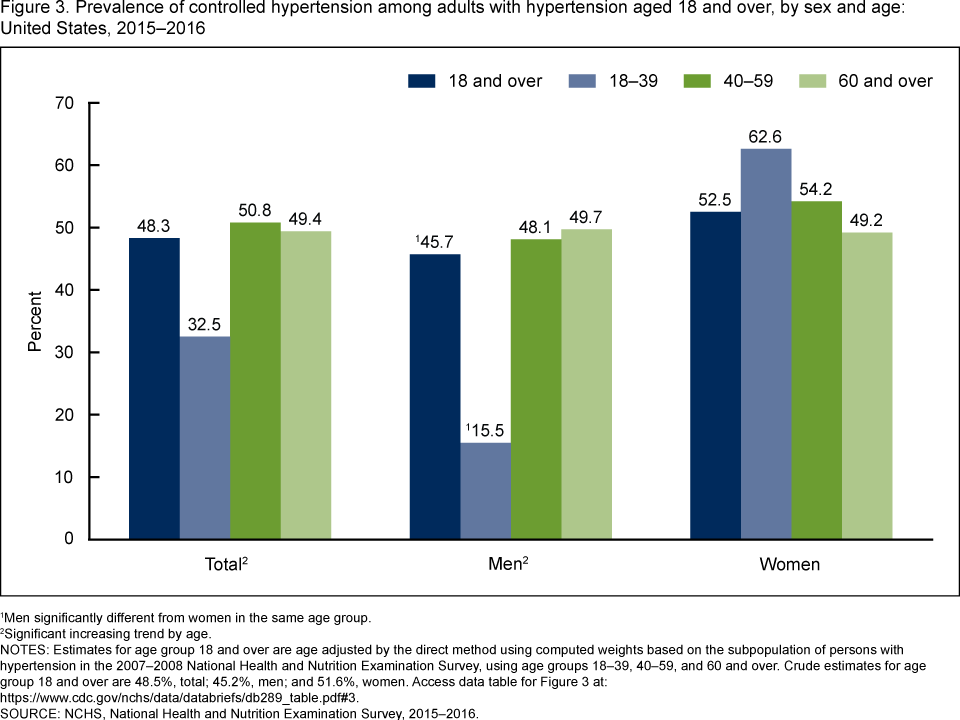
1Men significantly different from women in the same age group.
2Significant increasing trend by age.
NOTES: Estimates for age group 18 and over are age adjusted by the direct method using computed weights based on the subpopulation of persons with hypertension in the 2007–2008 National Health and Nutrition Examination Survey, using age groups 18–39, 40–59, and 60 and over. Crude estimates for age group 18 and over are 48.5%, total; 45.2%, men; and 51.6%, women. Access data table for Figure 3.
SOURCE: NCHS, National Health and Nutrition Examination Survey, 2015–2016.
Among adults with hypertension, were differences seen in blood pressure control by race and Hispanic origin during 2015–2016?
The prevalence of hypertension control among all adults with hypertension was higher among non-Hispanic white (50.8%) adults than among non-Hispanic black (44.6%) and non-Hispanic Asian (37.4%) adults (Figure 4).
The patterns of controlled hypertension among race and Hispanic-origin groups were similar among men and women. However, among men with hypertension, differences by race and Hispanic-origin group were not significant. Among women with hypertension, the prevalence of controlled hypertension was significantly higher among non-Hispanic white (57.1%) women than among non-Hispanic black (48.5%) and non-Hispanic Asian (39.7%) women.
The percentage of men with controlled hypertension was lower than for women among both non-Hispanic white (47.7% and 57.1%, respectively) and non-Hispanic black (40.1% and 48.5%, respectively) adults.
Figure 4. Age-adjusted prevalence of controlled hypertension among adults with hypertension aged 18 and over, by sex and race and Hispanic origin: United States, 2015–2016
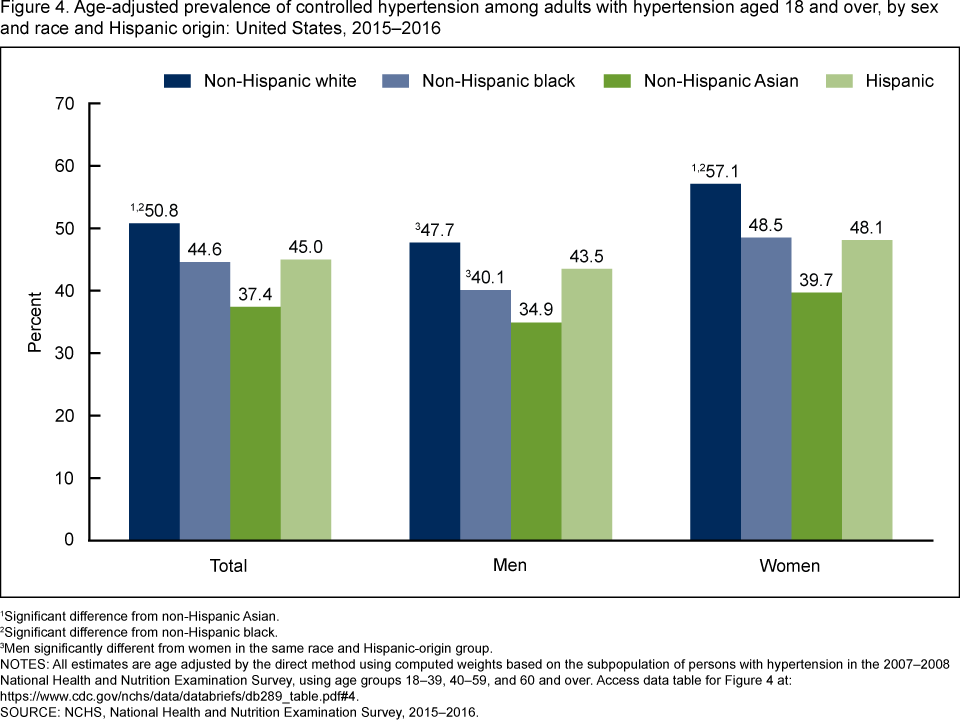
1Significant difference from non-Hispanic Asian.
2Significant difference from non-Hispanic black.
3Men significantly different from women in the same race and Hispanic-origin group.
NOTES: All estimates are age adjusted by the direct method using computed weights based on the subpopulation of persons with hypertension in the 2007–2008 National Health and Nutrition Examination Survey, using age groups 18–39, 40–59, and 60 and over. Access data table for Figure 4.
SOURCE: NCHS, National Health and Nutrition Examination Survey, 2015–2016.
Has overall prevalence and control of hypertension changed between 1999 and 2016?
From 1999 through 2016, no significant change was seen in the percentage of adults with hypertension. The prevalence of controlled hypertension among adults with hypertension in the United States increased from 31.6% in 1999–2000 to 53.1% in 2009–2010, but no significant changes were observed from 2009–2010 through 2015–2016. The observed decrease in hypertension control from 53.9% in 2013–2014 to 48.3% in 2015–2016 was not significant (Figure 5).
Figure 5. Age-adjusted trends in hypertension and controlled hypertension among adults aged 18 and over: United States, 1999–2016
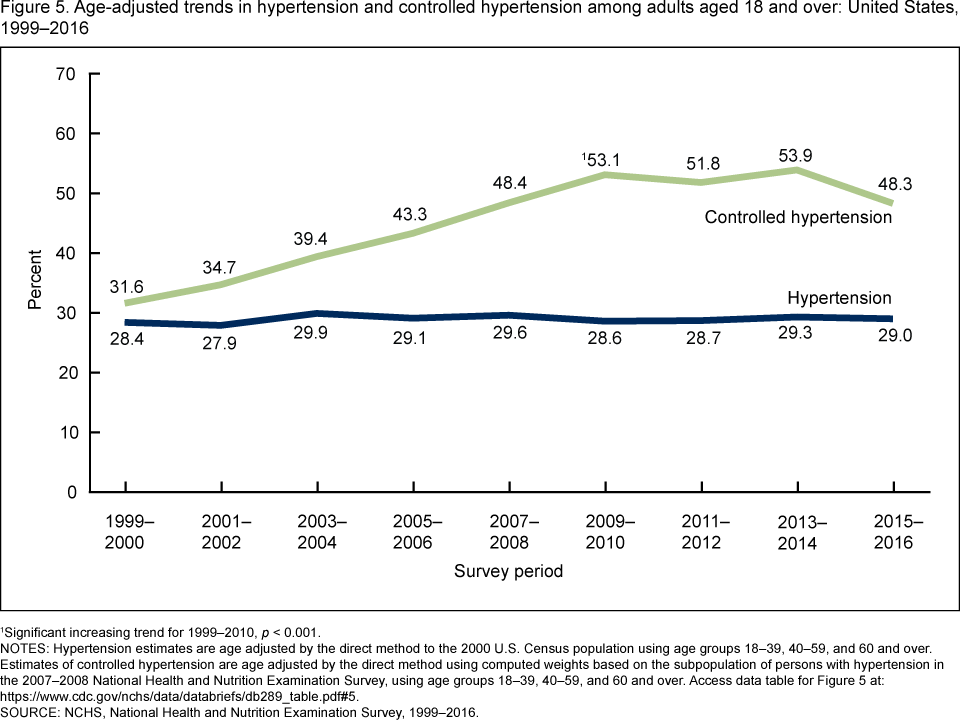
1Significant increasing trend for 1999–2010, p < 0.001.
NOTES: Hypertension estimates are age adjusted by the direct method to the 2000 U.S. Census population using age groups 18–39, 40–59, and 60 and over. Estimates of controlled hypertension are age adjusted by the direct method using computed weights based on the subpopulation of persons with hypertension in the 2007–2008 National Health and Nutrition Examination Survey, using age groups 18–39, 40–59, and 60 and over. Access data table for Figure 5.
SOURCE: NCHS, National Health and Nutrition Examination Survey, 1999–2016.
Summary
Overall, the U.S. prevalence of hypertension among adults was 29.0% during 2015–2016, with no significant change in prevalence since 1999–2000. However, among adults with hypertension, hypertension control increased from 1999–2000 to 2009–2010 and then did not significantly change through 2015–2016. No significant differences were seen between 2013–2014 and 2015–2016.
Hypertension prevalence increased with age and was 33.2% among those aged 40–59 and 63.1% among those aged 60 and over. About one-half of all adults aged 40 and over with hypertension had controlled hypertension. However, among those aged 18–39 with hypertension, 15.5% of men had controlled hypertension compared with 62.6% of women.
Hypertension prevalence was highest among non-Hispanic black men and women. Hispanic women also had a higher prevalence of hypertension than non-Hispanic Asian women. Controlled hypertension, however, was generally higher among non-Hispanic white adults than among non-Hispanic black and non-Hispanic Asian adults. Controlled hypertension was also higher for non-Hispanic white and non-Hispanic black women than for their male counterparts.
Despite progress in hypertension control that has been noted in the United States over the years, the goal of Healthy People 2020 (61.2% by 2020) has not been met (5). Currently, just less than one-half of adults with hypertension have their hypertension under control (48.3%).
Definitions
Hypertension: Systolic blood pressure greater than or equal to 140 mmHg or diastolic blood pressure greater than or equal to 90 mmHg, or currently taking medication to lower high blood pressure (6).
Controlled hypertension: Systolic blood pressure less than 140 mmHg and diastolic blood pressure less than 90 mmHg among those with hypertension (6). Estimates are age adjusted to the subpopulation of persons with hypertension in the 2007–2008 National Health and Nutrition Examination Survey (7).
Data source and methods
Data from the National Health and Nutrition Examination Surveys (NHANES) 1999–2016 were used for these analyses. Data from the most recent 2-year survey cycle, NHANES 2015–2016, were used to test differences between demographic subgroups. The precision and ability to detect differences in hypertension prevalence and control when a true difference does exist are lower with 2 years of data than when these estimates are based on 4 years of data, due to the smaller sample sizes. In testing for trends in hypertension prevalence and control, nine 2-year cycles (1999–2000 through 2015–2016) were used.
NHANES is a cross-sectional survey designed to monitor the health and nutritional status of the civilian noninstitutionalized U.S. population using highly stratified, multistage probability designs (8). The survey consists of interviews conducted in participants’ homes and standardized health examinations conducted in mobile examination centers (MECs). Blood pressure was measured in the MEC by trained physicians using standard protocol on a total sample of 5,504 nonpregnant persons aged 18 and over.
During 2015–2016, non-Hispanic black, non-Hispanic Asian, and Hispanic persons, among other groups, were oversampled to obtain reliable estimates for these population subgroups. Specific race and Hispanic-origin estimates reflect persons reporting only one race; those reporting more than one race are included in the total but not reported separately.
All blood pressure readings were obtained during a single examination visit. After a 5-minute rest in a seated position, participants had up to three brachial systolic and diastolic blood pressure measurements taken 30 seconds apart. An average of up to three systolic and diastolic blood pressure readings was used for systolic and diastolic blood pressure values (8). More than 99% of study participants had at least two complete blood pressure measurements. For participants with only one blood pressure reading (0.005%), a single measurement was used.
Examination sample weights, which account for the differential probabilities of selection, nonresponse, and noncoverage, were incorporated into the estimation process. All variance estimates accounted for the complex survey design by using Taylor series linearization.
Hypertension prevalence estimates for the total adult population were age adjusted to the 2000 projected U.S. Census population using the direct method and age groups 18–39, 40–59, and 60 and over (9). Age-adjusted estimates of controlled hypertension were calculated using the subpopulation of persons who have hypertension, as recommended by the National Surveillance Definitions for Hypertension (7), using age groups 18–39, 40–59, and 60 and over. Statistical analyses were conducted using SAS System for Windows Release 9.4 (SAS Institute Inc., Cary, N.C.) and SUDAAN Release 11.1 (RTI International, Research Triangle Park, N.C.). Differences between groups were tested using a univariate t statistic. Linear regression modeling was used to determine the significance of linear and quadratic trends and the significance of any change in trend. If a quadratic trend was found, Joinpoint software and piecewise regression were used to determine if changes in trend occurred over time (10). All differences reported are statistically significant at the p < 0.05 level unless otherwise indicated. Adjustments were not made for multiple comparisons.
About the authors
Cheryl D. Fryar, Yechiam Ostchega, Craig M. Hales, and Deanna Kruszon-Moran are with the National Center for Health Statistics (NCHS), Division of Health and Nutrition Examination Surveys. Guangyu Zhang is with the NCHS Division of Research and Methodology.
References
-
Ambrosius WT, Sink KM, Foy CG, Berlowitz DR, Cheung AK, Cushman WC, et al. The design and rationale of a multicenter clinical trial comparing two strategies for control of systolic blood pressure: The Systolic Blood Pressure Intervention Trial (SPRINT). Clin Trials
11(5):532–46. 2014. - Lawes CM, Bennett DA, Feigin VL, Rodgers A. Blood pressure and stroke: An overview of published reviews. Stroke 35(4):1024. 2004.
- Zanchetti A, Thomopoulos C, Parati G. Randomized controlled trials of blood pressure lowering in hypertension: A critical reappraisal. Circ Res 116(6):1058–73. 2015.
- Yoon SS, Fryar CD, Carroll MD. Hypertension prevalence and control among adults: United States, 2011–2014. NCHS data brief, no 220. Hyattsville, MD: National Center for Health Statistics. 2015.
- U.S. Department of Health and Human Services, Office of Disease Prevention and Health Promotion. Healthy People 2020.
- Chobanian AV, Bakris GL, Black HR, Cushman WC, Green LA, Izzo JL Jr, et al. Seventh report of the Joint National Committee on Prevention, Detection, Evaluation, and Treatment of High Blood Pressure. Hypertension 42(6):1206–52. 2003.
- Crim MT, Yoon SS, Ortiz E, Wall HK, Schober S, Gillespie C, et al. National surveillance definitions for hypertension prevalence and control among adults. Circ Cardiovasc Qual Outcomes 5(3):343–51. 2012.
-
National Center for Health Statistics. National Health and Nutrition Examination Survey (NHANES): Examination manuals 2013–2014,
2015–2016. - Klein RJ, Schoenborn CA. Age adjustment using the 2000 projected U.S. population. Healthy People Statistical Notes, no 20. Hyattsville, MD: National Center for Health Statistics. 2001.
- National Cancer Institute. Joinpoint trend analysis software (Version 4.4.0.0). 2017.
Suggested citation
Fryar CD, Ostchega Y, Hales CM, Zhang G, Kruszon-Moran D. Hypertension prevalence and control among adults: United States, 2015–2016. NCHS data brief, no 289. Hyattsville, MD: National Center for Health Statistics. 2017.
Copyright information
All material appearing in this report is in the public domain and may be reproduced or copied without permission; citation as to source, however, is appreciated.
National Center for Health Statistics
Charles J. Rothwell, M.S., M.B.A., Director
Jennifer H. Madans, Ph.D., Associate Director for Science
Division of Health and Nutrition Examination Surveys
Kathryn S. Porter, M.D., M.S., Director
Ryne Paulose-Ram, Ph.D., Associate Director for Science