Birth Expectations of U.S. Women Aged 15–44
- Key findings
- What percentage of women expect to have a child in the future?
- Do birth expectations for women vary by age and number of biological children they already have?
- What is the average number of children that women expect to have?
- When do women expect to have their first or next child, and does it vary by marital or cohabiting status?
- Does when women expect to have their next child vary by the number of biological children they already have?
- Summary
- Definitions
- Data source and methods
- About the authors
- References
- Suggested citation
NCHS Data Brief No. 260, October 2016
Jill Daugherty, Ph.D., and Gladys Martinez, Ph.D.
Key findings
Data from the National Survey of Family Growth
- Among U.S. women aged 15–44 in 2013–2015, 50% expected to have a child in the future.
- In 2013–2015, differences were seen by age in women’s expectations to have a child in the future, regardless of the number of biological children they have had.
- In 2013–2015, women on average expected to have 2.2 children in their lifetime. This estimate has decreased since 2002.
- A smaller percentage of never married, not cohabiting women expected to have a child within 2 years from the time of interview (5%) compared with currently married (19%) and currently cohabiting (16%) women.
- Eighty-two percent of women who already had two or more children did not expect to have more children in the future.
Birth expectations have been shown to be related to sexual activity, contraceptive use, and fertility (1–3). While most U.S. women believe that having two children is ideal (4), this varies by sociodemographic characteristics. Using data from the National Survey of Family Growth (NSFG), this report describes women’s birth expectations, number of children expected, and when they expected their next child to be born. Data are shown by age, marital or cohabiting status, and number of children. Selected trends are also shown using NSFG data from 2002, 2006–2010, 2011–2013, and 2013–2015.
Keywords: birth intention, children expected, timing of birth
What percentage of women expect to have a child in the future?
- In 2013–2015, approximately 50% of women expected to have a child in the future (Figure 1).
- The percentage of women who expected to have a child in the future increased between 2002 (46%) and 2013–2015 (50%).
- In each survey time period, 1%–2% of women reported that they did not know their birth expectations.
Figure 1. Percentage of women aged 15–44 who expect, do not expect, or do not know if they expect to have a child in the future: United States, 2002, 2006–2010, 2011–2013, and 2013–2015
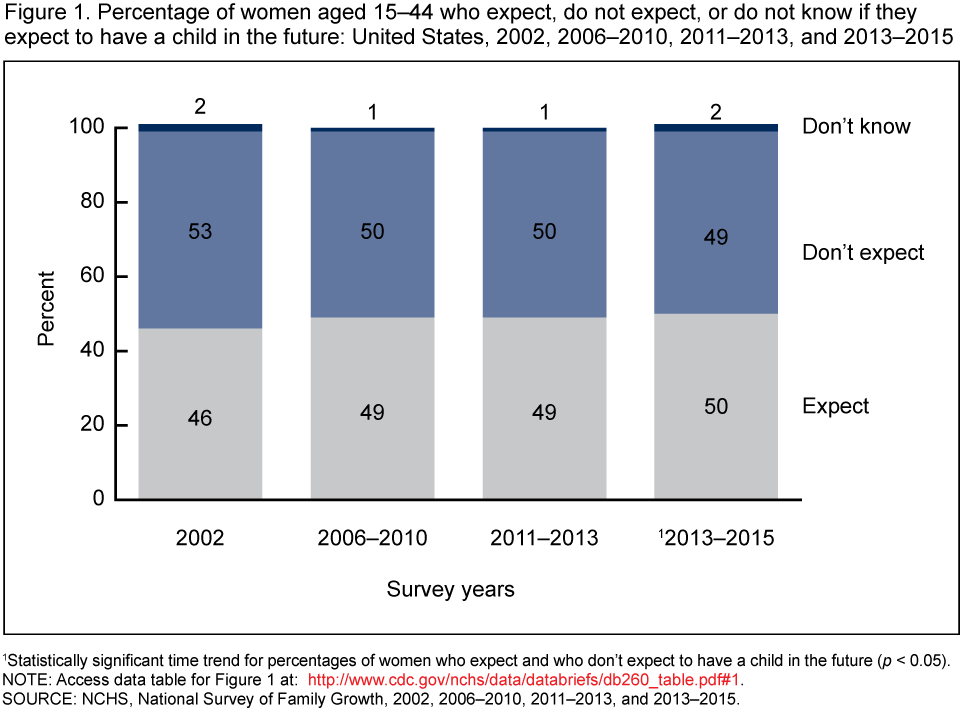
1Statistically significant time trend for percentages of women who expect and who don’t expect to have a child in the future (p < 0.05).
NOTE: Access data table for Figure 1.
SOURCE: NCHS, National Survey of Family Growth, 2002, 2006–2010, 2011–2013, and 2013–2015.
Do birth expectations for women vary by age and number of biological children they already have?
- As age increased, the percentage of women who expected to have a child decreased regardless of the number of biological children they already had (Figure 2).
- In 2013–2015, women aged 15–24 who did not yet have any biological children were more likely to expect to have a child in the future (86%) compared with women aged 25–34 (77%) and 35–44 (33%). A similar pattern was seen for women who had one child.
- A higher percentage of women aged 15–24 with at least two biological children (63%) expected to have a child compared with women aged 25–34 (25%) and 35–44 (6%).
- As the number of children increased, the percentage of women who expected to have a child decreased. This pattern held regardless of age group.
Figure 2. Percentage of women aged 15–44 who expect to have a child in the future, by current age and number of biological children: United States, 2013–2015
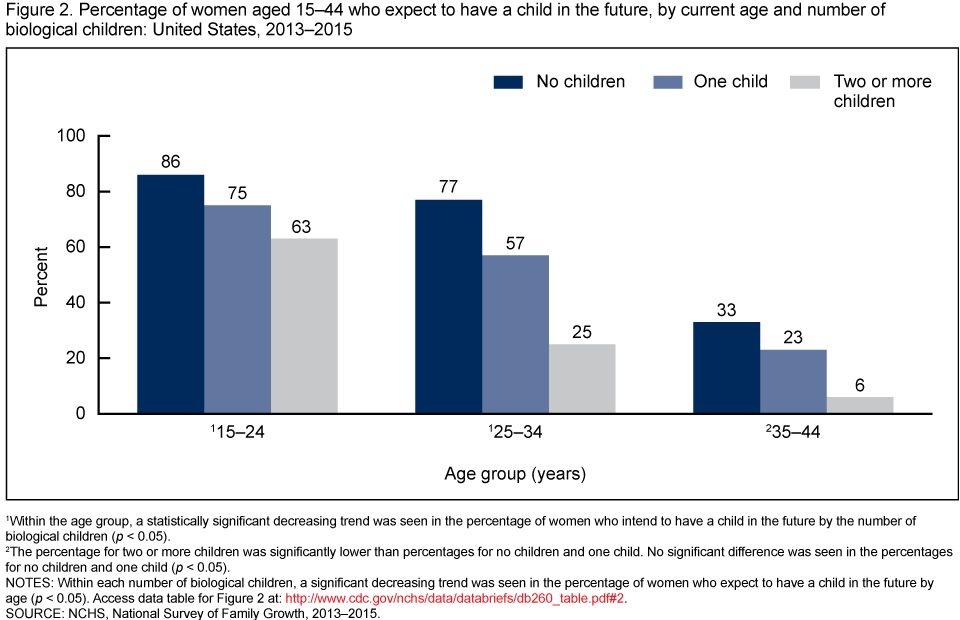
1Within the age group, a statistically significant decreasing trend was seen in the percentage of women who intend to have a child in the future by the number of biological children (p < 0.05).
2The percentage for two or more children was significantly lower than percentages for no children and one child. No significant difference was seen in the percentages for no children and one child (p < 0.05).
NOTES: Within each number of biological children, a significant decreasing trend was seen in the percentage of women who expect to have a child in the future by age (p < 0.05). Access data table for Figure 2.
SOURCE: NCHS, National Survey of Family Growth, 2013–2015.
What is the average number of children that women expect to have?
-
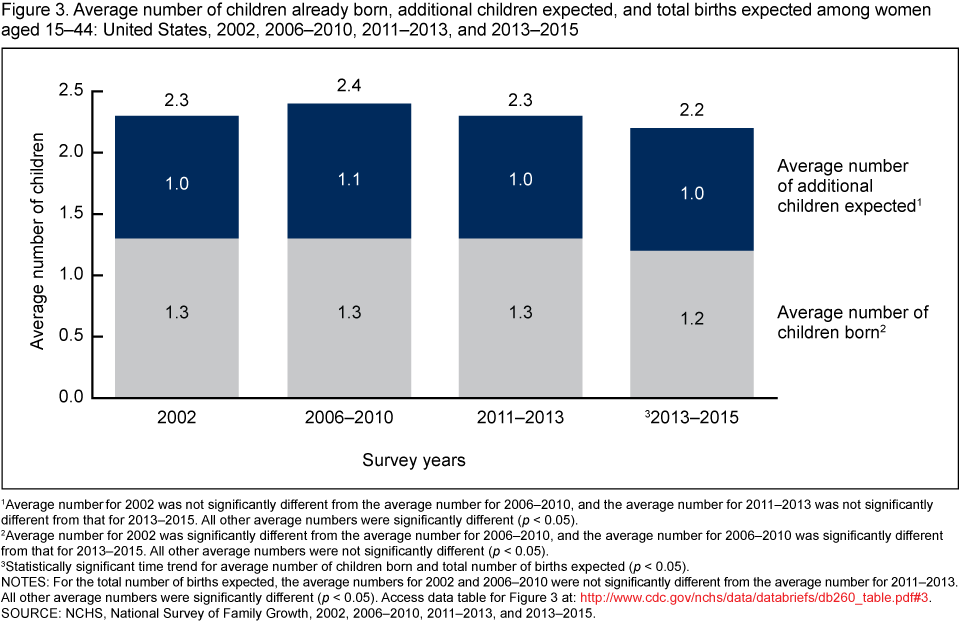
The average number of children already born and the average total number of births expected have both decreased since 2002 (Figure 3).
- The average number of additional children expected at the time of interview has not changed significantly since 2002.
- In 2013–2015, women aged 15–44 expected 2.2 children on average.
Figure 3. Average number of children already born, additional children expected, and total births expected among women aged 15–44: United States, 2002, 2006–2010, 2011–2013, and 2013–2015
1Average number for 2002 was not significantly different from the average number for 2006–2010, and the average number for 2011–2013 was not significantly different from that for 2013–2015. All other average numbers were significantly different (p < 0.05).
2Average number for 2002 was significantly different from the average number for 2006–2010, and the average number for 2006–2010 was significantly different from that for 2013–2015. All other average numbers were not significantly different (p < 0.05).
3Statistically significant time trend for average number of children born and total number of births expected (p < 0.05).
NOTES: For the total number of births expected, the average numbers for 2002 and 2006–2010 were not significantly different from the average number for 2011–2013. All other average numbers were significantly different (p < 0.05). Access data table for Figure 3.
SOURCE: NCHS, National Survey of Family Growth, 2002, 2006–2010, 2011–2013, and 2013–2015.
When do women expect to have their first or next child, and does it vary by marital or cohabiting status?
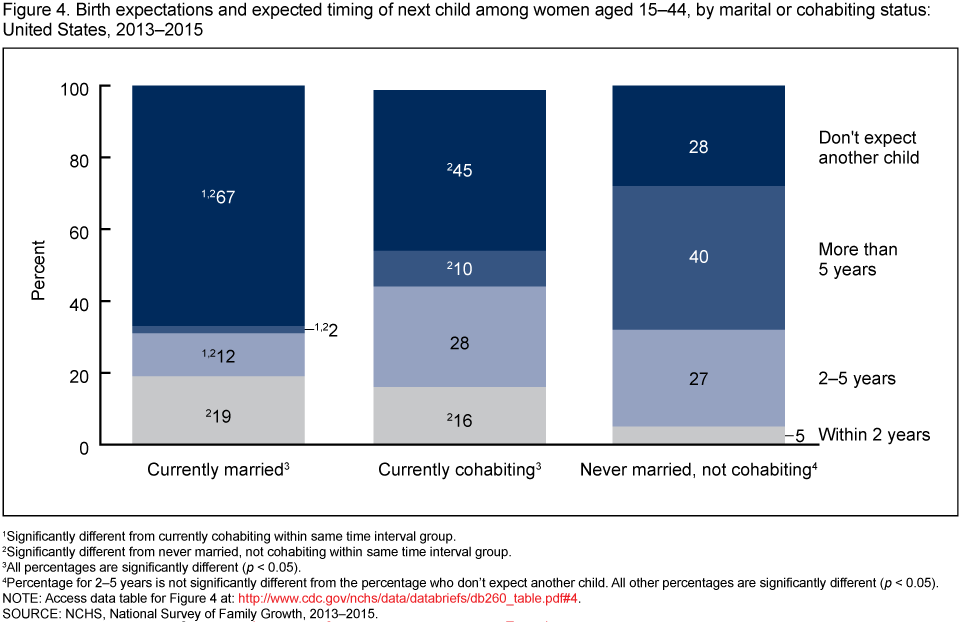
- A greater percentage of cohabiting women (28%) and never married, not cohabiting women (27%) expected to have a child in 2–5 years than married women (12%) (Figure 4).
- A greater percentage of never married, not cohabiting women expected to have a child more than 5 years from the time of interview (40%) than cohabiting women (10%) and married women (2%).
- About two-thirds of married women (67%), 45% of currently cohabiting women, and 28% of never married, not cohabiting women did not expect to have a child in the future.
Figure 4. Birth expectations and expected timing of next child among women aged 15–44, by marital or cohabiting status: United States, 2013–2015
1Significantly different from currently cohabiting within same time interval group.
2Significantly different from never married, not cohabiting within same time interval group.
3All percentages are significantly different (p < 0.05).
4Percentage for 2–5 years is not significantly different from the percentage who don’t expect another child. All other percentages are significantly different (p < 0.05).
NOTE: Access data table for Figure 4.
SOURCE: NCHS, National Survey of Family Growth, 2013–2015.
Does when women expect to have their next child vary by the number of biological children they already have?
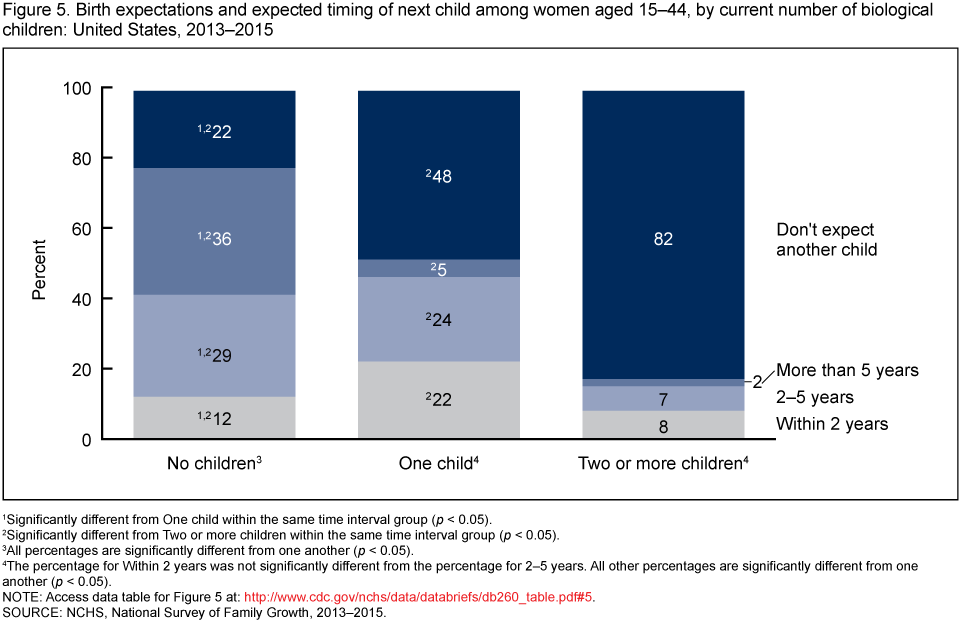
- The percentage of women who did not expect to have a child in the future increased with the number of biological children they already had (Figure 5).
- In 2013–2015, among women with no children, 22% did not expect to have a child, 12% expected to have a child within 2 years, 29% in 2–5 years, and 36% in more than 5 years from the time of interview.
- Among women with one child, nearly one-half (48%) did not expect to have another child, 22% expected to have a child within 2 years, 24% in 2–5 years, and 5% in more than 5 years.
- Eighty-two percent of women who had two or more children did not expect to have more children.
Figure 5. Birth expectations and expected timing of next child among women aged 15–44, by current number of biological children: United States, 2013–2015
1Significantly different from One child within the same time interval group (p < 0.05).
2Significantly different from Two or more children within the same time interval group (p < 0.05).
3All percentages are significantly different from one another (p < 0.05).
4The percentage for Within 2 years was not significantly different from the percentage for 2–5 years. All other percentages are significantly different from one another (p < 0.05).
NOTE: Access data table for Figure 5.
SOURCE: NCHS, National Survey of Family Growth, 2013–2015.
Summary
NSFG has been measuring birth expectations since 1973, because this indicator provides an estimate of future family sizes and insight into future birth rates (5–8). In 2013–2015, 50% of women aged 15–44 expected to have a child in the future. This percentage has increased significantly since 2002. Women who have not yet had any children, younger women, and women who have never been married were more likely to expect to have a child in the future compared with other groups. Over time, the number of children that women expected to have has decreased slightly. In 2013–2015, women on average expected to have 2.2 children in their lifetime. The data also show that the timing of women’s expectations for a child varied by marital or cohabiting status and the number of children they already have.
Definitions
Age: The respondent’s age at the time of interview. The recode variable used was AGER.
Birth expectations: The expectations that respondents have regarding future childbearing. The recode variable used to measure a respondent’s expectations for (additional) future births was INTENT. For currently pregnant women, INTENT refers to intentions after any current pregnancy. The recode variable used to measure the average number of (additional) births expected for each respondent was ADDEXP. For currently pregnant women, an additional birth was added to the original ADDEXP number. These expectations for future births, as reported at the time of interview, are distinct from reports of the intendedness at time of conception for each pregnancy.
Expectation of timing of future births: The raw variable used to measure how long each respondent plans to wait to have her first or next child was INTNEXT (for unmarried women) and JINTNEXT (for those cohabiting or currently married). For respondents who already have children, the items are phrased as “another child (in the future).” For respondents who have not yet had any children, the items are phrased as “a child (in the future).”
Marital or cohabiting status: The respondent’s informal marital status at the time of interview, as summarized in the RMARITAL recode. Categories include currently married; not married but living with an opposite sex partner (cohabiting); widowed, divorced, or separated for reasons of marital discord (and not currently cohabiting); and never been married, not currently cohabiting.
Numbers of biological children already had: The total number of live births women had by the time of interview (PARITY recode).
Data source and methods
NSFG is a nationally representative survey of the U.S. household population, with in-person interviews conducted with men and women aged 15–44. Recent estimates in this report are based on data from the 5,699 women in the 2013–2015 NSFG. The fieldwork plan, interview content, and other survey procedures are similar to what was done in previous surveys (9–11). NSFG is jointly planned and funded by the National Center for Health Statistics and several other programs of the U.S. Department of Health and Human Services. All estimates in this report are weighted to reflect the U.S. household population aged 15–44 across the midpoint of 2013–2015 interviewing (July 2014). More information on NSFG is available from the NSFG website.
Statistics for this report, including sampling errors, were produced using the SURVEY analysis procedures in SAS software version 9.3. Percentages were compared using two-tailed t tests at the 5% level. The difference between any two estimates is mentioned in the text only if it is statistically significant. In addition, a weighted least squares regression was used to test trends over time that involved more than two time points. The data presented in this report are bivariate associations that may be explained by other factors not controlled for in the analysis.
About the authors
Jill Daugherty and Gladys Martinez are with the National Center for Health Statistics, Division of Vital Statistics, Reproductive Statistics Branch.
References
- Chuang CH, Weisman CS, Hillemeier MM, Camacho FT, Dyer A-M. Associating pregnancy intent with pregnancy: Prospective findings from the Central Pennsylvania Women’s Health Study (CePAWHS). Womens Health Issues 19(3):159–66. 2009.
- Moreau C, Hall K, Trussell J, Barber J. Effect of prospectively measured pregnancy intentions on the consistency of contraceptive use among young women in Michigan. Hum Reprod 28(3):642–50. 2013.
- Hayford SR. The evolution of fertility expectations over the life course. Demography 46(4):765–83. 2009.
- Gao G. Americans’ ideal family size is smaller than it used to be. Washington, DC: Pew Research Center. 2015.
- Peterson LS. Birth expectations of women in the United States, 1973–88. National Center for Health Statistics. Vital Health Stat 23(17). 1995.
- Martinez GM, Chandra A, Abma JC, et al. Fertility, contraception, and fatherhood: Data on men and women from Cycle 6 (2002) of the National Survey of Family Growth. National Center for Health Statistics. Vital Health Stat 23(26). 2006.
- Chandra A, Martinez GM, Mosher WD, et al. Fertility, family planning, and reproductive health of U.S. women: Data from the 2002 National Survey of Family Growth. National Center for Health Statistics. Vital Health Stat 23(25). 2005.
- Martinez G, Daniels K, Chandra A. Fertility of men and women aged 15–44 years in the United States: National Survey of Family Growth, 2006–2010. National health statistics reports; no 51. Hyattsville, MD: National Center for Health Statistics. 2012.
- Groves RM, Mosher WD, Lepkowski JM, Kirgis NG. Planning and development of the continuous National Survey of Family Growth. National Center for Health Statistics. Vital Health Stat 1(48). 2009.
- Lepkowski JM, Mosher WD, Davis KE, et al. The 2006–2010 National Survey of Family Growth: Sample design and analysis of a continuous survey. National Center for Health Statistics. Vital Health Stat 2(150). 2010.
- Lepkowski JM, Mosher WD, Groves RM, et al. Responsive design, weighting, and variance estimation in the 2006–2010 National Survey of Family Growth. National Center for Health Statistics. Vital Health Stat 2(158). 2013.
Suggested citation
Daugherty J, Martinez G. Birth expectations of U.S. women aged 15–44. NCHS data brief, no 260. Hyattsville, MD: National Center for Health Statistics. 2016.
Copyright information
All material appearing in this report is in the public domain and may be reproduced or copied without permission; citation as to source, however, is appreciated.
National Center for Health Statistics
Charles J. Rothwell, M.S., M.B.A., Director
Jennifer H. Madans, Ph.D., Associate Director for Science
Division of Vital Statistics
Delton Atkinson, M.P.H., M.P.H., P.M.P., Director
Hanyu Ni, Ph.D., M.P.H., Associate Director for Science