Differences in Adult Day Services Center Participant Characteristics by Center Ownership: United States, 2012
- Key findings
- The majority of adult day services center participants were aged 65 and over.
- A higher percentage of participants in for-profit than in nonprofit adult day services centers were enrolled in Medicaid.
- A higher percentage of participants in nonprofit adult day services centers were diagnosed with Alzheimer’s disease or other dementias or with developmental disabilities, whereas a higher percentage of participants in for-profit centers were diagnosed with depression or severe mental illness.
- Participants in adult day services centers differed by center ownership in their need for assistance with some activities.
- Less than 10% of participants in adult day services centers had an emergency department visit or were discharged from an overnight hospital stay in the last 90 days, while almost 20% of participants discharged from an overnight hospital stay were readmitted within 30 days of discharge.
- Summary
- Definitions
- Data source and methods
- About the authors
- References
- Suggested citation
NCHS Data Brief No. 164, September 2014
PDF Version (585 KB)
Lisa L. Dwyer, M.P.H.; Lauren D. Harris-Kojetin, Ph.D.; and Roberto H. Valverde, M.P.H.
Key findings
Data from the National Study of Long-Term Care Providers
- In 2012, more than one-third of participants in adult day services centers were younger than 65. A higher percentage of participants in nonprofit centers than in for-profit centers were younger than 65.
- About one-half of participants in adult day services centers were non-Hispanic white persons. A higher percentage of participants in for-profit centers than in nonprofit centers were Hispanic or were non-Hispanic and of a race other than black or white.
- Almost one-third of adult day services center participants had Alzheimer’s disease or other dementias, and about one-quarter had a developmental disability. A lower percentage of participants in for-profit than in nonprofit centers had Alzheimer’s disease or other dementias or a developmental disability.
The 4,800 adult day services centers nationwide provide a variety of services to their 273,200 participants, the majority of whom are older adults and women (1). The number of for-profit adult day services centers has grown in recent years (2). The 1,900 for-profit centers, representing 40% of centers nationally, served nearly one-half (47%) of center participants in 2012 (3). Using data from the National Study of Long-Term Care Providers, this report presents selected characteristics of adult day services center participants in 2012 and compares the characteristics of participants in for-profit centers with those in nonprofit centers. State-level estimates for characteristics presented in this data brief are available from: https://www.cdc.gov/nchs/nsltcp/nsltcp_products.htm.
Keywords: National Study of Long-Term Care Providers, medical conditions, activities of daily living
The majority of adult day services center participants were aged 65 and over.
Figure 1. Age and race and ethnicity distribution among adult day services center participants, by center ownership: United States, 2012
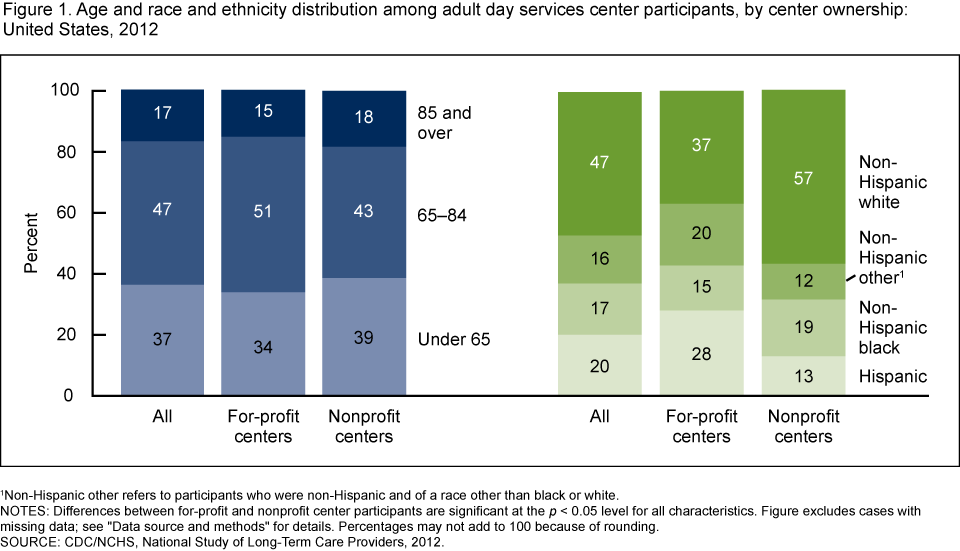
1 Non-Hispanic other refers to participants who were non-Hispanic and of a race other than black or white.
NOTES: Differences between for-profit and nonprofit center participants are significant at the p < 0.05 level for all characteristics. Figure excludes cases with missing data; see “Data source and methods” for details. Percentages may not add to 100 because of rounding.
SOURCE: CDC/NCHS, National Study of Long-Term Care Providers, 2012.
- A higher percentage of participants in for-profit than in nonprofit adult day services centers were aged 65 and over, with the greatest difference seen among those aged 65–84: 51% of participants in for-profit centers were aged 65–84 compared with 43% in nonprofit centers (Figure 1).
- A higher percentage of participants in nonprofit (57%) than in for-profit (37%) adult day services centers were non-Hispanic white persons. A higher percentage of participants in for-profit centers than in nonprofit centers were Hispanic (28% compared with 13%) or non-Hispanic and of a race other than black or white (20% compared with 12%).
A higher percentage of participants in for-profit than in nonprofit adult day services centers were enrolled in Medicaid.
- Fifty-five percent of participants in adult day services centers had some or all of their long-term care services paid by Medicaid (Figure 2).
- A higher percentage of participants in for-profit (71%) than in nonprofit centers (42%) were enrolled in Medicaid.
Figure 2. Medicaid enrollment among adult day services center participants, by center ownership: United States, 2012
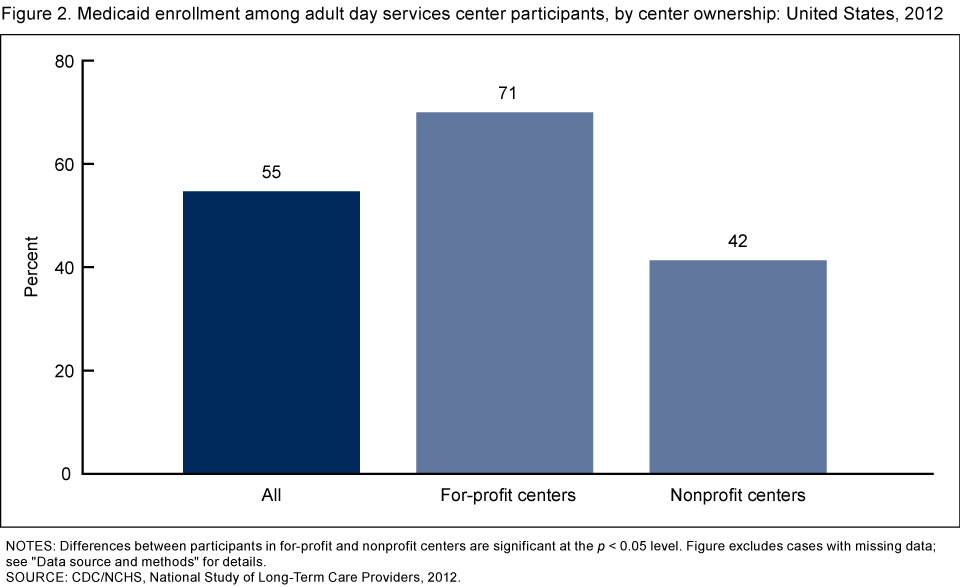
NOTES: Differences between participants in for-profit and nonprofit centers are significant at the p < 0.05 level. Figure excludes cases with missing data; see “Data source and methods” for details.
SOURCE: CDC/NCHS, National Study of Long-Term Care Providers, 2012.
A higher percentage of participants in nonprofit adult day services centers were diagnosed with Alzheimer’s disease or other dementias or with developmental disabilities, whereas a higher percentage of participants in for-profit centers were diagnosed with depression or severe mental illness.
- Thirty-seven percent of participants in nonprofit adult day services centers had a diagnosis of Alzheimer’s disease or other dementias, compared with 27% in for-profit centers (Figure 3).
- Thirty-one percent of participants in nonprofit adult day services centers had a diagnosis of developmental disability, compared with 19% in for-profit centers.
- Nineteen percent of participants in nonprofit adult day services centers had a diagnosis of depression, compared with 29% in for-profit centers.
- Nine percent of participants in nonprofit adult day services centers had a diagnosis of severe mental illness, compared with 12% in for-profit centers.
Figure 3. Selected diagnosed medical conditions among adult day services center participants, by center ownership: United States, 2012
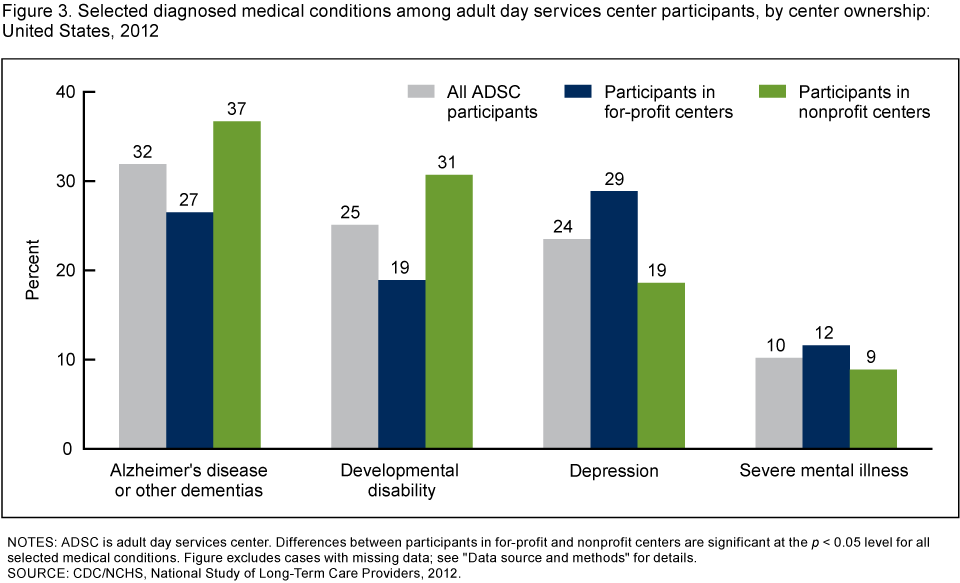
NOTES: ADSC is adult day services center. Differences between participants in for-profit and nonprofit centers are significant at the p < 0.05 level for all selected medical conditions. Figure excludes cases with missing data; see “Data source and methods” for details.
SOURCE: CDC/NCHS, National Study of Long-Term Care Providers, 2012.
Participants in adult day services centers differed by center ownership in their need for assistance with some activities.
- A higher percentage of participants in nonprofit adult day services centers needed assistance with toileting (40%) compared with those in for-profit centers (32%)(Figure 4).
- A higher percentage of participants in nonprofit adult day services centers needed assistance with eating (29%) compared with those in for-profit centers (22%).
- A higher percentage of participants in for-profit centers received medication assistance (38%) compared with those in nonprofit centers (30%).
- Similar percentages of participants in nonprofit and for-profit adult day services centers needed assistance with locomotion or walking (46% and 47%, respectively) and needed assistance with transferring in or out of a chair (29% and 28%, respectively).
Figure 4. Need for assistance with selected activities of daily living and receipt of medication assistance among adult day services center participants, by center ownership: United States, 2012
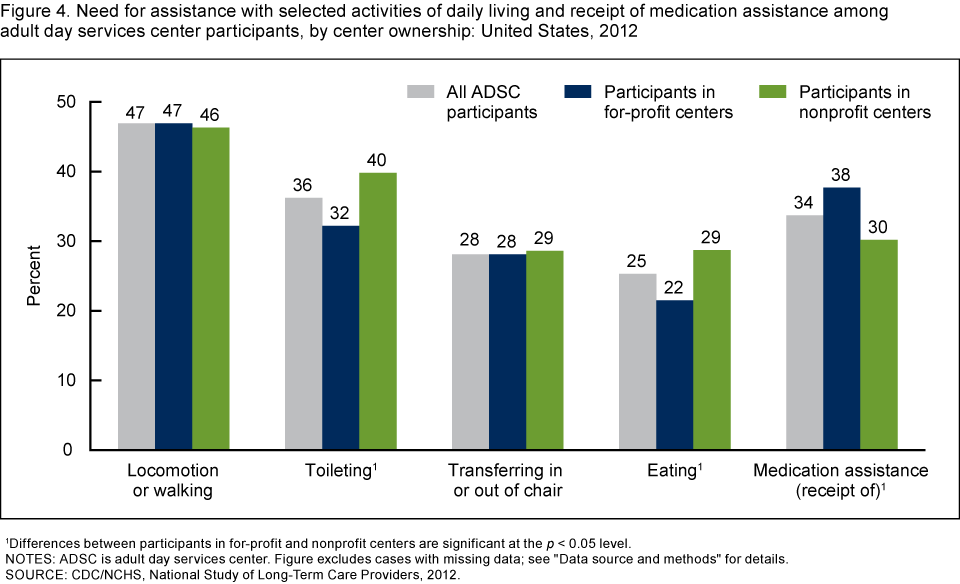
1Differences between participants in for-profit and nonprofit centers are significant at the p < 0.05 level.
NOTES: ADSC is adult day services center. Figure excludes cases with missing data; see “Data source and methods” for details.
SOURCE: CDC/NCHS, National Study of Long-Term Care Providers, 2012.
Less than 10% of participants in adult day services centers had an emergency department visit or were discharged from an overnight hospital stay in the last 90 days, while almost 20% of participants discharged from an overnight hospital stay were readmitted within 30 days of discharge.
- Similar percentages of participants in nonprofit and for-profit adult day services centers (7% and 6%, respectively) had an emergency department visit in the last 90 days (Figure 5).
- Equal percentages of participants in nonprofit and for-profit adult day services centers (6%) had been discharged from an overnight hospital stay in the last 90 days.
- Nearly one in five participants in both nonprofit (17%) and for-profit (18%) adult day services centers who was discharged from an overnight hospital stay in the last 90 days was readmitted to the hospital within 30 days of discharge.
Figure 5. Emergency department visits, overnight hospital stays, and readmissions among adult day services center participants, by center ownership: United States, 2012
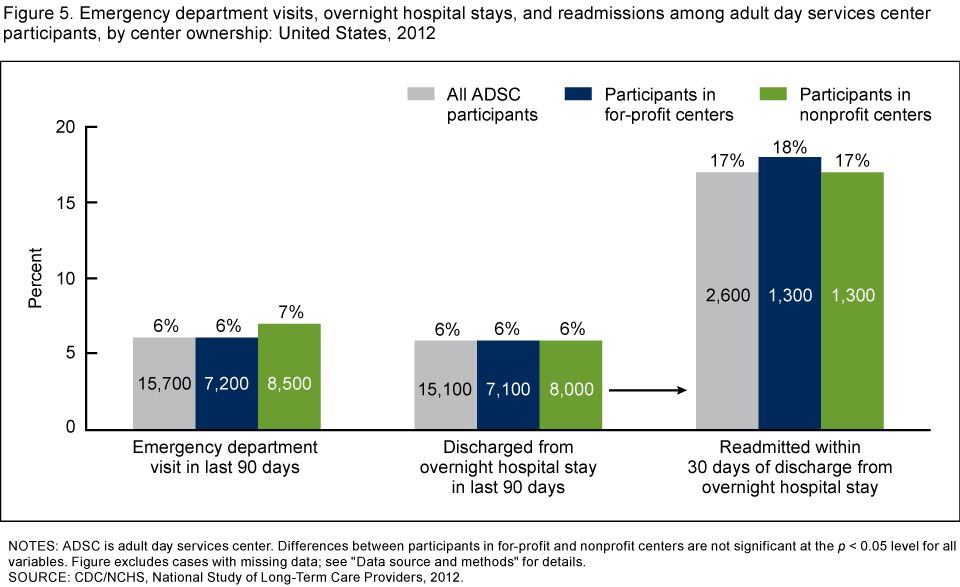
NOTES: ADSC is adult day services center. Differences between participants in for-profit and nonprofit centers are not significant at the p < 0.05 level for all variables. Figure excludes cases with missing data; see “Data source and methods” for details.
SOURCE: CDC/NCHS, National Study of Long-Term Care Providers, 2012.
Summary
On any given day in 2012, more than a quarter million participants (273,200) were enrolled in an estimated 4,800 adult day services centers operating in the United States (1); participants were about evenly distributed between for-profit (47%) and nonprofit (53%) centers (3).
Adult day services center participants are more diverse than users of other major long-term care services with respect to race, ethnicity, and age (1). Twenty percent of adult day services center participants in 2012 were Hispanic, and 17% were non-Hispanic black. There were more than twice as many Hispanic participants in for-profit centers as in nonprofit centers. More than one-third (37%) of adult day services center participants in 2012 were under age 65, supporting previous research on the increasing role of these centers in serving younger persons with intellectual and developmental disabilities and the growing numbers of veterans with traumatic brain injuries (2,4).
A sizeable percentage of all adult day services center participants in 2012 had a diagnosis of Alzheimer’s disease or other dementias (32%), suggesting that these conditions may be a common precipitating factor for using formal long-term care services (5), including adult day services. Nonprofit adult day services centers served a higher percentage of participants with dementia (37%) compared with for-profit centers (27%).
Reducing potentially avoidable emergency department visits and inpatient hospital admissions is a policy priority (6). Older adults comprise a large and growing percentage of emergency department patients (7,8). In 2012, adult day services center participants had nearly 63,000 emergency department visits. Also, almost one-fifth of the 15,100 participants with an overnight hospital stay in the 90 days before the survey had a readmission within 30 days of their discharge, potentially representing more than 10,000 participants in a year.
These findings provide a current national picture of participants enrolled in U.S. adult day services centers. Findings on differences by center ownership provide useful information to policy makers, providers, researchers, and consumer advocates as they plan to meet the needs of seniors and persons with disabilities. Corresponding state estimates and their standard errors for the national figures in this data brief are available from: https://www.cdc.gov/nchs/nsltcp/nsltcp_products.htm. These national and state estimates establish a baseline for monitoring trends among adult day services center participants.
Definitions
Adult day services center: A community-based center that provides an array of long-term care services, including structured activities, health monitoring, socialization, and assistance with activities of daily living, to seniors or younger adults with disabilities. These centers are generally open 5 days a week for a minimum of 6 hours a day.
Assistance with selected activities of daily living: Needing any help or supervision from another person, or use of special equipment for locomotion or walking, toileting, transferring in or out of a chair, or eating.
Hospital emergency department visit: Refers to when adult day services center participants are treated in a hospital emergency department in the 90 days prior to the survey.
Medication assistance: Refers to managing, supervising, or storing medications; administering medications; or providing assistance with self-administration of medications.
Overnight hospital stay: Includes discharges from an overnight hospital stay in the 90 days prior to the survey. Trips to the hospital emergency department that did not result in a discharge from an overnight hospital stay are excluded.
Ownership type: Categorization of adult day services centers into two ownership types: for profit and nonprofit. For profit includes publicly traded centers and limited liability centers. Nonprofit includes private nonprofit centers and federal, state, county, or local government-owned centers.
Non-Hispanic and of a race other than black or white: Race and ethnicity category that includes non-Hispanic American Indian or Alaska Native, non-Hispanic Asian, non-Hispanic Native Hawaiian or other Pacific Islander, non-Hispanic of two or more races, other race and ethnicity category not reported in the center’s system, and unknown race.
Participants with some or all long-term care services paid by Medicaid: Refers to adult day services center participants who had some or all of their long-term care services paid by Medicaid during the 30 days prior to the survey.
Readmission after an overnight hospital stay: Refers to readmission to a hospital for an overnight stay within 30 days of a hospital discharge. Based on a question asked when a respondent reported having at least one participant with a discharge from an overnight hospital stay in the 90 days prior to the survey.
Data source and methods
Data from the adult day services component of the 2012 National Study of Long-Term Care Providers (NSLTCP) conducted by the Centers for Disease Control and Prevention’s (CDC) National Center for Health Statistics (NCHS) were used for these analyses. All adult day services centers that participated in NSLTCP (a) self-identified as adult day care, adult day services, or adult day health services centers; (b) were included in the National Adult Day Services Association’s database; and (c) were in operation on or before May 31, 2012.
NSLTCP used a multimode survey protocol with mail, Web, and telephone follow-up for nonresponse. The final frame consisted of 5,254 adult day services centers, which were all included in the data collection efforts. A total of 476 (9.1%) adult day services centers were identified as invalid or out of business. All remaining centers (n = 4,778) were assumed eligible. The survey questionnaire was completed for 3,212 centers, for a weighted response rate of 67.2%.
Although 273,200 participants were served by the 4,800 adult day services centers nationwide, the analyses in this data brief are based on the 272,300 participants in adult day services centers for which ownership status was known. Aggregate data on participant demographics were collected from each participating adult day services center.
Differences among subgroups were evaluated using chi-square tests. All significance tests were two-sided, using p less than 0.05 as the level of significance. Lack of comment regarding the difference between any two statistics does not necessarily suggest that the difference was tested and found to be not statistically significant. Data analyses were performed using SAS-callable SUDAAN. Cases with missing data were excluded from the analyses on a variable-by-variable basis. Because estimates were rounded, individual estimates may not sum to totals.
About the authors
Lisa L. Dwyer, Lauren D. Harris-Kojetin, and Roberto H. Valverde are with CDC’s National Center for Health Statistics, Division of Health Care Statistics.
References
- Harris-Kojetin L, Sengupta M, Park-Lee E, Valverde R. Long-term care services in the United States: 2013 overview. Hyattsville, MD: National Center for Health Statistics. 2013.
- Anderson KA, Dabelko-Schoeny H, Johnson TD. The state of adult day services: Findings and implications from the MetLife National Study of Adult Day Services. J Appl Gerontol 32(6):729–48. 2013.
- Dwyer LL, Harris-Kojetin LD, Valverde RH. Differences in adult day services center characteristics by center ownership: United States, 2012. NCHS data brief, no 165. Hyattsville, MD: National Center for Health Statistics. 2014.
- Department of Defense. DoD worldwide numbers for traumatic brain injury. Washington, DC.
- Thies W, Bleiler L; Alzheimer’s Association. 2013 Alzheimer’s disease facts and figures [PDF – 131MB]. Alzheimers Dement 9(2):208-45. 2013
- Ouslander JG, Maslow K. Geriatrics and the triple aim: Defining preventable hospitalizations in the long-term care population. J Am Geriatr Soc 60(12):2313–8. 2012.
- Terrell KM, Hustey FM, Hwang U, Gerson LW, Wenger NS, Miller DK; Society for Academic Emergency Medicine (SAEM) Geriatric Task Force. Quality indicators for geriatric emergency care. Acad Emerg Med 16(5):441−9. 2009.
- Pitts SR, Niska RW, Xu J, Burt CW. National Hospital Ambulatory Medical Care Survey: 2006 emergency department summary. National health statistics reports; no 7. Hyattsville, MD: National Center for Health Statistics. 2008.
Suggested citation
Dwyer LL, Harris-Kojetin LD, Valverde RH. Differences in adult day services center participant characteristics by center ownership: United States, 2012. NCHS data brief, no 164. Hyattsville, MD: National Center for Health Statistics. 2014.
Copyright information
All material appearing in this report is in the public domain and may be reproduced or copied without permission; citation as to source, however, is appreciated.
National Center for Health Statistics
Charles J. Rothwell, M.S., M.B.A., Director
Jennifer H. Madans, Ph.D., Associate Director for Science
Division of Vital Statistics
Clarice Brown, M.S., Director