Pressure Ulcers Among Nursing Home Residents: United States, 2004
- Key findings
- More than 1 in 10 nursing home residents had a pressure ulcer.
- Pressure ulcer prevalence varied by age, sex, and length of time since admission to the nursing home, but not by race.
- Pressure ulcer prevalence varied by different resident clinical characteristics.
- Thirty-five percent of nursing home residents with stage 2 or higher pressure ulcers received special wound care.
- Summary
- Definitions
- Data source and methods
- About the authors
- References
- Suggested Citation
NCHS Data Brief No. 14, February 2009
PDF Version (606 KB)
by Eunice Park-Lee, Ph.D., and Christine Caffrey, Ph.D., Division of Health Care Statistics
Key findings
Data from the National Nursing Home Survey, 2004
- In 2004, about 159,000 current U.S. nursing home residents (11%) had pressure ulcers. Stage 2 pressure ulcers were the most common.
- Residents aged 64 years and under were more likely than older residents to have pressure ulcers.
- Residents of nursing homes for a year or less were more likely to have pressure ulcers than those with longer stays.
- One in five nursing home residents with a recent weight loss had pressure ulcers.
- Thirty-five percent of nursing home residents with stage 2 or higher (more severe) pressure ulcers received special wound care services in 2004.
Pressure ulcers, also known as bed sores, pressure sores, or decubitus ulcers, are wounds caused by unrelieved pressure on the skin (1). They usually develop over bony prominences, such as the elbow, heel, hip, shoulder, back, and back of the head (1-3). Pressure ulcers are serious medical conditions and one of the important measures of the quality of clinical care in nursing homes (1,4). From about 2% to 28% of nursing home residents have pressure ulcers (2,3). The most common system for staging pressure ulcers classifies them based on the depth of soft tissue damage, ranging from the least severe (stage 1) to the most severe (stage 4). There is persistent redness of skin in (stage 1); a loss of partial thickness of skin appearing as an abrasion, blister, or shallow crater in (stage 2); a loss of full thickness of skin, presented as a deep crater in (stage 3); and a loss of full thickness of skin exposing muscle or bone in (stage 4). Clinical practice guidelines for pressure ulcers have been developed and provide specific treatment recommendations for (stage 2) or higher pressure ulcers, including proper wound care (5). This Data Brief presents the most recent national estimates of pressure ulcer prevalence, resident characteristics associated with pressure ulcers, and the use of wound care services in U.S. nursing homes.
Keywords: pressure ulcers, wound care, nursing home residents, quality of care
More than 1 in 10 nursing home residents had a pressure ulcer.

Of the 1.5 million current U.S. nursing home residents in 2004, about 159,000 (11%) had pressure ulcers of any stage. Stage 2 was the most common (5%), accounting for about 50% of all pressure ulcers. Stages 1, 3, and 4 made up about the other 50% of all ulcers.
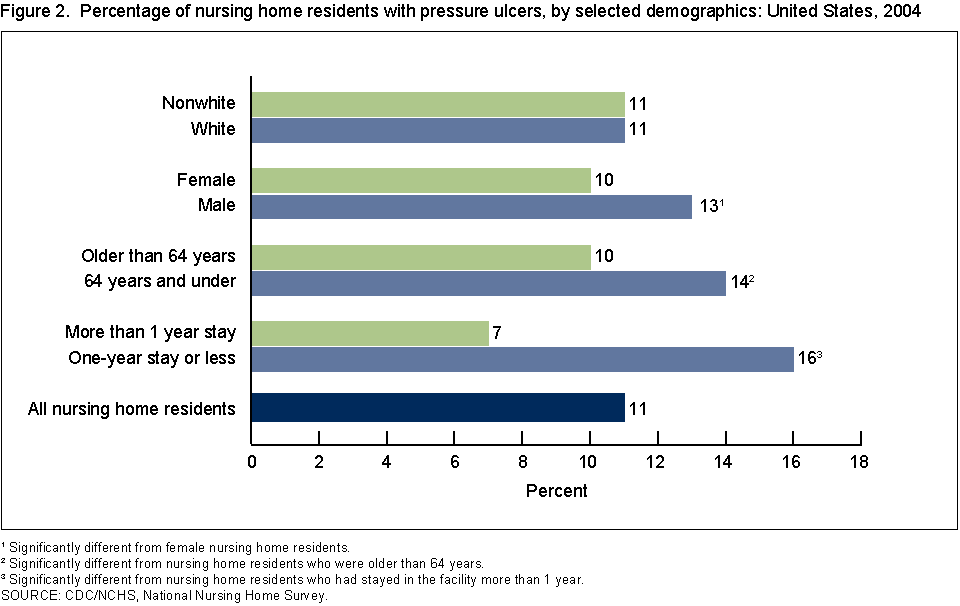
Pressure ulcer prevalence varied by age, sex, and length of time since admission to the nursing home, but not by race.
Residents aged 64 years and under were more likely than older residents to have pressure ulcers (14% and 10%, respectively). Pressure ulcers were more common in males (13%) than in females (10%). Residents in nursing homes for 1 year or less (16%) were more likely to have pressure ulcers than those with a longer length of stay (7%). There was no significant difference between white and nonwhite populations with respect to having pressure ulcers.
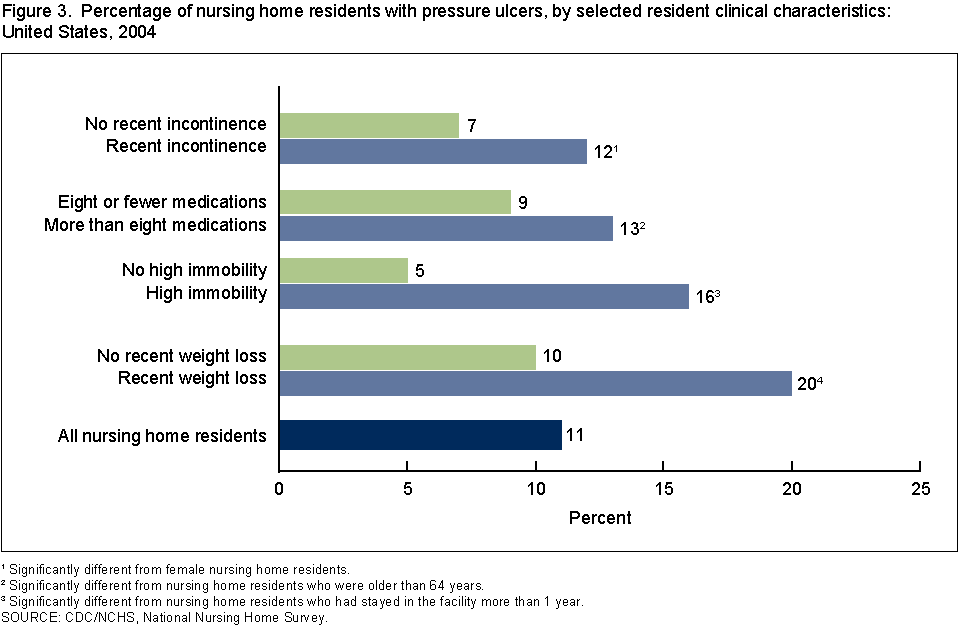
Pressure ulcer prevalence varied by different resident clinical characteristics.
Among nursing home residents, those with a recent weight loss (20%) were more likely to have pressure ulcers than those who had not had a recent weight loss (10%). Nursing home residents who had high immobility (16%) had an 11% greater occurrence of pressure ulcers than those without high immobility (5%). Polypharmacy, or taking more than eight medications, was related to a greater prevalence of pressure ulcers (13% and 9%, respectively). Pressure ulcers were more prevalent (12%) among residents who had any recent bowel or bladder incontinence than among continent residents (7%).
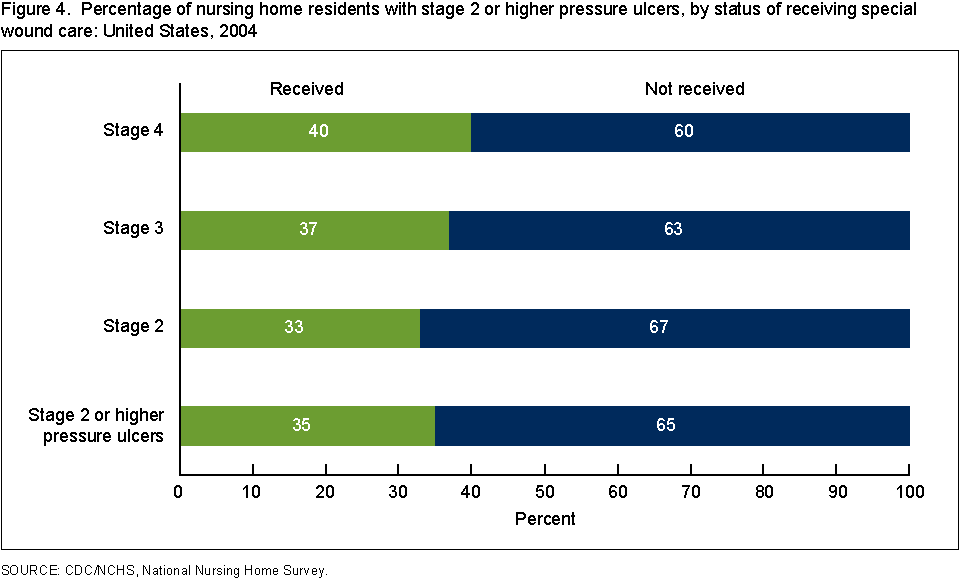
Thirty-five percent of nursing home residents with stage 2 or higher pressure ulcers received special wound care.
Among residents with stage 2 or higher pressure ulcers, 35% received wound care by specially trained professionals or staff. The percentage receiving special wound care was slightly higher for those with stage 4 (40%) than those with stage 2 (33%) or stage 3 (37%); however, these differences were not statistically significant.
Summary
Overall, 11% of nursing home residents had pressure ulcers in 2004. Various demographic and clinical factors were related to having a pressure ulcer in a nursing home. Residents in a nursing home for a year or less since admission, who had a recent weight loss, or who had high immobility had the highest prevalence of pressure ulcers. Among residents with a pressure ulcer of stage 2 or higher, 35% received special wound care services. This suggests that a minority of nursing home residents with stage 2 or higher pressure ulcers received wound care in accordance with the clinical practice guidelines. Pressure ulcers are serious and common medical conditions in U.S. nursing homes, and remain an important public health problem. Information from this Data Brief on pressure ulcer prevalence and service use among nursing home residents with pressure ulcers may provide a foundation for targeting public health efforts.
Definitions
Pressure ulcers: Nursing home providers were asked the highest stage of any pressure ulcer the sampled resident currently had. This measure had five categories: no pressure ulcer, stage 1, stage 2, stage 3, and stage 4.
- Stage 1: A persistent area of skin redness (without a break in the skin) that does not disappear when pressure is relieved.
- Stage 2: A partial thickness is lost and may appear as an abrasion, blister, or shallow crater
- Stage 3: A full thickness of skin is lost, exposing the subcutaneous tissues-presents as a deep crater with or without undermining adjacent tissue.
- Stage 4: A full thickness of skin and subcutaneous tissues are lost, exposing muscle or bone.
Recent Weight Loss: It is defined by a “yes” response to the following question: “Has the sampled nursing home resident had weight loss of 5% or more during the past 30 days or 10% or more during the past 180 days?”
High Immobility: It is measured using two measures, bed mobility (how resident moves to and from lying position, turns side to side, and positions body while in bed) and transfer (how resident moves between surfaces-to and from: bed, chair, wheelchair, and standing position). Each measure had five response categories: independent, supervision, limited assistance, extensive assistance, and total dependence. Residents were considered to have high immobility if they had a response of “extensive assistance” or “total dependence” for either or both bed mobility and transfer.
Recent Incontinence: It is measured using five categories: continent, usually continent (incontinent episodes less than weekly), occasionally incontinent (incontinent episodes once a week), frequently incontinent (incontinent 2 to 3 times a week), and total dependence (incontinent all or almost all of the time) in the last 14 days. Residents were considered to have incontinence if they were at least “usually incontinent” of the bladder or bowel.
Special Wound Care Services: It is defined by a “yes” response to the following question: “Is the sampled nursing home resident currently receiving services from a special program for skin or wound conditions? Special programs have one or more specially trained professionals or staff dedicated to the program. This does not include special training and services provided by all staff members.”
Data source and methods
The 2004 National Nursing Home Survey (NNHS) data were used for these analyses. NNHS is a continuous cross-sectional survey of a nationally representative sample of U.S. nursing homes. It is designed to provide descriptive information on nursing homes, their services, their staff members, and the residents they currently serve.
The sample design for the 2004 NNHS was a stratified, multistage probability design. The first stage was the selection of facilities and the second stage was the selection of residents. The primary sampling strata of facilities was defined by sampling bed size category and metropolitan area status. For the 2004 NNHS, 1,500 nursing homes were selected using systematic sampling with probability proportional to their bed sizes. The second stage sampling of current residents was carried out by the interviewers at the time of their visits to the facilities. The sampling frame for current residents was the total number of residents on the register of the facility as of midnight the day before the survey. A sample of up to 12 current residents per facility was selected, resulting in a total of 14,017 residents. The 2004 NNHS was administered using a computer-assisted personal interviewing (CAPI) system. Data were collected on facility characteristics and characteristics of the sampled residents.
The standard error (SE) is primarily a measure of the variability that occurs by chance because only a sample, rather than the entire universe, is surveyed. The SEs were approximated with SUDAAN software. SUDAAN computes SEs by using a first-order Taylor approximation of the deviation of estimates from their expected values. It should be noted that some estimates are presented but cannot be assumed reliable and are flagged with an asterisk (*). Estimates are flagged if they are based on between 30 and 59 cases, or if they are based on more than 59 cases, but have a relative standard error (RSE) exceeding 30%. RSE is defined as the estimate divided by its SE.
Differences between subgroups were evaluated using chi-square tests. All significance tests were two-sided using p <0.05 as the level of significance. All comparisons reported in the text are statistically significant unless otherwise indicated. Data analyses were performed using the statistical packages SAS version 9.1 (SAS Institute, Cary, N.C.) and SUDAAN version 9.0 (Research Triangle Institute, Research Triangle Park, N.C.).
About the authors
Eunice Park-Lee and Christine Caffrey are with the Centers for Disease Control and Prevention’s National Center for Health Statistics, Division of Health Care Statistics, Long-Term Care Statistics Branch.
References
- Agostini J, Baker D, Bogardus Jr S. Prevention of pressure ulcers in older patients. In: Shojania K, Duncan B, McDonald K, et al., eds. Making health care safer: A critical analysis of patient safety practices Evidence Report/Technology Assessment No. 43, AHRQ Publication No. 01-E058. Rockville, MD: Agency for Health Care Research and Quality, 2001.
- Cuddigan J, Berlowitz DR, Ayello EA. Pressure ulcers in America: Prevalence, incidence and implications for future: An executive summary of the National Pressure Ulcer Advisory Panel Monograph. Advances in Skin & Wound Care 14:208-15. 2001.
- Smith DM. Pressure ulcers in the nursing home. Annals of Internal Medicine 123:433-8. 1995.
- Institute of Medicine. Improving the quality of long-term care. Washington, DC: National Academy Press, 2001.
- Bergstrom N, Bennett MA, Carlson CE, et al. Treatment of pressure ulcers. Clinical practice guideline, No 15, AHRQ Publication no. 95-0652. Rockville, MD: Agency for Health Care Policy and Research, U.S. Department of Health and Human Services, 1994.
Suggested Citation
Park-Lee E, Caffrey C. Pressure ulcers among nursing home residents: United States, 2004. NCHS data brief, no 14. Hyattsville, MD: National Center for Health Statistics. 2009.
Copyright information
All material appearing in this report is in the public domain and may be reproduced or copied without permission; citation as to source, however, is appreciated.
National Center for Health Statistics
Director
Edward J. Sondik, Ph.D.
Acting Co-Deputy Directors
Jennifer H. Madans, Ph.D.
Michael H. Sadagursky