Healthy People 2000 Progress Review
Heart Disease and Stroke
“Applying Knowledge to Improve Cardiovascular Health for All Americans.”
Date: February 3, 1999
Time: 2:00-4:30 p.m.
A live broadcast from Wilson Auditorium on the campus of the National Institutes for Health
Dr. David Satcher, Assistant Secretary for Health and Surgeon General, will be joined by a panel of experts representing the public and private health sectors. Dr. Edward Sondik, Director of the National Center for Health Statistics, CDC, and Dr. Claude Lenfant, Director of the National Heart, Lung, and Blood Institute, NIH, will review the progress towards meeting the goals and targets for the Heart Disease and Stroke priority area of Healthy People 2000. The participants will then engage in a discussion that focuses on three main topics.
- The application of knowledge in preventing or lowering cardiovascular disease (CVD) risk for all Americans;
- Eliminating disparities in CVD risk among various population groups; and
- Reversing the trend in overweight/obesity.
Briefing Book Materials
Objective Charts (Color) [PDF – 535 KB]


Data Section
- Summary table [PDF – 18 KB]
- Individual objectives table [PDF – 50 KB]
- Objective charts (black and white) [PDF – 535 KB]
- Description of data sources [PDF – 17 KB]
Presentation
Edward J. Sondik, Ph.D.
Director, National Center for Health Statistics
February 3, 1999
Wilson Hall
NIH, Campus
Thank you. As Dr. Lenfant noted, we’ve made great progress in reducing deaths from heart disease and stroke, and in both understanding and treating these diseases. Yet, despite this progress, there is, arguably, still no more important component of Healthy People than these major cardiovascular conditions.
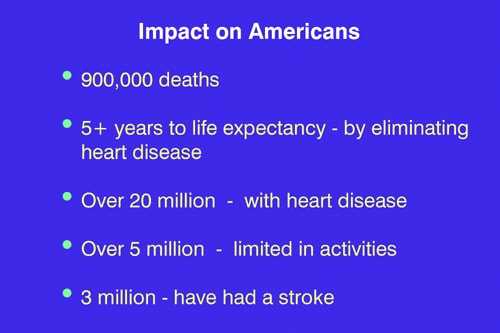
SLIDE 1 (Impact) Just consider: Heart disease and cerebrovascular disease together accounted for nearly 900,000 deaths in 1997. In fact, if we could eliminate heart disease, U.S. life expectancy at birth would increase by almost 5 years. Over 20 million Americans report that they have heart disease and, as a result a quarter of them experience limitations of activity. In addition, some 3 million Americans report they’ve had a stroke and for many the resulting disability affects their daily lives.
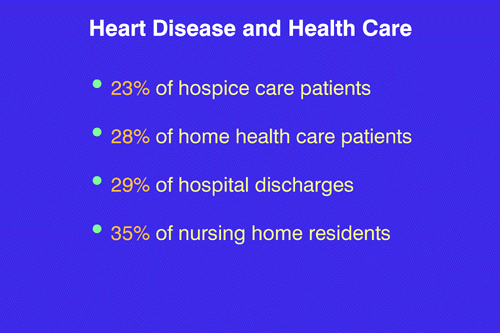
SLIDE 2 (Health care) – And consider, too, the health care resources involved: Heart disease accounts for 23 percent of hospice care, 28 percent of home health care, 29 percent of all hospitalizations and over a third of all nursing home care. Now to see how well we’ve met the challenges of this Healthy People component, let’s turn to the 17 objectives which make up this chapter.

SLIDE 3 (Blank) Dr. Lenfant painted the overall picture of our progress against heart disease and stroke. I’d like to focus now on some of the specifics. I’ll cover many of the objectives today, but not all of them in detail. More information’s available on the Healthy People Web site and the Web sites at NCHS and NHLBI.
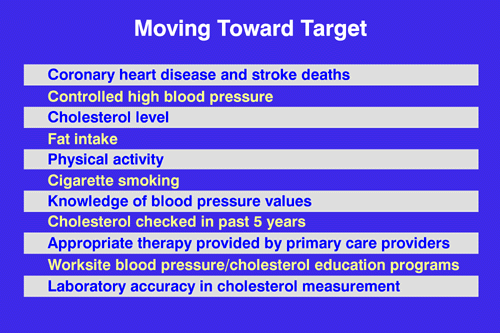
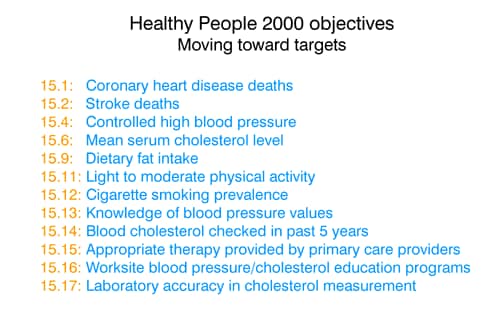
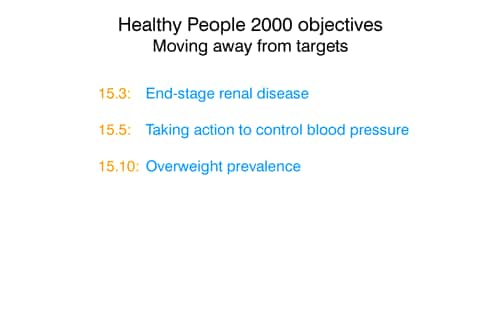
SLIDE 4. (Moving to target) This slide summarizes those objectives that are moving toward their year 2000 targets, although for some progress is less than we would have hoped. The objectives include targeted changes in mortality, change in risk factors — 7 objectives are shown here — and changes in primary care regimens, worksite programs and laboratory accuracy — all these objectives are showing progress. But we can’t say the same about reductions in disparities by race and ethnicity. There are some gains here but the picture is more mixed and we’ll discuss that in a moment or two. Let’s look first at coronary heart disease.
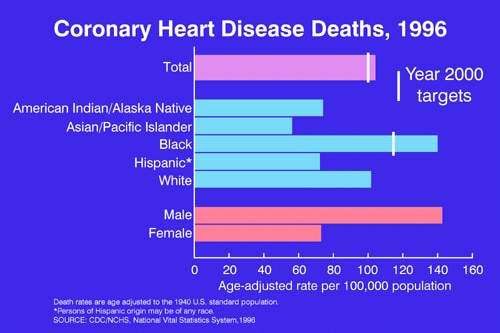
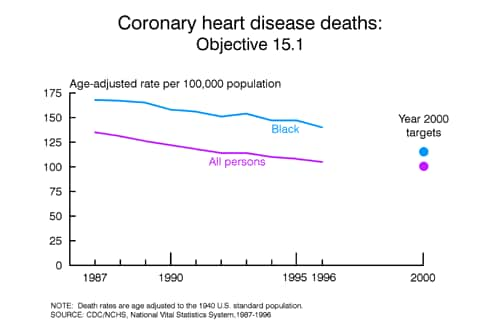
SLIDE 5. (Heart disease) – On the positive side, the coronary heart disease death rate is nearing the Year 2000 target, but the rate for black Americans is still considerably higher than the other race/ethnic groups shown in light blue on this slide. And the higher death rate for men has continued even as the rates for both men and women have declined.
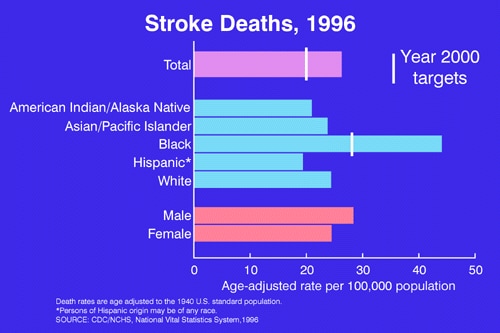
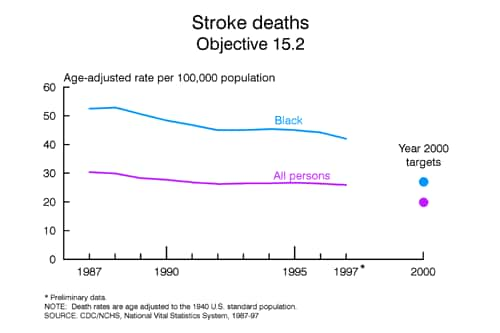
SLIDE 6. (Stroke) Similarly, as Dr. Lenfant mentioned, stroke death rates are dramatically higher for African Americans than the white population. In fact, rates for the black population are double the rates for any other population group. The gap between African Americans and all others was present at the Healthy People 2000 baseline and has not narrowed over the past decade.
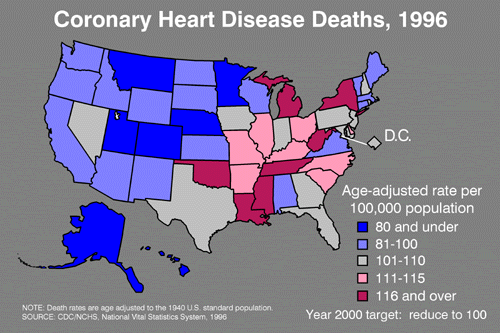
SLIDE 7. (heart disease state map) Looking beyond the national figures for both heart disease and stroke, there are significant state differences. In 1996, about a third of the states met the target to reduce coronary heart disease death rates, as shown in dark and light blue on this map. States with the highest rates are shown in red. And if we look more closely at smaller regions, we can see an even more complex mortality pattern.
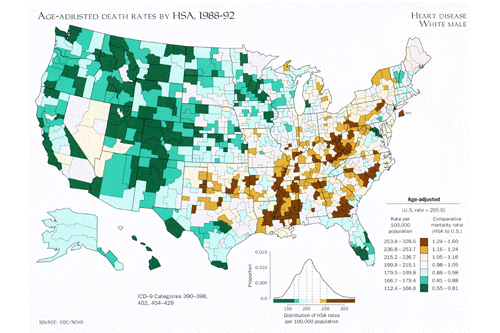
SLIDE 8. (Heart disease Atlas) In this slide from the “Atlas of United States Mortality” we grouped 5 years of data for more than 800 county clusters. The map shows heart disease death rates for white males, with the highest rates shown in dark brown; the lowest in dark green. This allows us to see patterns that were masked when reporting on a state-by-state basis as in the previous slide.

SLIDE 9. (Heart disease – SE states) For example, in this closeup of the southeastern states, we see that areas within the state of Georgia where rates range from 10 percent below the national average to 50 percent above the average.
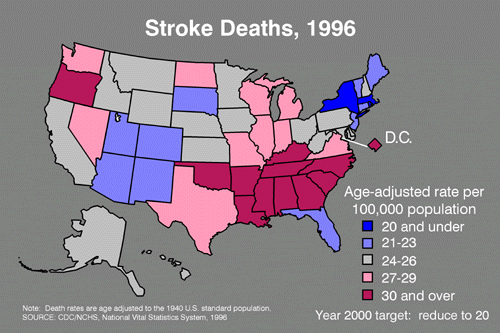
SLIDE 10. (Stroke map) Turning now to stroke deaths, only three states, as shown in blue on this map, have met the target of 20 deaths per 100,000 persons. You’ll also notice that what had been the “stroke belt”–a band of southeastern states with traditionally higher stroke death rates–has shifted in recent years, with high rates now observed in states to the north and west of the original cluster.

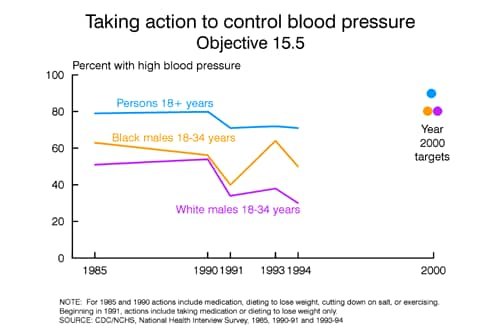
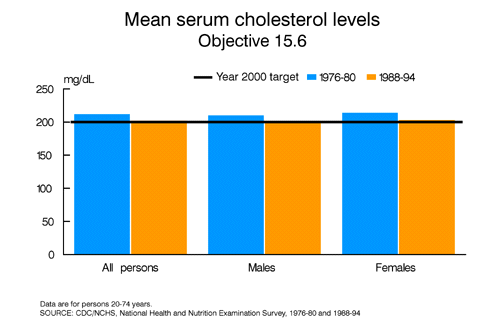
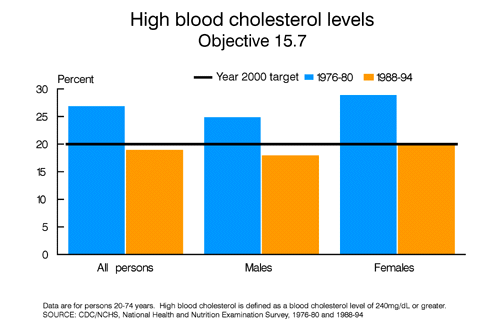
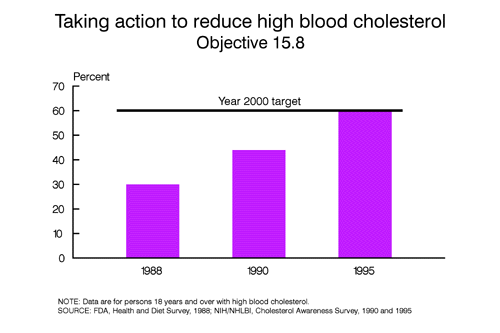
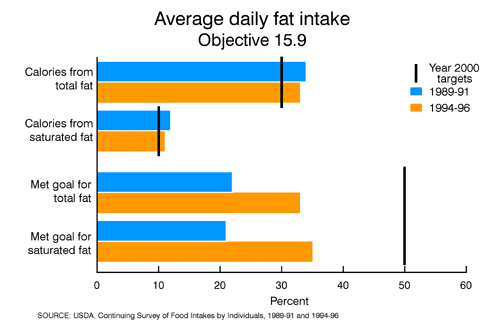
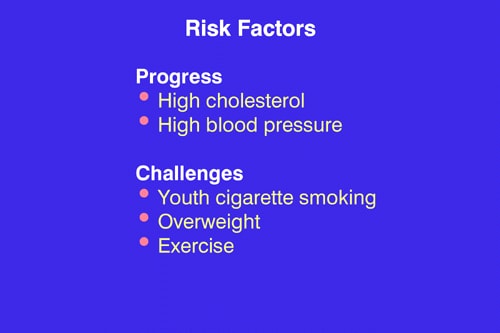
SLIDE 11. (Blank) Let’s turn to five critical risk factors that affect these death rates. First, high cholesterol, then, high blood pressure, smoking, being overweight and, finally, lack of exercise. Dr. Lenfant has described the very significant progress in reducing cholesterol and blood pressure levels. Now we’ll look at the other three important risk factors.
Turning first to smoking. Twenty five percent of American adults are smokers. Smoking contributes to more deaths in this country than any one single behavior. The long-term national trend in smoking has been down, but recently progress has stalled, with virtually no change between 1990 and 1995.

SLIDE 12. (Cigarette smoking) On a state-by-state basis, in 1997, only Utah reached the target of a smoking rate of 15 percent. Several other states and the District of Columbia, (shown in light blue) are close, but many miss the mark substantially. And speaking of missing the mark, let me focus for a moment on teen smoking.
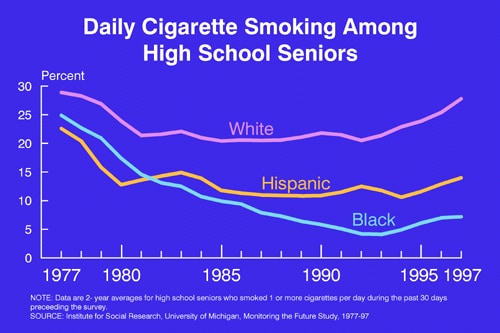
SLIDE 13. (Smoking–teens) After decades of decline, recent data show an upturn in smoking among teens. Today almost a third of white high school seniors are smoking. The rates for African American 12th graders, while much lower, have almost doubled in just the past few years and the rates for young Hispanics are also moving steadily upward.
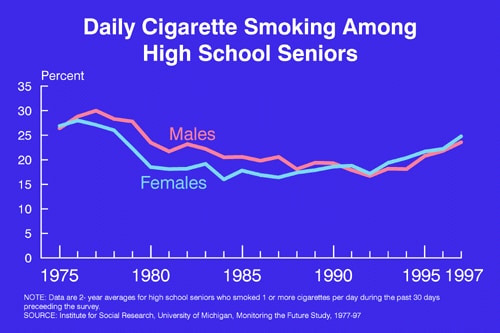
SLIDE 14. (smoking boys & girls) And the trends are the same for both boys and girls. This upturn in teen smoking is more than a cause for concern, it’s a call for even greater action. The progress we’ve seen in the past for heart disease and stroke may be reversed if we are not able to reach teenagers and convince them not to smoke.
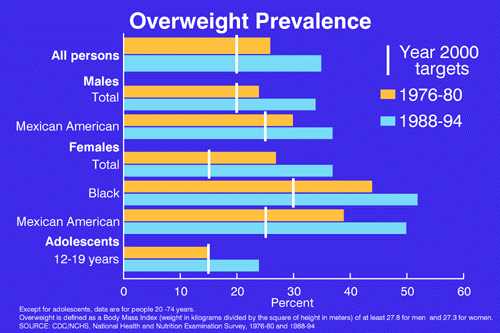
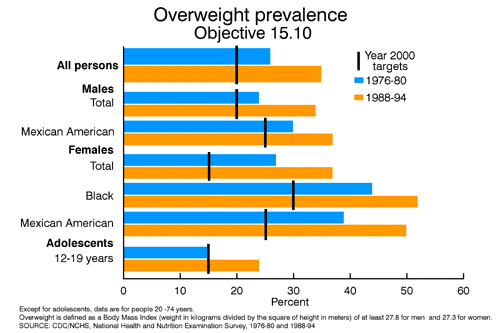
SLIDE 15. (Overweight prev) Another important risk factor is being overweight. More Americans today are overweight than at any time in our history. The data show that there’s been an increase in overweight for men and women, adults and adolescents, as well as for Mexican and African Americans–being overweight is truly an equal opportunity challenge.
However, this chart isn’t the whole story. A new definition of overweight, to be used in Healthy People 2010, lowers the threshold for being overweight. Under this newly adopted definition, more than half of all adults in this country are now considered overweight.

SLIDE 16. (Overweight map) In 1997, overweight prevalence varied considerably by state, but no state–even under the old definition–had reached the target of reducing overweight to 20 percent of the population. In general, states with high rates of overweight, smoking and other risk factors have the highest death rates for stroke and heart disease.
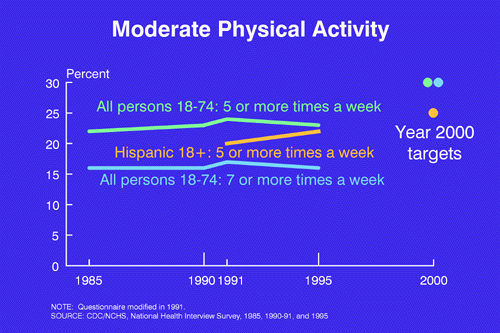
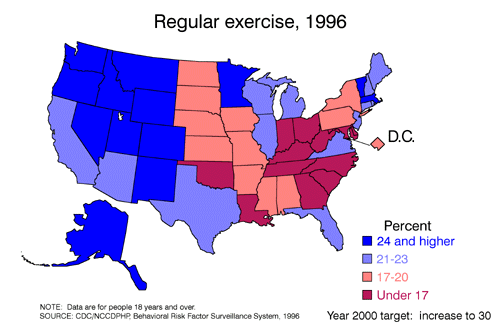
SLIDE 17. (Physical activity) The increase in overweight has resulted in a call for Americans to exercise more. For example, less than a quarter of American adults engage in moderate exercise 5 or more times a week. With little change over the past decade, it appears that even the modest Year 2000 goals in physical activity will not be achieved.
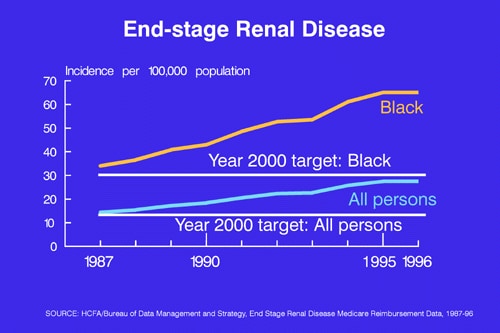
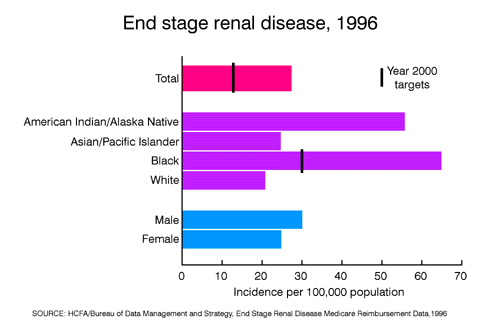
SLIDE 18. (End-stage renal) We have already mentioned the importance of hypertension, but high blood pressure is a risk factor for more than just heart disease and stroke, it is one of the major causes of End Stage Renal Disease or ESRD. One of our objectives has been to lower the incidence of ESRD, yet the incidence actually doubled in the past decade for both ESRD due to hypertension and ESRD related to diabetes.
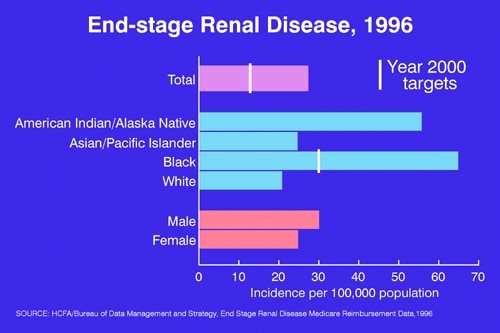
SLIDE 19. (renal – race/ethnicity) No group has reached the target set for reducing end stage renal disease, and the rates for blacks and American Indians and Alaska Natives are exceptionally high. In fact, the rate for African Americans has more than doubled since 1987.

SLIDE 20. (BLANK) We can certainly be proud of our progress in heart disease and stroke, but we shouldn’t be complacent. Second to cancer, heart disease and stroke together account for more potential years of life lost than any other cause of death, exceeding such killers of our young people as HIV, injuries and violence.
Heart disease death rates are higher for the U.S. population than in 20 other countries and if we compare rates just for the U.S. black population with other countries, the rate for Black America ranks 39th. These same countries that have lower heart disease death rates also exceed our nation in average life expectancy, since life expectancy is so dependent upon death rates from the major cardiovascular diseases.
SLIDE 21 (summary) This afternoon we’ve reviewed where we’ve made progress–the significant reductions in high cholesterol and high blood pressure and we’ve examined the bottom line–the decline in heart disease and stroke death rates. Together these results are proof that we can inform our citizens of health hazards and that they can and will take action. Today, we’ve also noted where progress has stalled–cigarette smoking in particular–and that lack of progress may endanger this new generation. And I’ve mentioned a continuing challenge for many of us–being overweight and not exercising.
In conclusion, the campaign against heart disease and stroke can achieve even greater success but we must deal with serious and pervasive health behavior problems if the progress of the next decade is to match that of past decades.