Comparing Racial and Ethnic Populations Based on Healthy People 2010 Objectives
Health People Statistical Notes, Number 26, August 2008
PDF Versionpdf icon (1.4 MB)
Kenneth Keppel, Ph.D.; Tamyra Garcia, M.P.H.; Suzanne Hallquist, M.S.P.H.; Asel Ryskulova, M.D.; and Lesley Agress, M.S.P.H., Office of Analysis and Epidemiology
Abstract
Objective – The Healthy People 2010 initiative (HP2010) specified objectives for improving the health of the nation, established baseline values, and set specific targets to be achieved by 2010. HP2010 objectives are based on two overarching goals: First, to increase years and quality of life, and second, to eliminate disparities among subgroups of the population. In this report racial and ethnic populations are compared based on progress toward targets, the size of disparities, and changes in disparity for specific sets of objectives.
Methods – Progress is measured in terms of movement toward or away from the target between the HP2010 baseline and the most recent data point. Disparities are measured as the percent difference between the rate for the racial and ethnic population with the best or most favorable rate and the rates for the other racial and ethnic populations. Changes in disparity are measured in terms of the percentage point change in the percent difference from the best group rate between the baseline and the most recent data point. Some comparisons can be made based on objectives with data for five populations (American Indian or Alaska Native, Asian, Hispanic or Latino, non-Hispanic black, and non-Hispanic white). Additional comparisons can be made for objectives with data for the three larger populations (Hispanic or Latino, non-Hispanic black, and non-Hispanic white).
Results – Differences between populations in progress toward the targets for HP2010 objectives are observed; however, the majority of objectives was moving toward or had reached their targets for each population. Greater differences between racial and ethnic populations are evident in the size of disparities. Disparities for the American Indian or Alaska Native, the Hispanic or Latino and non-Hispanic black populations are greater than those for the Asian and non-Hispanic white populations. Between the baseline and the most recent data point, the number of objectives with increasing disparities was similar to the number of objectives with decreasing disparities and there was no change in disparity for most objectives. In order to achieve the two goals of HP2010, rates must improve and relative differences between populations must be reduced.
Keywords: goals, objectives, progress, health disparity
Introduction
Objectives of this report
This report compares racial and ethnic populations on specific Healthy People 2010 (HP2010) objectives (1,2). Racial and ethnic populations are compared based on:
- Progress toward the HP2010 targets from the baseline to the most recent data point.
- The size of disparities among populations at the most recent data point.
- Changes in disparity from the baseline to the most recent data point.
Comparisons are based on objectives with data for five racial and ethnic populations (American Indian or Alaska Native, Asian, Hispanic or Latino, non-Hispanic black, and non-Hispanic white) and objectives with data for only the three larger populations (Hispanic or Latino, non-Hispanic black, and non-Hispanic white). More detailed information about progress toward targets, the size of disparities, changes in disparity, and the association between progress and changes in disparity is provided in Appendices or Healthy People 2010 Snapshots for each of the five racial and ethnic populations (Healthy People Snapshots). Detailed data on HP2010 objectives for the five racial and ethnic populations are also provided in an online Appendix (Healthy People Snapshots).
The Healthy People 2010 Midcourse Review (2) summarizes information for specific racial and ethnic populations. However, those summaries are not based on a consistent set of objectives because data were not available for all populations for each objective. Data were available for 155 objectives for the American Indian or Alaska Native population, 183 objectives for the Asian or Asian or Pacific Islander populations, 330 objectives for the Hispanic or Latino population, 356 objectives for the non-Hispanic black population, and 355 objectives for the non-Hispanic white population. In this report, comparisons are made first for objectives with data for all five racial and ethnic populations and then for those additional objectives with data for only the three larger populations.
This report provides three types of comparisons. First, comparisons are made between racial and ethnic populations in terms of progress toward HP2010 targets (1-3). To measure progress, data at the baseline and data for at least one more recent data point are required. Second, racial and ethnic populations are compared based on the size of disparities from the best group rate (3). These comparisons require data for only one point in time. Third, changes in disparities are compared across racial and ethnic populations (3). Comparisons of changes in disparity require data to measure disparity at the baseline and at a more recent point in time. Because these three comparisons have different data requirements, they are based on different sets of objectives.
Monitoring Healthy People 2010 objectives
HP2010 includes 955 objectives and subobjectives (referred to in this report as objectives). These objectives stem from the first overarching goal of Healthy People 2010, to improve the length and quality of life in the United States. For each objective, baseline data values were established and targets were set to be achieved by the year 2010 (1). There are 504 objectives that are measured in terms of the number, rate, or proportion of individuals in the population with a particular attribute, such as health conditions or outcomes, utilization of specific aspects of health care, or known health risks. These objectives are referred to as population-based objectives. Data for these objectives are sought for a minimum template of social and demographic characteristics, which includes race and ethnicity, gender, and income or education; however, data for all of these characteristics are not available for each objective (2). When data are available for the baseline and a more recent data point, progress toward the goal to improve the length and quality of life can be evaluated for specific social and demographic groups based on progress toward these targets. When data are available over time, progress toward the second overarching goal of Healthy People 2010, to eliminate disparities in health among social and demographic groups, can also be evaluated.
HP2010 provides an unusual opportunity to make comparisons across populations for a large number of health-related indicators. These comparisons should be made based on indicators that are comparable, populations that are comparable, and common sets of objectives. Most sources of data for Healthy People objectives collect and process data in the same way for the entire population under study, for example, data from vital statistics and national sample surveys. Vital statistics data represent the total population and sample survey data are weighted and adjusted to represent the total population. However, data from some sources are not necessarily representative of the population. Reporting of sexually transmitted diseases (STDs), for example, relies on reporting by health professionals. Health care providers in publicly supported clinics have been more likely to report STD cases than other health care providers (4). These data may not be equally representative of all racial and ethnic groups. Because differences in rates and other measures between populations can be due to differences in the proportion of younger or older people in these populations, whenever it is appropriate and the necessary data are available, the indicators employed in HP2010 are age adjusted to compensate for differences in population age distributions (5).
Comparisons across populations should be based on a consistent set of mutually exclusive and exhaustive racial and ethnic categories. While data collection and reporting procedures are generally consistent for a specific data system, all data systems do not yet report race and ethnicity according to the same standard (6) and the designs of some data sources do not support reliable estimates for all groups. For example, the National Health and Nutrition Examination Surveys provide statistically reliable data for only three racial and ethnic populations: Mexican American, non-Hispanic black, and non-Hispanic white. The National Vital Statistics System provides death rates for the Asian and Pacific Islander populations combined rather than reporting rates separately for the Asian population and the Native Hawaiian and Other Pacific Islander population. As a result, data for five racial and ethnic populations are not available for all of the population-based objectives in HP2010. In the database available for this report, for example, there were 115 objectives with the data required to measure progress toward the HP2010 target for five racial and ethnic groups but an additional 147 objectives had the data required to measure progress toward the target for the three larger populations (Hispanic or Latino, non-Hispanic black, and non-Hispanic white). In this report comparisons between racial and ethnic populations are made for objectives with data for all five populations and then for those additional objectives with data only for the three larger populations.
It should be noted that differences between racial and ethnic populations in progress toward HP2010 targets or in disparities among these populations are not only, or even necessarily, due to racial and ethnic identification. The differences described in this report are also due to factors that are associated with race and ethnicity, including: education, income, health-related behaviors, place of residence, country of origin, etc. (7). Efforts to reduce or eliminate racial and ethnic health disparities may need to address several of these factors.
Methods
This report is based on data in the HP2010 database (DATA2010) (8) at the beginning of August 2007. This date does not imply that data from all sources were current as of that date. For a limited number of objectives the most recent data year was 2005. For some objectives, only baseline data were available due to the periodic nature of data collection by some sources. The data used to monitor Healthy People objectives come from many different agencies and organizations (1).
Approximately one-quarter of the population-based objectives in HP2010 do not have estimates of variability, and tests of statistical significance are not computed for these objectives. For example, no estimates of variability are available for rates of new cases of tuberculosis, gonorrhea, and syphilis, which are based on voluntary reporting by health professionals. The data, on which these analyses are based, including the calculated measures of progress and disparity, are available in an online Appendix (Healthy People Snapshots).
Racial and ethnic populations
Information about race and ethnicity is collected and categorized in different ways by different data sources. This analysis is based on five racial and ethnic populations as defined below:
American Indian or Alaska Native – includes American Indians and Alaska Natives.
Asian – includes data from some sources for the category Asians only and data from other sources for the category Asian or Pacific Islanders. The later category includes Native Hawaiians and Other Pacific Islanders, a category for which some data sources provide data separately. However, this category comprises a small proportion of the Asian or Pacific Islander population. The Asian or Pacific Islander category is more frequently available. If data were available separately for both Asians only and Asian or Pacific Islanders, the data for Asian or Pacific Islanders were used.
Hispanic or Latino – includes data for the Hispanic or Latino population or the Mexican-American population, which comprises the majority of the Hispanic or Latino population. The tables in this report reflect the new OMB standards (6). The text in this report uses shorter versions of the OMB race and Hispanic or Latino origin terms for conciseness. For example, the category Not Hispanic or Latino, black or African American used in the tables is referred to as non-Hispanic black in the text.
Non-Hispanic black – includes data for the non-Hispanic black population.
Non-Hispanic white – includes data for the non-Hispanic white population.
A few sources provide data for additional categories such as Native Hawaiian or Other Pacific Islander, and two or more races (6). These two populations are not included in these comparisons because they would have greatly reduced the number of objectives in the common sets of objectives described in the following text.
Common sets of objectives
As noted, information about progress toward targets and the size of disparities in the Healthy People 2010 Midcourse Review is presented for all objectives with data for each racial and ethnic population but the number of objectives with data varies according to the racial and ethnic population (2). In the Midcourse Review, comparisons between racial and ethnic populations are, therefore, based on different sets of objectives. Comparisons between racial and ethnic populations can be improved by examining sets of objectives, all of which have data for specific populations. The analyses that follow are based on several different sets of objectives. Sets of objectives are determined by:
- The availability of data for specific racial and ethnic populations.
- The availability of data at the baseline and at a more recent data point.
- The availability of estimates of variability.
The numbers of objectives with data for each racial and ethnic population are shown in Table 1.
Measuring progress toward Healthy People 2010 targets
Nearly all HP2010 objectives have baseline and target values. Progress toward the target can be assessed as more recent data points become available (3). In this report, progress is assessed in terms of six categories. These categories expand on those used in the HP2010 Midcourse Review by distinguishing changes that are statistically significant from those that are not, when estimates of variability are available.
Met the target at baseline – for each objective, a single target was set for the total population. In some instances the value for a racial or ethnic population at the baseline was more favorable than the 2010 target. Objectives in this category also met the target at the most recent data point.
Met or exceeded the target – the most recent value is equal to or has exceeded the target for 2010.
Statistically significant move toward target – compared with the baseline data value, the most recent value is in the direction of the target and the change is statistically significant.
Moving toward the target – compared with the baseline data value, the most recent value is in the direction of the target and the change is not statistically significant or statistical significance could not be tested due to the lack of estimates of variability.
No change or moving away from the target – compared with the baseline value, the most recent value is the same as the baseline or it is in the direction away from the target and the change is not statistically significant or statistical significance could not be tested due to the lack of estimates of variability.
Statistically significant move away from the target – compared with the baseline value, the most recent value is in the direction away from the target and the change is statistically significant.
This assessment of progress is limited because it considers only data for the baseline and for the most recent data point. If intervening data values are available, they are not considered. The assessment of progress is also affected by the value of the targets. The targets for some objectives may have been more aggressive or optimistic than the targets for other objectives.
Assessing progress toward targets
To measure progress toward HP2010 targets, baseline data and data for at least one more recent data point are needed. Data are available to measure progress for the five racial and ethnic populations included in this report for 115 objectives, see Table 2. Estimates of variability are available for 87 of these objectives; there are no estimates of variability for 28 objectives. Progress toward HP2010 targets can be compared across all five populations for these two common sets of objectives. The data needed to measure progress for the three largest racial and ethnic populations (Hispanic or Latino, non-Hispanic black, and non-Hispanic white) are available for an additional 147 objectives (in addition to those objectives with data for five groups mentioned previously), with estimates of variability for 118 objectives and no estimates of variability for 29 objectives. Comparisons across the three larger populations are made based on these two common sets of objectives. The statistical significance of changes over time for the objectives with estimates of variability is tested with a two-tailed test with an alpha (α) level of 0.05. The results for the objectives without estimates of variability are presented without the benefit of any means of assessing the likelihood that differences might occur by chance.
Measuring the size of disparities
Disparities among racial and ethnic populations are measured in terms of the percent difference from the rate for the population with the most favorable or bestrate, as in the Midcourse Review. The term best does not imply that no further improvement is needed for that population. A relative measure of disparity, the percent difference, is used so that comparisons can be made across objectives that use different units of measurement, and because a reduction in the relative difference is required as evidence of progress toward eliminating disparities. To ensure consistency, all indicators are expressed in terms of adverse events when disparities are measured (3,9). The percent difference from the best group for each of the other groups associated with a characteristic is computed as:
Percent difference = (Ri – RB)/ RB x 100
where RB is the rate for the racial and ethnic population with the best or most favorable rate and Ri is the rate for each of the other racial and ethnic populations.
To ensure that disparity is measured from a reasonably stable data point, the most favorable group rate must have a relative standard error less than 10%. A relative standard error greater than 30% is used by many data sources to identify estimates that are statistically unreliable (10). However, when the relative standard error for the most favorable group rate is greater than or equal to 10%, the next most favorable group rate with a relative standard error of less than 10% is selected as the reference point. This criterion does not apply to measures without estimates of variability. If the next best rate is chosen, the less reliable rate is also considered a best rate. For some objectives, therefore, two or more groups may have the best rate. This occurs not only when the best group rate does not meet the reliability criterion but also when two or more groups have equally favorable rates.
For purposes of analysis, disparities are categorized as follows:
- Best group rate – The racial and ethnic-specific rate is more favorable than the rates for the other racial and ethnic populations, and (a) there are no estimates of variability, or (b) the relative standard error for the most favorable rate is less than 10%, or the rate is more favorable than the best group rate with a relative standard error greater than or equal to 10%.
- Less than 10% different – Less than 10% different from the best group rate, or the difference is greater than 10% and not statistically significant with an alpha (α) level of 0.05.
- 10%-49% different from the best group rate – unless the percent difference is not statistically significant.
- 50%-99% different from the best group rate – unless the percent difference is not statistically significant.
- 100%-199% different from the best group rate – unless the percent difference is not statistically significant.
- 200% or more different from the best group rate – unless the percent difference is not statistically significant.
In the Healthy People 2010 Midcourse Review, the last two categories were combined into a single category 100% or more different from the best group rate. The category Less than 10% different from the best group rate is employed to distinguish relatively small disparities from larger disparities; it does not mean that there is no disparity.
Assessing the size of disparities
The set of objectives for which disparities can be measured for all five racial and ethnic populations is larger than the set of objectives for which progress can be measured because data at a second point in time are not required. Disparities are measured at the most recent data point, which in some cases is the baseline. The data needed to measure disparities for all five racial and ethnic populations are available for 146 objectives, 111 with estimates of variability and 35 without estimates of variability. The data needed to measure disparities among the three larger populations are available for an additional 182 objectives, 140 objectives with estimates of variability and 42 objectives without estimates of variability, see Table 2. The statistical significance of the percent difference from the best group rate can be tested when estimates of variability are available. Disparities greater than or equal to 10% are classified as less than 10% different from the best group rate when the difference is not statistically significant based on a one-tailed test with an alpha (α) level of 0.05. This criterion cannot be applied when there are no estimates of variability. Consequently, objectives without estimates of variability are more likely to be placed in the categories greater than or equal to 10%, compared with those for which the statistical test can be performed. The American Indian or Alaska Native and Asian populations are also more likely to be selected as the best group when the relative standard error less than 10% criterion cannot be applied because estimates of variability are lacking.
Assessing changes in disparity
Changes in disparity can be assessed when disparity is measured at both the baseline and the most recent data point. Change in disparity is measured as the percentage point change in the percent difference from the best group rate. For purposes of this calculation the best group rate has a zero percent difference. Disparity may therefore increase for a group with the best rate at baseline and disparity may decrease for a group that became the best group at the most recent data point. The data needed to measure changes in disparity over time for five racial and ethnic populations are available for 112 objectives, 84 with estimates of variability and 28 without estimates of variability (Table 2). The data needed to measure changes in disparity for the three largest populations are available for an additional 119 objectives, 90 with estimates of variability and 29 without estimates of variability.
To summarize, in these analyses, the distribution of objectives according to categories of progress toward Healthy People targets, the distribution of objectives according to the size of disparities, and the numbers of objectives with increasing or decreasing disparities are compared across racial and ethnic populations. Measures of progress, disparity, and change in disparity for each racial and ethnic population are the units of analysis. Statistical tests cannot be employed to assess the significance of differences in the distribution of these measures across racial and ethnic populations. The results presented in this report should, therefore, be interpreted with some caution.
Findings
Progress toward Healthy People 2010 targets
In Figure 1, stacked bars show the percentage distribution of objectives according to categories of progress for the subset of 87 objectives with data for all five racial and ethnic populations and estimates of variability. For objectives moving toward the target and objectives moving away from the target, the statistical significance of the changes was tested. The percent of objectives for which the change toward the target is statistically significant is shown in Figure 1 by the hatched portion of the light green area of each bar, and the percent of objectives for which the change away from the target is statistically significant is shown by the hatched portion of the blue area in each bar. The significance of changes for objectives that met or exceeded the target and objectives that met the target at baseline was not tested because the degree of change from the baseline is not relevant if the HP2010 target has been achieved. Statistically significant changes are similarly identified in Figure 3.
In Figure 1, the American Indian or Alaska Native (36%), Asian (38%), and Hispanic or Latino (38%) populations have similar percentages of objectives that have no change or are moving away from the target (combining both significant and nonsignificant changes). The non-Hispanic black (30%) and non-Hispanic white (32%) populations have smaller percentages of objectives with no change or moving away from the target. Conversely, for more than 62% of these objectives, each population had met the target at baseline, met or exceeded the target, or moved toward the target. Tests of statistical significance add confidence to the conclusion that changes are occurring. However, significance is more likely to occur as the size of the population or the size of the sample increases. The non-Hispanic white population, therefore, has the largest proportions of objectives with significant changes both toward and away from the target.
Figure 1 shows that the Asian population had the largest percentage of objectives that met the target at baseline (13%) and the largest percentage of objectives that have already met or exceeded their targets (22%). For the Hispanic or Latino population, more than 18% of these objectives either had met their targets at baseline or have met or exceeded their targets. The distribution for the non-Hispanic black population differs from the distribution for the other racial and ethnic populations in several respects. The non-Hispanic black population has no objectives that met the target at baseline and only 3.4% of objectives that have met or exceeded their targets. However, this population also has the largest percentage of objectives that are moving toward their targets (67%).
The same comparisons can be made for 28 additional objectives for which no estimates of variability are available and no statistical tests can be performed, see Figure 2. None of the objectives in this group met their target at baseline. Again, the Asian population had the largest percentage of objectives that had met or exceeded their targets, and the non-Hispanic black population had the largest percentage of objectives that were moving toward the target. At least 64% of the objectives for each population have met their targets or are moving toward their targets. The Hispanic or Latino and non-Hispanic black populations had the smallest percentages of objectives with no change or moving away from the target.
The similarity in the percentages of objectives with no change or moving away from the target suggests that there might be specific objectives that are moving away from the target for all or most of these five populations. Among the 72 objectives in Figures 1 and 2 for which one or more populations moved away from the target, there were 11 objectives (15%) for which all five populations moved away from the target. The objectives that did not improve for any of the five populations are listed in Table 3.
Figure 3 shows the percentage distribution of objectives according to categories of progress toward targets for 118 objectives that have data for the three larger racial and ethnic populations but lack data for the American Indian or Alaska Native population or the Asian population. Estimates of variability are available for these objectives and the percentages with statistically significant changes are hatched. Among these objectives more than 63% had moved toward their targets, met or exceeded their targets, or met their targets at baseline for all three populations. As in the comparisons above, the non-Hispanic black population had the smallest percentage of objectives with no change or moving away from their targets. The non-Hispanic white population had the largest percentage of objectives that had met or exceeded their targets, followed by the non-Hispanic black and Hispanic or Latino populations.
Figure 4 provides information for 29 additional objectives with data for the Hispanic or Latino, non-Hispanic black, and non-Hispanic white populations, and without estimates of variability. The distribution for the non-Hispanic white population is clearly more favorable than the distribution for the other populations. This is the first racial and ethnic comparison in which the non-Hispanic white population has both the largest percentage of objectives that have met or exceeded their targets and the smallest percentage of objectives that have not changed or are moving away from their targets.
Among the 69 objectives in Figures 3 and 4 for which one or more of these three populations were moving away from the target, there were 29 objectives (42%) with all three populations moving away from the target, see Table 4.
When comparisons can be made among the five racial and ethnic populations, Asians have the greatest percentage of objectives that met their targets at baseline. As noted previously, targets for the total population for some objectives were set at a value less favorable than the baseline value for one or more of the racial and ethnic populations. The analysis of disparities that follows shows that the Asian population is more likely to have the most favorable rate. This accounts for the high percentage of objectives that met the target at baseline for the Asian population. When comparisons can be made only among the Hispanic or Latino, non-Hispanic black, and non-Hispanic white populations, the non-Hispanic white population has the largest percentage of objectives that have already met or exceeded their targets.
Given the findings of previous research that describe substantial disparities in health indicators among racial and ethnic populations (11-14), the finding that the non-Hispanic black population had the smallest percentage of objectives moving away from the target in three of the four comparisons above, is unexpected. However, progress toward targets for racial and ethnic populations and the size of disparities among these populations are independent (2,15). Improvements in health-related indicators are not necessarily accompanied by reductions in relative disparities as measured in HP2010. With the exception of the non-Hispanic black population in Figure 4 , the analyses above indicate that progress toward targets is occurring for at least 62% (and up to 79%) of the objectives for each population. Improvements in health indicators are occurring for these five racial and ethnic populations regardless of any disparities among the populations. That is, improvements are occurring for populations with more favorable rates and for populations with less favorable rates. It is also evident that there are clusters of objectives for which all racial and ethnic populations are not improving (Tables 3 and 4). The finding that similar proportions of objectives are improving for all five racial and ethnic populations does not mitigate the fact that 21%-38% of the population-based objectives included in these comparisons are not moving toward their HP2010 targets (Figures 1-2).
Size of disparities
To assess progress toward the second goal of HP2010, disparities among racial and ethnic populations are measured for the population-based objectives. In Figures 5 and 6, percent distributions of objectives by the size of disparities from the best group rate are shown for five racial and ethnic populations. Figure 5 shows the objectives with estimates of variability (111 objectives); in this figure, differences greater than or equal to 10% are statistically significant. The following discussion is based primarily on Figure 5 . Figure 6 shows percent distributions of objectives by size of disparities for 35 objectives without estimates of variability. When results differ from those in Figure 5 , they are noted.
Each of the five racial and ethnic populations in Figure 5 has the best group rate for at least 12% of these objectives. The percentages of best group rates add to more than 100% because the rates for some populations were the most favorable but the rates were not sufficiently reliable to be selected as the best rate for purposes of measuring disparity or because several populations had the same best rate. The Hispanic population had the smallest percentage of objectives with the best rate (12%). The Asian population had the largest percentage of objectives with the best rate, followed by the non-Hispanic white population. The objectives for which each racial and ethnic population had the best group rate are identified in the race-ethnic-specific Appendices to this report (Healthy People Snapshots).
Figure 5 shows that the American Indian or Alaska Native, Hispanic or Latino, and non-Hispanic black populations have disparities greater than or equal to 10% for at least two-thirds of these 111 objectives; this compared with 28% for the Asian population and 41% for the non-Hispanic white population. The non-Hispanic black population has the largest percentage of objectives that are 200% or more higher than the best group rate (15%) and the largest percentage of objectives that are at least 100% higher than the best group rate (15.3 + 17.1 = 32%). A 100% difference represents a rate that is two times the best group rate and a 200% difference is three times the best group rate.
In Figure 6 , the percentage of objectives for which the Asian population has the best rate is lower and the percentage of objectives for which the American Indian or Alaska Native population has the best rate is higher compared with Figure 5 . These differences reflect differences in the objectives included in Figures 5 and 6. The objectives in Figure 5 include many vital statistics indicators that produce reliable estimates for Asians and for which the Asian population has favorable rates. Because estimates of variability are not available for the objectives in Figure 6 , rates for the American Indian or Alaska Native population are more often designated as the best rate, because the criterion of having a relative standard error less than 10% cannot be applied.
The percentages of objectives with disparities of 10%-49% or more for the Hispanic or Latino, non-Hispanic white, and non-Hispanic black populations are higher in Figure 6 than in Figure 5 . This is also due to the absence of statistical testing. Differences of 10% or more cannot be reclassified as Less than 10% if they are not statistically significant. Differences of 200% or more are also more common in Figure 6 , reflecting the nature of the objectives with data for five groups but no estimates of variability. These objectives include reportable diseases such as hepatitis, tuberculosis, and STDs, objectives for which the non-Hispanic black population has large disparities (16). The ten largest disparities for each racial and ethnic group are identified in the race-ethnic-specific Appendices to this report (Healthy People Snapshots).
Distributions of disparities by size for objectives that lack data for the American Indian or Alaska Native population or the Asian population are shown in Figure 7 for 140 objectives with estimates of variability, and in Figure 8 for 42 objectives without estimates of variability. The following discussion is based primarily on Figure 7 . The differences between populations for these objectives are more distinct than those in Figures 5 and 6. When data are not available for the Asian population, the non-Hispanic white population has the best rate for more than one-half of these objectives (56%). The non-Hispanic white population has the best rate about twice as often as the other two populations. The non-Hispanic white population has differences greater than or equal to 10% for 15% of these objectives compared with 44% for both the non-Hispanic black and Hispanic or Latino populations. The non-Hispanic white population has differences of 50% or more for less than 3% of these objectives, compared with 17% for the non-Hispanic black population and 14% for the Hispanic or Latino population.
In Figure 8 , the Hispanic population has fewer objectives with the best rate and more objectives in the category 10%-49% different from the best group rate than in Figure 7 . The percentages of objectives in the less than 10% category are substantially smaller than those in Figure 7 , again reflecting that differences greater than 10% are not reclassified based on a test of statistical significance.
Differences in the distributions of disparities at the most recent data point among racial and ethnic populations are greater than differences in the distributions of progress toward the HP2010 targets. The disparities seen here are consistent with the findings of previous research (10-13). For those objectives with data for the five racial and ethnic populations, the Asian population has the most favorable distribution of disparities, the largest percentage of best group rates and the smallest percentage of objectives with differences greater than or equal to 10% different from the best group rate. The non-Hispanic white population has the next most favorable disparity distribution. The American Indian or Alaska Native, Hispanic or Latino, and non-Hispanic black populations all have the best group rate for at least 10% of these objectives; and disparities greater than or equal to 100% for at least 16% of these objectives.
For those objectives with data only for the three largest racial and ethnic populations, the non-Hispanic white population has the most favorable distribution of disparities, the most objectives with the best group rate, and the fewest objectives with disparities greater than or equal to 100%. In these comparisons, the non-Hispanic black population has the second largest percentages of objectives with the best group rate, however, this population also has the largest percentages of objectives with disparities greater than or equal to 100%. In Figures 5 , 7, and 8, the Hispanic or Latino population had the largest percentages of objectives in the 10%-49% category. The Hispanic or Latino population does not have as many objectives with the best group rate but it also does not have as many objectives with disparities of 100% or more as the non-Hispanic black population.
Changes in disparities
In the Healthy People 2010 Midcourse Review, changes in disparities are examined for all racial and ethnic populations combined using a summary index of disparity (2). Changes in disparity are identified for specific racial and ethnic populations; however, there was no summary of changes in disparity for each racial and ethnic group such as the one that follows.
For the purposes of measuring changes in disparity, there are 84 objectives with baseline data, more recent data, and estimates of variability for the five racial and ethnic populations. There are 28 more objectives with the required data and no estimates of variability. There are 90 additional objectives with trend data for only the three largest populations and estimates of variability and 29 more objectives with trend data for these populations but no estimates of variability.
In Figure 9, the number of objectives for which disparity is decreasing or increasing is shown for each racial and ethnic population for the 84 objectives with estimates of variability and the 28 objectives without estimates of variability. For the American Indian or Alaska Native population, for example, there are three objectives for which disparity decreased by 10 percentage points or more and seven objectives for which disparity increased by 10 percentage points or more. There was no statistically significant increase or decrease of 10 percentage points or more for the remaining 74 objectives. For this set of 84 objectives, the number of objectives with statistically significant increases in disparity is equal to or greater than the number of objectives with significant decreases in disparity for each racial and ethnic group except for the Asian population. For each population, disparities neither increased nor decreased by 10 percentage points or more for the majority of these objectives.
Among the 28 objectives without estimates of variability, the objectives with decreasing disparities outnumber objectives with increasing disparities for each racial and ethnic group except for the Asian population. As expected, the proportions of objectives with changes in disparity are much greater among the objectives without estimates of variability. When the two sets of objectives in Figure 9 are combined (those with estimates of variability and those without) the ratio of decreases to increases is 16:15 for the American Indian or Alaska Native population; 9:8 for the Asian population; 19:17 for the Hispanic or Latino population; 20:19 for the non-Hispanic black population; and 11:23 for the non-Hispanic white population. The number of objectives with decreasing disparities is very nearly equal to the number with increasing disparities, except for the non-Hispanic white population.
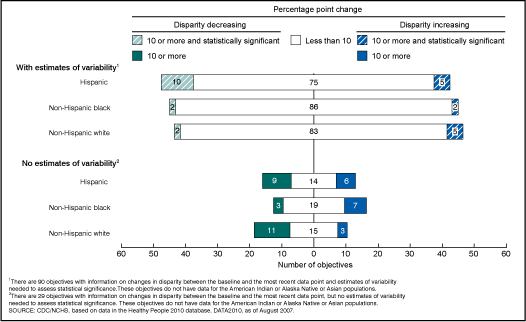
In Figure 10, the same kinds of comparisons are made for objectives with data for only the Hispanic or Latino, non-Hispanic black, and non-Hispanic white populations. Here again, the largest number of objectives for each population was in the category with less than a 10 percentage point change in disparity and the proportions of objectives with changes is larger among objectives with no estimates of variability. When objectives with estimates of variability and those with no estimates of variability are combined, the numbers of objectives with decreasing disparities outnumber those with increasing disparities, 19:11 for the Hispanic or Latino population and 13:8 for the non-Hispanic white population. There are fewer objectives with decreasing disparities than increasing disparities for the non-Hispanic black population, 5:9.
Limitations
This analysis is limited to the sets of objectives for which data are available, either for all five racial and ethnic populations or for only the three larger populations. Strictly speaking, these findings cannot be generalized to all health indicators or even to other objectives in HP2010. However, these results are indicative of differences between racial and ethnic populations for the objectives examined here.
This analysis is restricted by the lack of data by race and ethnicity and by the lack of comparability in the reporting of race and ethnicity by the sources of data for the population-based objectives in HP2010. The interpretation of these findings is also limited by the completeness and validity of data on race and Hispanic origin. The reliability and validity of the racial and ethnic data on which these results are based varies from one data source to another. For example, based on a recent comparison of race and Hispanic or Latino origin reported on death certificates with race and origin reported by the individual or a knowledgeable household member in the Current Population Survey, the death rate for the Hispanic or Latino population was underestimated by 5%, the death rate for the Asian population was underestimated by 7%, and the death rate for the American Indian or Alaska Native population was underestimated by 30% (17).
The measurement of progress toward targets and changes in disparity is based on data at the baseline and the most recent data point, whereas, disparities are measured at the most recent data point. Intervening data values are not considered. Baseline data years and most recent data years also vary among objectives from different sources. The data year for which disparities are measured, and the time period during which changes in disparity are measured, therefore, varies among objectives.
The probability that progress, disparities, and changes in disparity are due to sampling error or to random fluctuations in the data can only be assessed for those objectives for which estimates of variability are available. The statistical significance of some of the differences noted here cannot be tested. Finally, there is no way to assess the statistical significance of differences in the distributions of objectives presented here. Estimates of variability for objective specific measures of progress or disparity are applicable to comparisons among the racial and ethnic populations for a particular objective, from a particular data source. These estimates of variability cannot be used to assess the statistical significance of differences in the distribution of measures of progress or disparities based on different data sources.
Conclusions
The Healthy People 2010 initiative has two broad goals: First, to increase the years and quality of healthy life of the U.S. population and, second, to eliminate disparities in health among subgroups in the population. These two goals do not necessarily coincide (15). Improvements in indicators of health can occur without any reduction in relative disparities and vice versa. The findings presented here are consistent with those in the Healthy People 2010 Midcourse Review (2). Unlike the Midcourse Review, the comparisons between racial and ethnic populations made here are based on the same sets of objectives. Improvements are occurring for 62% to 79% of the objectives with data for five racial and ethnic populations and for 59% to 76% of the objectives with data for the three larger populations. On the other hand, there are clusters of objectives for which rates are moving away from the target for all five racial and ethnic populations or for the three largest racial and ethnic populations.
There were substantial disparities among racial and ethnic populations at the beginning of the decade for many HP2010 objectives. Each population has objectives for which disparities are decreasing and objectives for which disparities are increasing. The number of objectives with decreasing disparities is nearly the same as the number with increasing disparities and no change in disparity is the most frequent result. The association between progress toward the target and changes in disparity is examined further for each racial and ethnic population in the Appendices to this report (Health People Snapshots). In the appendix for the non-Hispanic black population, for example, rates improved from the baseline to the most recent data point for 24 of the 34 objectives for which disparity increased.
Improvements in the health of racial and ethnic populations are occurring for most Healthy People 2010 objectives, often without reductions in disparity relative to the most favorable racial and ethnic population rate. In order to achieve the two goals of Healthy People 2010, to improve health and eliminate disparities, not only must total population rates improve but also greater improvements must occur for populations with the most unfavorable rates.
References
- U.S. Department of Health and Human Services, Healthy People 2010. 2nd ed. With Understanding and Improving Health and Objectives for Improving Health, 2 vols. Washington, D.C.: U.S. Government Printing Office. 2000.
- Office of Disease Prevention and Health Promotion, Healthy People 2010 Midcourse Reviewexternal icon. 2006. (accessed February 16, 2007).
- Keppel KG, Pearcy JN, Klein RJ. Measuring progress in Healthy People 2010. Statistical Notes, no 25. Hyattsville, MD: National Center for Health Statistics. September 2004.
- STD Surveillance 2006.
- Klein RJ, Schoenborn CA. Age adjustment using the 2000 projected U.S. population. Statistical Notes, no 20. Hyattsville, MD: National Center for Health Statistics. January 2001.
- Office of Management and Budget. Revisions to the standards for the classification of federal data on race and ethnicity. Fed Reg 62:58781-90. 1997.
- House J, Williams D. Understanding and reducing socioeconomic and racial/ethnic disparities in health. In: Institute of Medicine. Promoting health: Intervention strategies from social and behavioral research. National Academy Press. 2000.
- National Center for Health Statistics, DATA2010, an interactive, on-line database containing baseline and tracking data for the Healthy People 2010 objectives.
- Keppel K, Pamuk E, Lynch J, et al. Methodological issues in measuring health disparities. National Center for Health Statistics. Vital Health Stat 2(141). 2005.
- Klein RJ, Proctor SE, Boudreault MA, Turczyn KM. Healthy People 2010 criteria for data suppression. Statistical Notes, no 24. Hyattsville, MD: National Center for Health Statistics. June 2002.
- National Healthcare Disparities Reportexternal icon. Agency for Healthcare Research and Quality, Rockville, MD. 2005.
- Institute of Medicine, Committee on understanding and eliminating racial and ethnic disparities in health care. Unequal treatment: Confronting racial and ethnic disparities in health care. Washington, D.C.: National Academy Press. 2003.
- An overview: Eliminating racial, ethnic, and SES disparities in health care. Health Care Financ Rev 21(4):1-7. 2000.
- Keppel K, Pearcy J, Wagener D. Trends in racial and ethnic-specific rates for the health status indicators: United States, 1990-98. Statistical Notes, no 23. Hyattsville, MD: National Center for Health Statistics. January 2002.
- Keppel K, Bilheimer L, Gurley L. Improving population health and reducing health care disparities. Health Aff (26)5:1281-92. 2007.
- Keppel K. Ten largest racial and ethnic health disparities in the United States based on Healthy People 2010 Objectives. Am J Epidemiol (1):97-103. 2007.
- Arias E, Schauman E, Eschbach K, Sorlie P, Backlund E. The validity of race and Hispanic or Latino origin reporting on death certificates in the United States. National Center for Health Statistics. Vital Health Stat. Forthcoming.
Suggested Citation
Keppel K, Garcia T, Hallquist S, Ryskulova A, and Agress L. Comparing racial and ethnic populations based on Healthy People 2010 objectives. Healthy People Statistical Notes, no 26. Hyattsville, MD: National Center for Health Statistics. 2008.
Figures
Figure 1. Percent distribution of 87 Healthy People 2010 objectives, by progress category, for five racial and ethnic populations
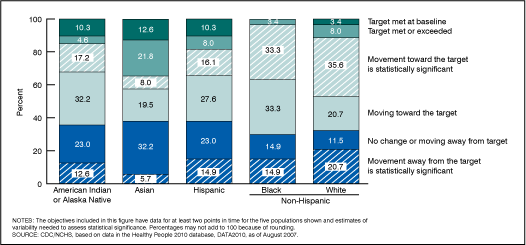
Figure 2. Percent distribution of 28 Healthy People 2010 objectives, by progress category, for five racial and ethnic populations
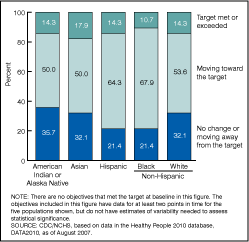
Figure 3. Percent distribution of 118 Healthy People 2010 objectives, by progress category, for three racial and ethnic populations
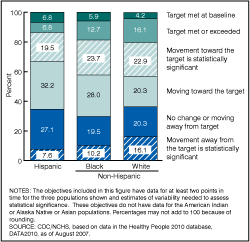
Figure 4. Percent distribution of 29 Healthy People 2010 objectives, by progress category, for three racial and ethnic populations
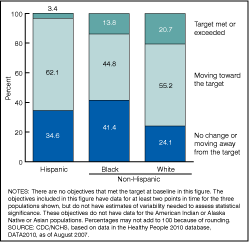
Figure 5. Percent distribution of 111 Healthy People 2010 objectives, by size of disparity, for five racial and ethnic populations
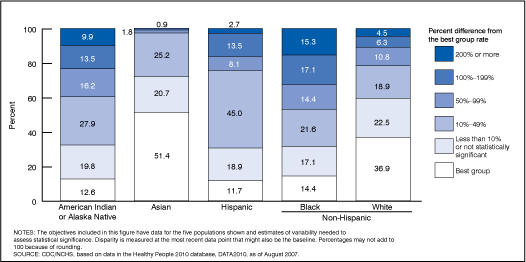
Figure 6. Percent distribution of 35 Healthy People 2010 objectives, by size of disparity, for five racial and ethnic populations
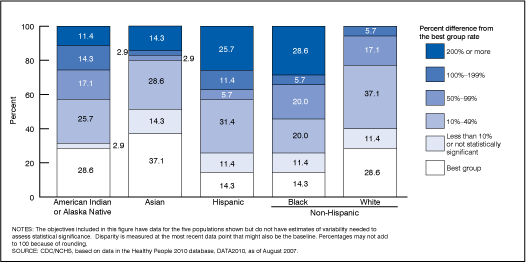
Figure 7. Percent distribution of 140 Healthy People 2010 objectives, by size of disparity, for three racial and ethnic populations
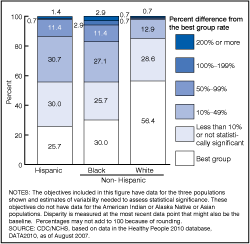
Figure 8. Percent distribution of 42 Healthy People 2010 objectives, by size of disparity, for three racial and ethnic populations
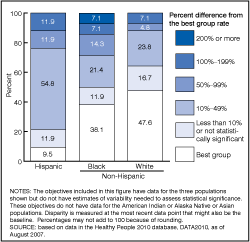
Figure 9. Number of Healthy People 2010 objectives, by amount of change in disparity from the baseline to the most recent data point, for five racial and ethnic populations
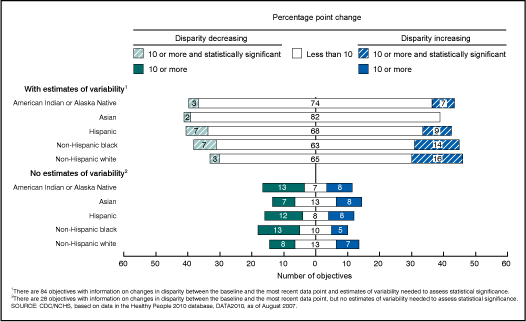
Figure 10. Number of Healthy People 2010 objectives, by amount of change in disparity from the baseline to the most recent data point, for three racial and ethnic populations
Tables
Table 1. Number and percentage of Healthy People 2010 objectives with data for at least one data point and with data at both the baseline and at least one more recent data point for racial and ethnic populations
| Objectives with at least one data point1 | Objectives with baseline data and at least one more recent data point | |||
|---|---|---|---|---|
| Racial and ethnic populations | Number | Percent | Number | Percent |
| Population-based objectives, Total = 504 |
||||
| American Indian or Alaska Native | 160 | 31.7 | 123 | 24.4 |
| Asian or Pacific Islander | 188 | 37.3 | 147 | 30.4 |
| Native Hawaiian or Other Pacific Islander | 41 | 8.1 | 32 | 6.3 |
| Hispanic or Latino | 358 | 71.0 | 270 | 53.6 |
| Not Hispanic or Latino: Black or African American | 394 | 78.2 | 304 | 60.3 |
| Not Hispanic or Latino: White | 400 | 79.4 | 315 | 62.5 |
1 With data at the baseline and/or a more recent data point.
SOURCE: CDC/NCHS, the Healthy People 2010 database, DATA2010, as of August 1, 2007.
Table 2. Number of Healthy People 2010 objectives with the data required to measure progress, disparity and changes in disparity for five racial and ethnic populations or for three racial and ethnic populations
| With data for the following populations: | Total with data for the Hispanic, non-Hispanic black, or non-Hispanic white populations | |||
|---|---|---|---|---|
| Data requirements | American Indian or Alaska Native, Asian, Hispanic, non-Hispanic black, or non-Hispanic white | Hispanic, non-Hispanic black, or non-Hispanic white1 | Number | Percent of all population-based objectives (n=504) |
| Measure progress from the baseline to the most recent data point | 115 | 147 | 262 | 52.0 |
| With estimates of reliability | 87 | 118 | NA | NA |
| Without estimates of reliability | 28 | 29 | NA | NA |
| Measure disparity among racial and ethnic populations | 146 | 182 | 328 | 65.1 |
| With estimates of reliability | 111 | 140 | NA | NA |
| Without estimates of reliability | 35 | 42 | NA | NA |
| Measure change in disparity between the baseline and the most recent data point | 112 | 119 | 231 | 45.8 |
| With estimates of reliability | 84 | 90 | NA | NA |
| Without estimates of reliability | 28 | 29 | NA | NA |
1 Data might also be available for the American Indian or Alaska Native population or the Asian population, but not both.
NOTE: NA is not applicable.
SOURCE: CDC/NCHS, the Healthy People 2010 database, DATA2010, as of August 1, 2007.
Table 3. Objectives for which there was no movement toward the target for any of the following populations: American Indian or Alaska Native, Asian, Hispanic, non-Hispanic black, or non-Hispanic white
| Objective number | Objective |
|---|---|
| 3-11b | Pap tests – Received within past 3 years (aged 18 years and over) |
| 14-29c | Influenza vaccination of noninstitutionalized high-risk adults in the past 12 months (aged 18-64 years) |
| 15-8 | Deaths from poisoning |
| 16-1f | Infant deaths (within 1 year) from birth defects |
| 16-9a | Cesarean births – Women giving birth for the first time |
| 16-9b | Cesarean births – Prior cesarean birth |
| 16-10a | Low birthweight (LBW) infants (less than 2,500 grams) |
| 16-11a | Total preterm births (less than 37 weeks gestation) |
| 16-11b | Preterm births – Live births at 32-36 weeks of gestation |
| 25-1a | Chlamydia infections among females attending family planning clinics (aged 15-24 years) |
| 27-16a | Exposure to tobacco advertising and promotions via the Internet (grades 6-12) |
SOURCE: CDC/NCHS, the Healthy People 2010 database, DATA2010, as of August 1, 2007.
Table 4. Objectives for which there was no movement toward the target for objectives with data for the Hispanic, non-Hispanic black, and non-Hispanic white populations
| Objective number | Objective |
|---|---|
| 2-1 | Mean level of joint pain among adults with arthritis |
| 2-2 | Activity limitations due to arthritis (age adjusted, aged 18 years and over) |
| 2-5a | Unemployment rate among adults with arthritis (age adjusted, aged 18-64 years) |
| 2-7 | Seeing a health care provider among adults with chronic joint symptoms (age adjusted, aged 18 years and over) |
| 3-12a | Colorectal cancer screening – Adults receiving a fecal occult blood test (FOBT) within past 2 years (aged 50 years and over) |
| 5-2 | New cases of diabetes – 3-year average (age adjusted per 1,000 standard population, aged 18-84 years) |
| 5-3 | Prevalence of diabetes (age adjusted per 1,000 standard population) |
| 6-3 | Negative feelings interfering with activities among adults with disabilities (age adjusted, aged 18 years and over) |
| 7-6 | Participation in employer-sponsored health promotion activities (age adjusted, aged 18 years and over) |
| 9-2 | Birth spacing – Births occurring within 24 months of a previous birth (females aged 15-44 years) |
| 9-3 | Contraceptive use – Females at risk of unintended pregnancy (aged 15-44 years) |
| 12-9 | High blood pressure (age adjusted, aged 20 years and over) |
| 14-29a | Influenza vaccination of noninstitutionalized adults in the past 12 months (aged 65 years and over) |
| 15-38 | Physical fighting among adolescents (grades 9-12) |
| 16-4 | Maternal deaths (per 100,000 live births) |
| 19-1 | Healthy weight in adults (age adjusted, aged 20 years and over) |
| 19-2 | Obesity in adults (age adjusted, aged 20 years and over) |
| 19-3a | Overweight or obesity in children (aged 6-11 years) |
| 19-3b | Overweight or obesity in adolescents (aged 12-19 years) |
| 19-3c | Overweight or obesity in children and adolescents (aged 6-19 years) |
| 19-12c | Iron deficiency in nonpregnant females (aged 12-49 years) |
| 21-1a | Dental caries experience – Primary teeth – Young children (aged 2-4 years) |
| 24-6 | Patient education – Among persons with asthma (age adjusted, aged 18 years and over) |
| 25-1c | Chlamydia infections among males attending STD clinics (aged 15-24 years) |
| 26-14a | Steroid use among adolescents – 8th graders |
| 26-14b | Steroid use among adolescents – 10th graders |
| 26-14c | Steroid use among adolescents – 12th graders |
| 26-18a | Treatment for illicit drugs (aged 12 years and older) |
| 26-18b | Treatment for alcohol and/or drugs (aged 12 years and older) |
NOTE: Objectives do not have data for the American Indian or Alaska Native or Asian populations.
SOURCE: The Healthy People 2010 database, DATA2010, as of August 1, 2007.