Vital Signs: Binge Drinking Prevalence, Frequency, and Intensity Among Adults — United States, 2010
Abstract
Background: Binge drinking accounts for more than half of the estimated 80,000 average annual deaths and three quarters of $223.5 billion in economic costs resulting from excessive alcohol consumption in the United States.
Methods: CDC analyzed data collected in 2010 on the prevalence of binge drinking (defined as four or more drinks for women and five or more drinks for men on an occasion during the past 30 days) among U.S. adults aged ≥18 years in 48 states and the District of Columbia; and on the frequency (average number of episodes per month) and intensity (average largest number of drinks consumed on occasion) among binge drinkers.
Results: The overall prevalence of binge drinking was 17.1%. Among binge drinkers, the frequency of binge drinking was 4.4 episodes per month, and the intensity was 7.9 drinks on occasion. Binge drinking prevalence (28.2%) and intensity (9.3 drinks) were highest among persons aged 18–24 years. Frequency was highest among binge drinkers aged ≥65 years (5.5 episodes per month). Respondents with household incomes ≥$75,000 had the highest binge drinking prevalence (20.2%), but those with household incomes <$25,000 had the highest frequency (5.0 episodes per month) and intensity (8.5 drinks on occasion). The age-adjusted prevalence of binge drinking in states ranged from 10.9% to 25.6%, and the age-adjusted intensity ranged from 6.0 to 9.0 drinks on occasion.
Conclusions: Binge drinking is reported by one in six U.S. adults, and those who binge drink tend to do so frequently and with high intensity.
Implications for Public Health Practice: More widespread implementation of Community Guide–recommended interventions (e.g., measures controlling access to alcohol and increasing prices) could reduce the frequency, intensity, and ultimately the prevalence of binge drinking, as well as the health and social costs related to it.
Introduction
Excessive alcohol use* accounted for an estimated average of 80,000 deaths and 2.3 million years of potential life lost (YPLL)† in the United States each year during 2001–2005, and an estimated $223.5 billion in economic costs in 2006 (1). Binge drinking accounted for more than half of those deaths, two thirds of the YPLL (2), and three quarters of the economic costs (1). Binge drinking also is a risk factor for many health and social problems, including motor-vehicle crashes, violence, suicide, hypertension, acute myocardial infarction, sexually transmitted diseases, unintended pregnancy, fetal alcohol syndrome, and sudden infant death syndrome (3). In 2010, 85% of all alcohol-impaired driving episodes were reported by persons who also reported binge drinking (4). In the United States, binge drinking accounts for more than half of the alcohol consumed by adults (5) and 90% of the alcohol consumed by youths (6). However, most binge drinkers are not alcohol dependent (7).
Reducing the prevalence of binge drinking among adults is a leading health indicator in Healthy People 2020 (objective SA-14.3) (8). To assess measures of binge drinking nationwide and by state, CDC analyzed developmental data§ from the 2010 Behavioral Risk Factor Surveillance System (BRFSS) on the prevalence of binge drinking among adults, and on the frequency and intensity of drinking among respondents who reported binge drinking.
Methods
BRFSS is a state-based, random-digit–dialed telephone survey of noninstitutionalized, civilian U.S. adults that collects information on many health conditions and risk behaviors, including binge drinking. BRFSS surveys are administered to households with landlines in all states and the District of Columbia (DC).
In September 2011, BRFSS released a developmental dataset for 2010¶ that included combined landline and cellular telephone–only adults and used the raking method** for weighting, known also as iterative proportional fitting (9). A total of 48 states (all except South Dakota and Tennessee) and DC administered the survey to landline and cellular telephone-only adults, and a median of 7.2% of the total surveys in these states were completed by cellular telephone-only adults (range: 2.0% in New Jersey to 32.0% in Minnesota).
Annually, respondents who report consuming any alcoholic beverages are asked how many times they engaged in binge drinking, defined as consuming four or more alcoholic drinks per occasion for women and five or more drinks per occasion for men during the preceding 30 days.†† In addition, respondents who report alcohol consumption are asked about the largest number of drinks they had on any occasion in the preceding 30 days. The average prevalence of binge drinking was calculated by dividing the total number of respondents who reported at least one binge drinking episode during the preceding 30 days by the total number of BRFSS respondents in the 48 participating states and DC. The average frequency of binge drinking was calculated by dividing the total number of binge drinking episodes by the total number of respondents who reported any binge drinking during the preceding 30 days. The average intensity of binge drinking was calculated by averaging the largest number of drinks reported on an occasion by binge drinkers. Respondents who refused to answer, had a missing answer, or who answered "don't know/not sure" were excluded from the analysis.
In 2010, the median Council of American Survey and Research Organizations (CASRO) response rate for the landline BRFSS was 54.6% (range: 39.1% to 68.8%), and the median CASRO cooperation rate was 76.9% (range: 56.8%–86.1%).§§ A response rate for the 2010 BRFSS developmental dataset was not available. A total of 457,677 respondents (422,039 landline respondents and 35,638 cellular telephone respondents) were included in the analysis. Two-tailed t-tests were used to assess statistical significance (p<0.05). Only statistically significant subgroup differences are reported. State estimates were age-adjusted to the 2000 U.S. Census standard population.
Results
In 2010, the overall prevalence of binge drinking among adults in the 48 states and DC was 17.1% (Table 1). Binge drinking prevalence among men (23.2%) was twice that of women (11.4%). Men who reported binge drinking reported a higher frequency and intensity (5.0 episodes per month and 9.0 drinks on occasion) than women (3.2 episodes per month and 5.9 drinks on occasion). Binge drinking also was most common among persons aged 18–24 years (28.2%) and 25–34 years (27.9%), and decreased with increasing age. However, the highest frequency of binge drinking by age was reported by persons aged ≥65 years (5.5 episodes per month). The intensity of binge drinking was highest among persons aged 18–24 years (9.3 drinks on occasion) and 25–34 years (8.4 drinks on occasion) and decreased with age. The prevalence of binge drinking among non-Hispanic whites (18.0%) was similar to the prevalence among Hispanics (17.9%), but significantly higher than the prevalence for non-Hispanic blacks (12.7%) and non-Hispanics from other racial and ethnic groups (including American Indians/Alaska Natives and Asians/Native Hawaiians or other Pacific Islanders) (15.3%). The frequency of binge drinking was similar across racial and ethnic groups, but the highest intensity was reported by binge drinkers who were non-Hispanics from other racial and ethnic groups (8.7 drinks) and by Hispanics (8.4 drinks on occasion). Respondents who did not graduate from high school had the lowest prevalence of binge drinking (13.7%), but those who binge drank had the highest frequency (5.5 episodes per month) and intensity (9.3 drinks on occasion) compared with respondents with higher educational levels. Binge drinking prevalence increased with household income, and was highest among those with annual household incomes ≥$75,000 (20.2%). However, the highest frequency and intensity of binge drinking by household income was reported by those with incomes <$25,000 (5.0 episodes per month and 8.5 drinks on occasion, respectively).
The age-adjusted prevalence of binge drinking by state ranged from 10.9% (Utah) to 25.6% (Wisconsin) (Table 2). The age-adjusted frequency of binge drinking ranged from 3.6 episodes per month (New Jersey) to 5.9 episodes per month (Kentucky). The age-adjusted intensity of binge drinking ranged from 6.0 drinks on occasion (DC) to 9.0 drinks on occasion (Wisconsin). Overall, states with the highest age-adjusted prevalence of adult binge drinking were in the Midwest and New England, and included DC, Alaska, and Hawaii (Figure 1). States with the highest intensity of adult binge drinking were generally located in the southern Mountain states and Midwest, and included some states (e.g., Louisiana, Mississippi, New Mexico, South Carolina, and Utah) that had a lower prevalence of binge drinking (Figure 2).
Conclusions and Comment
The results in this report indicate that in 2010, binge drinking was common among U.S. adults, and persons who binge drank tended to do so frequently (average of four times per month) and with high intensity (average of eight drinks on occasion), placing themselves and others at a significantly greater risk for alcohol-attributable harms (2,3). Binge drinking prevalence and intensity were highest among persons aged 18–24 years and 25–34 years, but frequency was highest among binge drinkers aged ≥65 years. Those with household incomes ≥$75,000 had the highest binge drinking prevalence, but binge drinkers with household incomes <$25,000 reported the highest frequency and intensity of binge drinking. In a number of states with a lower prevalence of binge drinking, those who binge drank did so with high intensity.
The higher prevalence of binge drinking in 2010 (17.1%), compared with 2009 (15.2%) (10), likely resulted from inclusion of cellular telephone respondents in the 2010 developmental BRFSS dataset. Cellular telephone–only users typically are young (aged 18–34 years) and male (11); both groups tend to report a higher prevalence of binge drinking. Even after adjusting for age, cellular telephone respondents have a higher prevalence of binge drinking than landline respondents (10,12). These findings confirm the importance of increasing the number of cellular telephone respondents in the BRFSS to assess binge drinking and related harms more accurately.
The higher prevalence of binge drinking among males, whites, young adults, and persons with higher household incomes has been reported previously (10), and probably reflects differences in state and local laws that affect the price, availability, and marketing of alcoholic beverages (13), as well as other cultural and religious factors (14). Estimates of the frequency and intensity of binge drinking also reveal important disparities in this behavior, including a significantly higher frequency among older adults and a higher intensity among persons with lower household incomes. These differences are reflected in state measures of the prevalence and intensity of binge drinking, and emphasize that states with a lower prevalence of binge drinking might still include subgroups that binge drink frequently and with high intensity. Binge drinking places those exposed and others at substantially increased risk for alcohol-attributable harms, and contributes disproportionately to productivity losses, health-care expenses, and excess burden on the criminal justice system (1).
The findings in this report are subject to at least three limitations. First, BRFSS data are self-reported. Alcohol consumption generally, and excessive drinking in particular, are underreported in surveys because of recall bias and social desirability bias (15). A recent study using BRFSS data found that self-reports identify only 22%–32% of presumed alcohol consumption in states, based on alcohol sales (16). Second, the dataset used for this analysis is developmental. The data collection and weighting methods used for the dataset are subject to change. In the developmental dataset, cellular telephone surveys accounted for less than 10% of the final BRFSS sample, these surveys were not conducted at all in two states (South Dakota and Tennessee), and the response rate for the developmental dataset was not available. However, the inclusion of cellular telephone respondents in this study substantially increased BRFSS participation among younger age groups (e.g., persons aged 18–24 years) who are known to be at higher risk for binge drinking (10,12). Finally, BRFSS does not collect information from persons living in institutional settings (e.g., on college campuses or in the military), so BRFSS data might not be representative of these populations.
The Community Preventive Services Task Force has recommended several population-level, evidence-based strategies to reduce binge drinking and related harms (17). These include 1) limiting alcohol outlet density, 2) holding alcohol retailers liable for harms related to the sale of alcoholic beverages to minors and intoxicated patrons (dram shop liability), 3) maintaining existing limits on the days and hours when alcohol is sold, 4) measures increasing the price of alcohol, and 5) avoiding further privatization of alcohol sales in states with government-operated or contracted liquor stores. Alcohol consumption is particularly sensitive to the price of alcoholic beverages. Across alcohol beverage types (i.e., beer, wine, and liquor), the median price elasticity (a measure of the relationship between price and consumption) ranges from -0.50 for beer to -0.79 for spirits, and the overall price elasticity for ethanol is -0.77 (18). Thus, a 10% increase in the price of alcoholic beverages likely would reduce overall consumption by more than 7%. Recent analyses also note a substantial gap between the societal and governmental cost of excessive alcohol consumption (approximately $1.90 and $0.80 per drink, respectively) (1) and the total federal and state taxes on alcoholic beverages (approximately $0.12 per drink) (1). The societal or the governmental costs of excessive drinking include lost productivity, health-care costs, and criminal justice expenses. The findings of this report also support the need to monitor and reduce the prevalence, frequency, and intensity of binge drinking (19), and to evaluate the impact of evidence-based strategies to prevent it.
Reported by
Dafna Kanny, PhD, Yong Liu, MS, Robert D. Brewer, MD, Div of Adult and Community Health, National Center for Chronic Disease Prevention and Health Promotion; William S. Garvin, Lina Balluz, ScD, Div of Behavioral Surveillance, Office of Surveillance, Epidemiology, and Laboratory Svcs, CDC. Corresponding contributor: Dafna Kanny, dkanny@cdc.gov, 770-488-5411.
Acknowledgment
James B. Holt, PhD, Div of Adult and Community Health, National Center for Chronic Disease Prevention and Health Promotion, CDC.
References
- Bouchery EE, Harwood HJ, Sacks JJ, Simon CJ, Brewer RD. Economic costs of excessive alcohol consumption in the United States, 2006. Am J Prev Med 2011;41:516–24.
- CDC. Alcohol-attributable deaths and years of potential life lost, United States, 2001. MMWR 2004;53:866–70.
- National Institute of Alcohol Abuse and Alcoholism. Tenth special report to the U.S. Congress on alcohol and health. Bethesda, MD: National Institute of Health; 2000.
- CDC. Alcohol-impaired driving among adults—United States, 2010. MMWR 2011;60:1351–6.
- Naimi TS, Brewer RD, Mokdad A, Denny C, Serdula MK, Marks JS. Binge drinking among US adults. JAMA 2003;289:70–5.
- Office of Juvenile Justice and Delinquency Prevention. Drinking in America: myths, realities, and prevention policy. Washington, DC: US Department of Justice, Office of Justice Programs, Office of Juvenile Justice and Delinquency Prevention; 2005. Available at http://www.udetc.org/documents/drinking_in_america.pdf. Accessed November 17, 2011.
- Woerle S, Roeber J, Landen MG. Prevalence of alcohol dependence among excessive drinkers in New Mexico. Alcohol Clin Exp Res 2007;31:293–98.
- US Department of Health and Human Services. SA–14.3 Reduce the proportion of persons engaging in binge drinking during the past 30 days—adults aged 18 years and older. Healthy People 2020. Washington, DC: US Department of Health and Human Services; 2011. Available at http://healthypeople.gov/2020/lhi/substanceabuse.aspx. Accessed November 17, 2011.
- Battaglia MP, Frankel MR, Link MW. Improving standard poststratification techniques for random-digit-dialing telephone surveys. Survey Res Methods 2008;2:11–9.
- CDC. Vital signs: binge drinking among high school students and adults—United States, 2009. MMWR 2010;59:1274–9.
- Blumberg SJ, Luke JV. Wireless substitution: early release of estimates from the National Health Interview Survey, July–December 2010. Hyattsville, MD: US Department of Health and Human Services, CDC, National Center for Health Statistics; 2011. Available at http://www.cdc.gov/nchs/data/nhis/earlyrelease/wireless201106.pdf. Accessed November 17, 2011.
- Hu SS, Balluz L, Battaglia MP, Frankel MR. Improving public health surveillance using a dual-frame survey of landline and cellular telephone numbers. Am J Epidemiol. 2011;173:703–11.
- National Institute on Alcohol Abuse and Alcoholism. Alcohol Policy Information System. Rockville, MD: US Department of Health and Human Services, National Institutes of Health; 2011. Available at http://www.alcoholpolicy.niaaa.nih.gov. Accessed November 17, 2011.
- Holt JB, Miller JW, Naimi TS, Sui DZ. Religious affiliation and alcohol consumption in the United States. Geographical Review 2006;96:523–42.
- Stockwell T, Donath S, Cooper-Stanbury M, Chikritzhs T, Catalano P, Mateo C. Under-reporting of alcohol consumption in household surveys: a comparison of quantity-frequency, graduated-frequency and recent recall. Addiction 2004;99:1024–33.
- Nelson DE, Naimi TS, Brewer RD, Roeber J. U.S. state alcohol sales compared to survey data, 1993–2006. Addiction 2010;105:1589–96.
- Task Force on Community Prevention Services. Preventing excessive alcohol consumption. In: The guide to community preventive services. New York, NY: Oxford University Press; 2005. Available at http://www.thecommunityguide.org/alcohol/index.html. Accessed November 22, 2011.
- Elder RW, Lawrence B, Ferguson A, et al.; Task Force on Community Preventive Services. The effectiveness of tax policy interventions for reducing excessive alcohol consumption and related harms. Am J Prev Med 2010;38:217–29.
- Naimi TS, Nelson DE, Brewer RD. The intensity of binge alcohol consumption among U.S. adults. Am J Prev Med 2010;38:201–7.
* Excessive alcohol use includes binge drinking (defined by CDC as consuming four or more drinks per occasion for women or five or more drinks per occasion for men), heavy drinking (defined as consuming more than one drink per day on average for women or more than two drinks per day on average for men), any alcohol consumption by pregnant women, and any alcohol consumption by youths aged <21 years.
† YPLL for 2001–2005 were estimated using the Alcohol-Related Disease Impact (ARDI) application using death and life expectancy data from the National Vital Statistics System. Additional information is available at http://apps.nccd.cdc.gov/dach_ardi/default/default.aspx.
§ The 2010 BRFSS developmental dataset included combined landline and cellular telephone–only adults and used the raking method for weighting.
¶ In 2012, BRFSS will release its 2011 BRFSS dataset including larger number of cellular telephone respondents and will be changing its procedures for data weighting.
** With the raking process, BRFSS data are weighted to the age, sex, race, educational, and marital status of each state's adult population and to the respondent's probability of selection. Raking also includes adjustment for cellular telephone only, landline only, and both cellular telephone and landline use based on respondents' telephone ownership.
†† The BRFSS 2010 questionnaire, which includes five questions about alcohol consumption, is available at http://www.cdc.gov/brfss/questionnaires/pdf-ques/2010brfss.pdf.
§§ The response rate is the percentage of persons who completed interviews among all eligible persons, including those who were not contacted successfully. The cooperation rate is the percentage of persons who completed interviews among all eligible persons who were contacted.
|
Key Points |
|
FIGURE 1. Prevalence* of binge drinking among adults — Behavioral Risk Factor Surveillance System combined landline and cellular telephone developmental dataset, United States, 2010
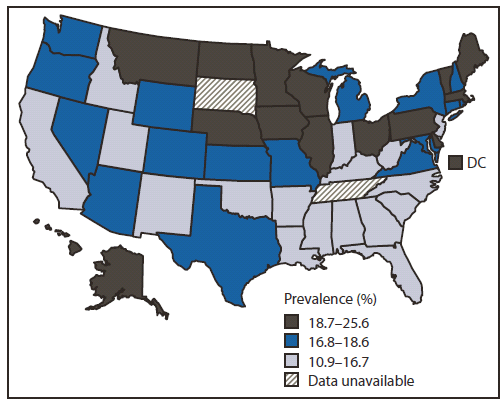
* Age-adjusted to the 2000 U.S. Census standard population.
Alternate Text: The figure above shows the prevalence of binge drinking among adults in the United States during 2010, as determined from the Behavioral Risk Factor Surveillance System combined landline and cellular telephone developmental dataset. Overall, states with the highest age-adjusted prevalence of adult binge drinking were in the Midwest and New England, and included the District of Columbia, Alaska, and Hawaii.
FIGURE 2. Intensity* of binge drinking among adults† — Behavioral Risk Factor Surveillance System combined landline and cellular telephone developmental dataset, United States, 2010
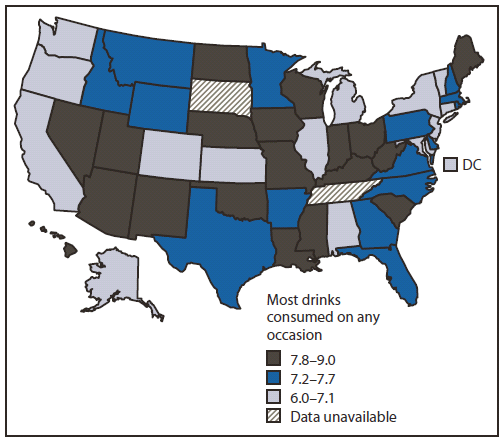
* Average largest number of drinks consumed by binge drinkers on any occasion in the past month.
† Age-adjusted to the 2000 U.S. Census standard population.
Alternate Text: The figure above shows the intensity of binge drinking among adults in the United States during 2010, as determined from the Behavioral Risk Factor Surveillance System combined landline and cellular telephone developmental dataset. States with the highest intensity of adult binge drinking generally were located in the southern Mountain states and Midwest, and included some states (e.g., Louisiana, Mississippi, New Mexico, South Carolina, and Utah) that had a lower prevalence of binge drinking.
Use of trade names and commercial sources is for identification only and does not imply endorsement by the U.S. Department of
Health and Human Services. |
All MMWR HTML versions of articles are electronic conversions from typeset documents.
This conversion might result in character translation or format errors in the HTML version.
Users are referred to the electronic PDF version (http://www.cdc.gov/mmwr)
and/or the original MMWR paper copy for printable versions of official text, figures, and tables.
An original paper copy of this issue can be obtained from the Superintendent of Documents, U.S.
Government Printing Office (GPO), Washington, DC 20402-9371;
telephone: (202) 512-1800. Contact GPO for current prices.
**Questions or messages regarding errors in formatting should be addressed to
mmwrq@cdc.gov.
