Vital Signs: Current Cigarette Smoking Among Adults Aged ≥18 Years --- United States, 2005--2010
Abstract
Background: Tobacco use remains the leading cause of preventable morbidity and mortality in the United States.
Methods: The 2005--2010 National Health Interview Surveys and the 2010 Behavioral Risk Factor Surveillance System survey were used to estimate national and state adult smoking prevalence, respectively. Current cigarette smokers were defined as adults aged ≥18 years who reported having smoked ≥100 cigarettes during their lifetime and who now smoke every day or some days.
Results: In 2010, 19.3% of U.S. adults were current cigarette smokers. Higher smoking prevalence was observed in the Midwest (21.8%) and South (21.0%). From 2005 to 2010, the proportion of smokers declined from 20.9% to 19.3% (p<0.05 for trend), representing approximately 3 million fewer smokers in 2010 than would have existed had prevalence not declined since 2005. The proportion of daily smokers who smoked one to nine cigarettes per day (CPD) increased from 16.4% to 21.8% during 2005--2010 (p<0.05 for trend), whereas the proportion who smoked ≥30 CPD decreased from 12.7% to 8.3% (p<0.05 for trend).
Conclusions: During 2005--2010, an overall decrease was observed in the prevalence of cigarette smoking among adults; however, the amount and direction of change has not been consistent year-to-year.
Implications for Public Health Practice: Enhanced efforts are needed to accelerate the decline in cigarette smoking among adults. Population-based prevention strategies, such as tobacco taxes, media campaigns, and smoke-free policies, in concert with clinical cessation interventions, can help decrease cigarette smoking and reduce the health burden and economic impact of tobacco-related diseases in the United States.
Introduction
Tobacco use remains the single largest preventable cause of death and disease in the United States. The health consequences of tobacco use include heart disease, multiple types of cancer, pulmonary disease, adverse reproductive effects, and the exacerbation of chronic health conditions (1). Each year, approximately 443,000 persons in the United States die from smoking-related illnesses. In addition, smoking has been estimated to cost the United States $96 billion in direct medical expenses and $97 billion in lost productivity each year (2).
Monitoring tobacco use provides important information about the extent of tobacco use and helps to guide decisions about tobacco control strategies for the overall population and its subgroups.* To assess recent progress toward achieving the Healthy People 2020 objective to reduce the national prevalence of current cigarette smoking to ≤12.0% (objective TU-1),† this report provides national and state-level estimates from the 2005--2010 National Health Interview Surveys (NHIS) and 2010 Behavioral Risk Factor Surveillance System (BRFSS) survey, respectively.
Methods
The NHIS is administered to a nationally representative random probability sample of noninstitutionalized, civilian U.S. adults aged ≥18 years. The 2010 NHIS included 27,157 respondents, of whom a total of 190 were excluded because of unknown smoking status. In 2010, the overall response rate was 60.8%; response rates for prior NHIS survey years have been reported previously.§ BRFSS is a state-based, random-digit--dialed telephone survey of noninstitutionalized, civilian U.S. adults aged ≥18 years; in 2010, the Council of American Survey and Research Organizations (CASRO) median response rate was 54.6% (ranging from 39.1% in Oregon to 68.8% in Nebraska), and the median cooperation rate was 76.9% (ranging from 56.8% in California to 86.1% in Minnesota).¶
For both surveys, current cigarette smokers were defined as respondents who had smoked ≥100 cigarettes during their lifetime and responded "every day" or "some days" to the question, "Do you now smoke cigarettes every day, some days, or not at all?" Overall and sex-specific estimates of current smoking and number of cigarettes smoked per day (CPD) were determined by age, race/ethnicity, education, poverty status, and U.S. census region. Poverty status was defined using 2009 poverty thresholds published by the U.S. Census Bureau.
NHIS data were adjusted for nonresponse and weighted to provide national smoking prevalence estimates; 95% confidence intervals that account for the survey's multistage probability sample design were calculated. NHIS results with relative standard error of ≥30% are not reported. Statistical significance of observed differences was assessed using 95% confidence intervals. Data from BRFSS were weighted to adjust for the differential probability of both selection and response.
Using NHIS data, logistic regression was used to analyze temporal changes in national smoking prevalence and CPD (among daily smokers) during 2005--2010, overall and by age, race/ethnicity, education, poverty status, and U.S. census region. These 6-year linear trend analyses were constructed using 2005 as the baseline to enable comparability with previous national trend estimates (3); results were adjusted for sex, age, and race/ethnicity, and the Wald test was used to determine statistical significance (defined as p<0.05).
Direct standardization was used to determine the population impact of the decline in smoking prevalence during 2005--2010. After adjustment for population changes in sex, age, and race/ethnicity, the difference in smoking prevalence from 2005 to 2010 was applied to 2010 U.S. census data to determine the number of additional smokers that would have existed in 2010 had prevalence not declined since 2005.
Results
In 2010, an estimated 19.3% (45.3 million) of U.S. adults were current cigarette smokers; of these, 78.2% (35.4 million) smoked every day, and 21.8% (9.9 million) smoked some days. Prevalence was higher among men (21.5%) than women (17.3%) (Table). Adults aged 25--44 years (22.0%) and 45--64 years (21.1%) had the highest prevalences among age groups. Among racial/ethnic populations, non-Hispanic American Indians/Alaska Natives had the highest prevalence (31.4%), followed by non-Hispanic whites (21.0%) and non-Hispanic blacks (20.6%). Smoking prevalence generally decreased with increasing education and was higher among adults living below the poverty level (28.9%) than among those at or above the poverty level (18.3%). By region, prevalence was highest in the Midwest (21.8%) and South (21.0%) and lowest in the West (15.9%).** By state, smoking prevalence was lowest in Utah (9.1%) and California (12.1%) and highest in West Virginia (26.8%) and Kentucky (24.8%) (Figure 1).
During 2005--2010, the overall proportion of U.S. adults who were current smokers declined from 20.9% to 19.3% (p<0.05 for trend) (Table), representing approximately 3 million fewer smokers in 2010 than would have existed had prevalence not declined since 2005. However, this decline in prevalence was not uniform across the population; statistically significant reductions were observed only among persons aged 18--24 years or 25--44 years, Hispanics and non-Hispanic Asians, those living at or above the poverty level, and those living in the Northeast or Midwest (p<0.05 for trend). No population group experienced a significant increase in smoking prevalence during 2005--2010.
The mean number of CPD among daily smokers was 16.7 in 2005 and 15.1 in 2010. During 2005--2010, the proportion of daily smokers who smoked one to nine CPD increased from 16.4% to 21.8% (p<0.05 for trend), whereas the proportion who smoked ≥30 CPD declined from 12.7% to 8.3% (p<0.05 for trend) (Figure 2).
Conclusions and Comment
The prevalence of current cigarette smoking among U.S. adults aged ≥18 years declined slightly during 2005--2010, representing approximately 3 million fewer smokers than would have existed had the prevalence continued at the 2005 level. During the same period, an increase was observed in the proportion of daily smokers who smoked one to nine CPD, whereas a corresponding decrease was observed in the proportion who smoked ≥30 CPD. However, cigarette smoking remains widespread; in 2010, approximately one in five U.S. adults (19.3%) were current smokers. Moreover, year-to-year decreases in smoking prevalence have been observed only sporadically in recent years; for example, a slight decrease occurred from 2006 to 2007 but not from 2007 to 2008 (4). If current patterns continue, smoking prevalence is projected to fall to approximately 17% in 2020 (5), and the national Healthy People objective to reduce smoking prevalence to ≤12% will not be met.
Fuller implementation of evidence-based interventions is needed to accelerate progress toward achieving the Healthy People 2020 objective (6). The World Health Organization has identified specific tobacco control interventions as "best buys" (i.e., cost-effective population-based strategies) to enhance public health.†† These strategies include increasing the price of tobacco products, implementing smoke-free laws in workplaces and public places, warning about the dangers of tobacco use, and enforcing restrictions on tobacco advertising, promotion, and sponsorship. Sustained implementation of these strategies, in addition to universal access to affordable and effective cessation interventions, would help reduce the national prevalence of tobacco use (6).
Despite an overall decline in smoking during 2005--2010, the findings in this report indicate that previously described variations in smoking prevalence persist (3), particularly by race/ethnicity, education, income, and region; thus, interventions focused on reducing tobacco-related disparities remain necessary (6). Although smoking prevalence was found to be lowest among Hispanics and non-Hispanic Asians, previous research indicates that wide variability in smoking prevalence exists among Hispanic and Asian subpopulations (7). In addition, the decline in smoking prevalence observed during 2005--2010 was not uniform across the population, and most subgroups will not meet the Healthy People 2020 target if current trends continue. Although prevalence declined among persons aged 18--44 years during 2005--2010, the reduction was modest when compared with previous declines observed among this age group (4). The slowing in the decline among younger adults is consistent with concurrent trends observed among youths§§ and indicates that smoking among adults will remain an important public health issue for the foreseeable future unless effective tobacco control strategies are fully implemented and sustained.
During 2009--2010, major advances were made in tobacco control. The 2009 Family Smoking Prevention and Tobacco Control Act¶¶ gives the Food and Drug Administration authority to regulate the manufacture, distribution, and marketing of tobacco products. In addition, the Patient Protection and Affordable Care Act*** provides expanded coverage for evidence-based smoking-cessation treatments for many persons in the United States. Finally, the Children's Health Insurance Program Reauthorization Act of 2009††† raised the federal tax rate for cigarettes from $0.39 to $1.01 per pack. Increasing the price of cigarettes can prevent initiation among nonsmokers and reduce cigarette consumption, particularly among youths and low-income smokers (8).
Changes observed in CPD among daily smokers during 2005--2010 are consistent with previously reported national declines in cigarette consumption (9). The reasons for this shift are unknown, but might be attributed to the proliferation of smoke-free environments (10), greater public awareness of the dangers of smoking (11), and increased cigarette prices (8). However, even light and intermittent smoking is associated with premature mortality (12), and significant health benefits to smokers from reducing the amount smoked have not been demonstrated (1). No amount of smoking is safe, and the best option for any smoker is to quit completely (1). Cessation advice and assistance using proven methods should be offered to all smokers.§§§
The findings in this report are subject to at least six limitations. First, estimates of smoking were self-reported and not validated by biochemical tests. Although studies of self-reported smoking might yield lower prevalence estimates than studies of serum cotinine (a breakdown product of nicotine) (13), it is unlikely that the degree of any underreporting would have changed meaningfully since 2005; thus, underreporting is unlikely to have affected the trends described in this report. Second, questionnaires were administered only in English and Spanish, which might have resulted in imprecise estimates for racial/ethnic populations unable to respond to the survey because of language barriers. Similarly, small samples sizes for certain population groups resulted in less precise estimates. Fourth, neither NHIS nor BRFSS include institutionalized populations and persons in the military, which prevents the generalizability of the results to these groups. Fifth, the 2010 BRFSS data analyzed in this report did not include adults without telephone service (1.7%) or with wireless-only service (24.9%) (14); because adults with wireless-only service are more likely to smoke cigarettes than the rest of the U.S. population (14), state smoking prevalences are likely to be underestimated. However, this limitation did not affect national estimates or trends because they are based on NHIS, which uses household-based sampling. Finally, the 2010 NHIS response rate was 60.8%, and the median response rate for the 2010 BRFSS was 54.6%. Lower response rates increase the potential for bias; however, national estimates from state-aggregated BRFSS data have been shown to be comparable to estimates from NHIS and other surveys with higher response rates (15).
Sustained, adequately funded, comprehensive state tobacco control programs accelerate progress toward reducing the health burden and economic impact of tobacco-related diseases in the United States (6). States that invest more fully in comprehensive tobacco control programs have seen larger declines in cigarette sales than the United States as a whole, and smoking prevalence among adults and youths has declined faster as spending for tobacco control programs has increased (6). California's adult smoking prevalence declined approximately 40% during 1998--2006. Similarly, Maine, New York, and Washington have seen 45%--60% reductions in youth smoking with sustained comprehensive statewide programs (6). CDC recommended appropriate annual funding levels for each state comprehensive tobacco control program in 2007 (6). However, in 2010, only North Dakota funded tobacco control programs at this level, whereas 28 states provided less than 25% of CDC-recommended amounts (CDC, unpublished data, 2011). Full implementation of comprehensive tobacco control policies and programs at CDC-recommended funding levels would result in a substantial reduction in tobacco-related morbidity and mortality and billions of dollars in savings from averted medical costs and lost productivity (2,6).
Reported by
Brian King, PhD, Shanta Dube, PhD, Rachel Kaufmann, PhD, Lauren Shaw, MS , Terry Pechacek, PhD, Office on Smoking and Health, National Center for Chronic Disease Prevention and Health Promotion, CDC. Corresponding contributor: Brian King, baking@cdc.gov, 770-488-5107.
Acknowledgments
National Center for Health Statistics, Public Health Surveillance Program Office, CDC.
References
- US Department of Health and Human Services. How tobacco smoke causes disease: the biology and behavioral basis for smoking-attributable disease: a report of the Surgeon General. Atlanta, GA: US Department of Health and Human Services, CDC; 2010. Available at http://www.cdc.gov/tobacco/data_statistics/sgr/2010/index.htm. Accessed August 4, 2011.
- CDC. Smoking-attributable mortality, years of potential life lost, and productivity losses---United States, 2000--2004. MMWR 2008;57:1226--8.
- CDC. Vital Signs: current cigarette smoking among adults aged ≥18 years---United States, 2009. MMWR 2010;59:1135--40.
- CDC. Cigarette smoking among adults and trends in smoking cessation---United States, 2008. MMWR 2009;58:1227--32.
- Mendez D, Warner KE. Setting a challenging yet realistic smoking prevalence target for Healthy People 2020: learning from the California experience. Am J Public Health 2008;98:556--9.
- CDC. Best practices for comprehensive tobacco control programs---2007. Atlanta, GA: US Department of Health and Human Services, CDC; 2007. Available at http://www.cdc.gov/tobacco/stateandcommunity/best_practices/index.htm. Accessed August 4, 2011.
- Caraballo RS, Yee SL, Gfroerer J, Mirza SA. Adult tobacco use among racial and ethnic groups living in the United States, 2002--2005. Prev Chronic Dis 2008;5:1--9.
- CDC. Federal and state cigarette excise taxes---United States, 1995--2009. MMWR 2009;58:524--7.
- Pierce JP, White MM, Messer K. Changing age-specific patterns of cigarette consumption in the United States, 1992--2002: association with smoke-free homes and state-level tobacco control activity. Nicotine Tob Res 2009;11:171--7.
- CDC. State smoke-free laws for worksites, restaurants, and bars---United States, 2000--2010. MMWR 2011;60:472--5.
- World Health Organization. WHO report on the global tobacco epidemic, 2011: warning about the dangers of tobacco. Geneva, Switzerland: World Health Organization; 2011. Available at http://whqlibdoc.who.int/publications/2011/9789240687813_eng.pdf. Accessed August 4, 2011.
- Schane RE, Ling PM, Glantz SA. Health effects of light and intermittent smoking: a review. Circulation 2010;121:1518--22.
- Gorber SC, Schofield-Hurwitz S, Hardt J, Levasseur G, Tremblay M. The accuracy of self-reported smoking: a systematic review of the relationship between self-reported and cotinine-assessed smoking status. Nicotine Tob Res 2009;11:12--24.
- Blumberg SJ, Luke JV. Wireless substitution: early release of estimates from the National Health Interview Survey, January--June 2010. Hyattsville, MD: US Department of Health and Human Services, CDC, National Center for Health Statistics; 2010. Available at http://www.cdc.gov/nchs/data/nhis/earlyrelease/wireless201012.htm. Accessed August 4, 2011.
- Nelson DE, Holtzman D, Bolen J, Stanwyck CA, Mack KA. Reliability and validity of measures from the Behavioral Risk Factor Surveillance System (BRFSS). Social Prev Med 2001;46:S3--42.
* Additional information available at: http://www.who.int/tobacco/mpower/mpower_report_full_2008.pdf.
† Additional information available at http://healthypeople.gov/2020/topicsobjectives2020.
§ Additional information available at http://www.cdc.gov/nchs/nhis/quest_data_related_1997_forward.htm.
¶ Based on CASRO definitions. The response rate is the percentage of persons who completed interviews among all eligible persons, including those who were not successfully contacted. The cooperation rate is the percentage of persons who completed interviews among all eligible persons who were contacted.
** Northeast: Connecticut, Maine, Massachusetts, New Hampshire, New Jersey, New York, Pennsylvania, Rhode Island, and Vermont. Midwest: Illinois, Indiana, Iowa, Kansas, Michigan, Minnesota, Missouri, Nebraska, North Dakota, Ohio, South Dakota, and Wisconsin. South: Alabama, Arkansas, Delaware, District of Columbia, Florida, Georgia, Kentucky, Louisiana, Maryland, Mississippi, North Carolina, Oklahoma, South Carolina, Tennessee, Texas, Virginia, and West Virginia. West: Alaska, Arizona, California, Colorado, Hawaii, Idaho, Montana, Nevada, New Mexico, Oregon, Utah, Washington, and Wyoming.
†† Additional information available at http://whqlibdoc.who.int/publications/2011/9789240686458_eng.pdf.
§§ Additional information available at: http://www.cdc.gov/mmwr/preview/mmwrhtml/mm5926a1.htm.
¶¶ Additional information available at http://www.fda.gov/tobaccoproducts/default.htm.
*** Additional information available at http://www.dol.gov/ebsa/healthreform.
††† Additional information available at http://www.cms.gov/chipra.
§§§ Additional information available at http://www.surgeongeneral.gov/tobacco/treating_tobacco_use08.pdf.
|
Key Points |
|
FIGURE 1. Percentage of persons aged ≥18 years who were current cigarette smokers,* by state --- Behavioral Risk Factor Surveillance System, United States, 2010
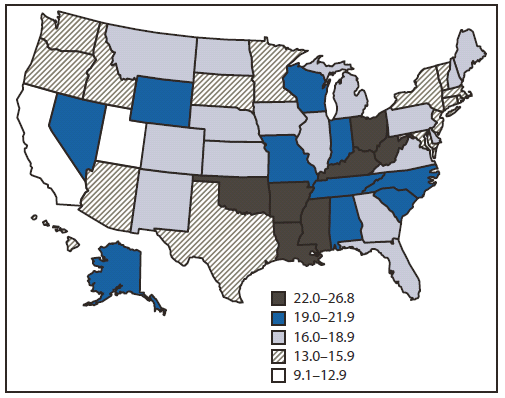
* Persons who reported smoking at least 100 cigarettes during their lifetime and who, at the time of the survey, reported smoking cigarettes every day or some days.
Alternate Text: The figure above shows the percentage of persons aged ≥18 years who were current cigarette smokers, by state, in the United States in 2010, based on data from the Behavioral Risk Factor Surveillance System. Smoking prevalence was lowest in Utah (9.1%) and California (12.1%) and highest in West Virginia (26.8%) and Kentucky (24.8%).
FIGURE 2. Percentage of daily smokers* aged ≥18 years, by number of cigarettes smoked per day (CPD) and year --- National Health Interview Survey, United States, 2005--2010
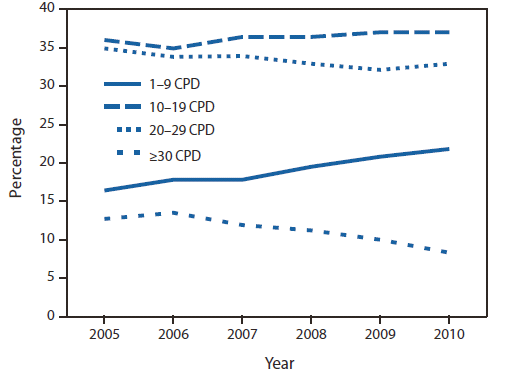
* Persons who reported smoking at least 100 cigarettes during their lifetime and who, at the time of the survey, reported smoking cigarettes every day.
Alternate Text: The figure above shows the percentage of daily smokers aged ≥18 years, by number of cigarettes smoked per day and year, in the United States during 2005-2010, based on data from the National Health Interview Survey.
Use of trade names and commercial sources is for identification only and does not imply endorsement by the U.S. Department of
Health and Human Services. |
All MMWR HTML versions of articles are electronic conversions from typeset documents.
This conversion might result in character translation or format errors in the HTML version.
Users are referred to the electronic PDF version (http://www.cdc.gov/mmwr)
and/or the original MMWR paper copy for printable versions of official text, figures, and tables.
An original paper copy of this issue can be obtained from the Superintendent of Documents, U.S.
Government Printing Office (GPO), Washington, DC 20402-9371;
telephone: (202) 512-1800. Contact GPO for current prices.
**Questions or messages regarding errors in formatting should be addressed to
mmwrq@cdc.gov.
