FIGURE 1. Current asthma prevalence,* by age group,† sex, and race/ethnicity --- National Health Interview Survey, United States, 2001--2009
Vital Signs: Asthma Prevalence, Disease Characteristics, and Self-Management Education --- United States, 2001--2009
Abstract
Background: Most persons with asthma can be symptom-free if they receive appropriate medical care, use inhaled corticosteroids when prescribed, and modify their environment to reduce or eliminate exposure to allergens and irritants. This report reviews recent progress in managing asthma and reducing its prevalence in the United States.
Methods: CDC analyzed asthma data from the 2001--2009 National Health Interview Survey concerning children and adults, and from the 2001, 2005, and 2009 state-based Behavioral Risk Factor Surveillance System concerning adults.
Results: Among persons of all ages, the prevalence of asthma increased from 7.3% (20.3 million persons) in 2001 to 8.2% (24.6 million persons) in 2009, a 12.3% increase. Prevalence among children (persons aged <18 years) was 9.6%, and was highest among poor children (13.5%) and among non-Hispanic black children (17.0%). Prevalence among adults was 7.7%, and was greatest in women (9.7%) and in adults who were poor (10.6%). More uninsured persons with asthma than insured could not afford to buy prescription medications (40.3% versus 11.5%), and fewer uninsured persons reported seeing or talking with a primary-care physician (58.8% versus 85.6%) or specialist (19.5% versus 36.9%). Among persons with asthma, 34.2% reported being given a written asthma action plan, and 68.1% had been taught the appropriate response to symptoms of an asthma attack. Only about one third of children or adults were using long-term control medicine such as inhaled corticosteroids at the time of the survey.
Conclusions and Comment: Persons with asthma need to have access to health care and appropriate medications and use them. They also need to learn self-management skills and practice evidence-based interventions that reduce environmental risk factors.
Introduction
Asthma is a chronic respiratory disease that affects persons of all ages and is characterized by episodic and reversible attacks of wheezing, chest tightness, shortness of breath, and coughing (1). Although asthma cannot be cured at present, symptoms can be controlled with appropriate medical treatment, self-management education, and by avoiding exposure to environmental allergens and irritants that can trigger an attack (1,2). The most current evidence-based guidelines for the diagnosis and management of asthma were developed by an expert panel commissioned by the National Asthma Education and Prevention Program (NAEPP), coordinated by the National Heart, Lung, and Blood Institute of the National Institutes of Health (NIH) (2). The NAEPP guidelines focus on four key components of asthma care to improve the quality of care and health outcomes of persons with asthma: 1) assessment and monitoring, 2) patient education, 3) control of factors contributing to asthma severity, and 4) medical treatment. These guidelines indicated that, among other long-term control medications for asthma, inhaled corticosteroids were the most potent and consistently effective long-term control medication (2).
In the United States, national survey data indicate persistent demographic differences in asthma prevalence, with rates disproportionately greater among children, women, blacks, and those reporting income below the federal poverty level (FPL) (3--6). Although most persons with asthma can be free of symptoms with appropriate management, poor asthma control continues to be associated with increased emergency department visits, hospitalizations, and medical costs (2,7). The estimated total cost of asthma to society, including medical expenses ($50.1 billion per year), loss of productivity resulting from missed school or work days ($3.8 billion per year), and premature death ($2.1 billion per year) was $56 billion (2009 dollars) in 2007; a $3 billion (5.7%) increase from 2002. Medical expenses associated with asthma were $3,259 per person per year during 2002--2007 (7). This report updates U.S. asthma prevalence estimates and describes trends, disease characteristics, and self-management education status among persons who have asthma.
Methods
Data from the 2001--2009 National Health Interview Surveys (NHIS) were used to assess trends in asthma prevalence; details of the survey methodology are described elsewhere (8). Respondents were considered to have current asthma if they answered "yes" to both of the following questions: "Have you ever been told by a doctor or other health professional that [you/your child] had asthma?" and "Do [you/your child] still have asthma?" (4,5).
Data from the 2009 NHIS were used to estimate asthma prevalence by age, sex, race/ethnicity, income status, and U.S. Bureau of the Census geographic region. Data from the NHIS 2008 core survey were used to estimate asthma attack prevalence (the percentage of persons with at least one asthma attack in the preceding 12 months). Data from the NHIS 2008 asthma supplement were used to estimate the status of health, health insurance, and asthma self-management education among children (aged <18 years) and adults (aged ≥18 years). Data concerning children were obtained from an adult in the home who served as a proxy.
Data from the 2001, 2005, and 2009 Behavioral Risk Factor Surveillance System (BRFSS) surveys were used to estimate the state-specific asthma prevalence for adults; dissimilar question wording and weighting methodology precluded estimating prevalence from BRFSS for children (9). For the 2009 landline BRFSS sample, the median response rate was 52.5% (10).
Statistical software was used to account for the complex sample design, fit trends over time, and evaluate when changes in trends occurred. Data were weighted to either the state (BRFSS) or U.S. population (NHIS). Estimates for trend analysis were age-adjusted to the standard year 2000 population. Statistical significance was assumed if p<0.05 (by a nondirectional, two-tailed z-test).
Results
During 2001--2009, the proportion of persons of all ages with asthma in the United States increased significantly (12.3%), from 7.3% (20.3 million persons) to 8.2% (24.6 million persons). A rising trend in asthma prevalence was observed across all demographic groups studied (Figure 1). Prevalence increased significantly during 2001--2009 for children (8.7% to 9.6%), adults (6.9% to 7.7%), males (6.3% to 7.1%), females (8.3% to 9.2%), whites (7.2% to 7.8%), blacks (8.4% to 10.8%), and Hispanics (5.8% to 6.4%). Significant differences in prevalence by age, sex, and race/ethnicity persisted over the observed period (Figure 1). In examining subgroups, a rising trend in asthma prevalence was observed for non-Hispanic black children (11.4% to 17.0%), non-Hispanic white women (8.9% to 10.1%), and non-Hispanic black men (4.7% to 6.4%). In 2009, asthma prevalence was greater among children than adults (9.6% versus 7.7%), and was especially high among boys (11.3%) and non-Hispanic black children (17.0%). Prevalence among adults was greatest for women (9.7%) and adults who were poor (10.6%) (Table 1). In 2008, at least one half (52.6 %) of persons who had asthma reported having had an asthma attack in the preceding 12 months. A greater proportion of children were reported to have had an asthma attack than adults (57.2% versus 50.7%) in the preceding 12 months. A greater proportion of persons who had asthma reported being in fair or poor health (21.8%) than those who did not have asthma (9.3%). A greater proportion of persons who had an asthma attack reported being in fair or poor health (24.8%) than those who did not have an attack (17.9%) (Table 2).
In 2008, 41.8% (4.6 million) of persons who reported having an asthma attack missed ≥1 days of school or work because of asthma in the preceding 12 months. Persons with an asthma attack missed an average of 4.5 days of school or work per year, with 26.0% (3.2 million persons) reporting emergency department or urgent care center visits and 7.0% (850,183 persons) reporting having been admitted to a hospital. Thus, 13.6% (or nearly one in seven) of persons with asthma had an asthma attack that required urgent outpatient care.
Most persons with asthma had health insurance (89.0%) and had taken quick-relief inhaler prescription medicine (64.4%; 15 million persons) during the past 3 months. Long-term control (oral or inhaler) prescription medicine use, including use of corticosteroids at the time of the survey, was 33.5% (7.8 million persons). However, compared with those who had health insurance in the preceding 12 months, nearly four times the number of the uninsured persons with asthma were unable to buy prescription medication (40.3% versus 11.5%) and fewer reported seeing or talking with a primary care physician (58.8% versus 85.6%) or specialist (19.5% versus 36.9%) in the preceding 12 months.
Nearly 60% of persons who had asthma had been taught to recognize early signs and symptoms of an asthma attack, and 68.1% had been taught the appropriate response to it. However, fewer persons with asthma reported having a written action plan (34.2%), taking a class to learn how to manage their asthma (12.2%), or being taught how to use a peak flow meter (a portable device used to measure a person's ability to exhale) (42.2%). Approximately half (49.3%) of respondents with asthma had been advised to change conditions in their home, school, or work environments to reduce exposure to asthma triggers. More children with asthma and/or their caregivers had been taught how to recognize the early signs and symptoms of an asthma attack (72.1%), how to respond to an attack (78.3%), and how to use a peak flow meter (49.4%), compared with adults with asthma (54.8%, 63.8%, and 39.2%, respectively). Likewise, more children with asthma and/or their caregivers had received an asthma action plan (44.3%), and followed "most or all" advice about changing things in their home, school, or work environments (81.2%), compared with adults (29.9% and 51.6%, respectively) (Table 2).
Asthma prevalence among adults varied across states, ranging from 5.3% to 9.5% (median: 7.3%) in 2001, 5.9% to 10.7% (median: 8.0%) in 2005, and 6.3% to 11.1% (median: 8.8%) in 2009. Prevalence increased significantly from 2001 to 2009 in 22 states* and the District of Columbia (Figure 2). By U.S. Census Bureau region,† asthma prevalence was higher in the Northeast (9.3%) and Midwest (8.8%) than in the West (7.7%) and South (7.5%) (Table 1).
Conclusions and Comment
The prevalence and number of persons with asthma have increased since 2001, and demographic differences among population subgroups persist despite improvements in outdoor air quality and decreases in cigarette smoking and secondhand smoke exposure (11--13). Although probable causes for the increase in asthma are unclear, CDC's top priority is getting people to manage their asthma better. Asthma has been more prevalent among children than adults, women than men, and blacks than whites since 2001. Similar to findings in previous studies (3--6), in 2009, asthma was more prevalent among children, women, non-Hispanic blacks, the poor, and in the Northeast and Midwest. The cause of this variation remains unclear and might be the result of characteristics associated with asthma development and disease duration that were not examined in this study, including genetic predisposition, history of atopy (a genetic tendency to develop an allergic reaction), health risk factors (e.g., smoking, obesity), earlier diagnosis, socioeconomic status (e.g., education or occupation), and exposure to environmental allergens or irritants (e.g., mold, tobacco smoke, secondhand smoke exposure, pet dander, outdoor air pollution, and any upper respiratory infection, such as influenza or common cold) (1--3,5,6). In particular, obesity and exposure to tobacco smoke each have been associated with increased asthma severity (14,15). More detailed analytic investigation of these risk factors might help characterize subpopulations and identify those in greatest need of targeted prevention efforts.
Approximately half of persons with asthma in the United States reported having an asthma attack in the preceding 12 months. Those who had attacks had a higher proportion of missed school or work days, emergency department and urgent care visits, and reported fair or poor health. A greater percentage of persons with asthma reported having health-care insurance than persons without asthma. However, among persons with asthma, more of the uninsured were unable to buy prescription medication and fewer reported seeing or talking to a specialist or primary care physician about their asthma. This is a particular concern, given the value of inhaled corticosteroids in the management of adults and children with persistent asthma.
Asthma health outcomes can be improved by addressing gaps in health-care coverage and access, and by supporting preventive measures. In particular, patient education concerning self-management of the disease and its attacks is key. It is one of the four key components of effective asthma management listed in the NIH guidelines that were developed by NAEPP (2). Even so, such recommended educational activities were not reported widely and did not meet the Healthy People 2010 targets for objectives 24-6 and 24-7 (6,16). For example, the NAEPP expert panel recommends that every person with asthma have an asthma action plan, yet only one third of adults and children reported having such a plan. An asthma action plan is a written form developed by health-care providers to address the specific needs and circumstances of an individual patient. The plan describes 1) how to monitor symptoms, 2) when to change the amount or type of medication, 3) how to identify and avoid exposure to allergens and irritants, 4) how to recognize worsening asthma symptoms, and 5) when to take action, such as calling the physician for advice or going to the emergency department (2). Although multitrigger/multicomponent home-based environmental interventions are known to improve asthma symptoms (median decrease of 21 days with symptoms per year) and to reduce missed days of school among children (median decrease of 12 days per year), only half of children/caregivers were advised to change conditions at school, home, or work to reduce environmental triggers (17).
The findings in this report are subject to at least one limitation. NHIS and BRFSS data are based on adult self-report or adult proxy response for children; therefore, the findings might be biased as a result of inaccurate recall or the social desirability of providing positive responses.
The findings suggest the need for coordinated efforts at the local, state, and national levels to develop programs that empower persons with asthma to better control and manage their asthma. Health-care providers and public health officials should continue to address gaps in access to care and to support preventive measures that can improve asthma health outcomes by promoting appropriate medical care, asthma self-management education, and evidence-based interventions to reduce modifiable risk factors (e.g., environmental irritants and allergens) for asthma. Actions to expand reimbursement for asthma education and environmental control services might further improve the application of asthma self-management strategies.
Reported by
Hatice S. Zahran, MD, Cathy Bailey, MS, Paul Garbe, DVM, Div of Environmental Hazards and Health Effects, National Center for Environmental Health, CDC. Contributing correspondent: Hatice S. Zahran, CDC, 770-488-1509, hzahran@cdc.gov.
Acknowledgments
This report is based, in part, on contributions by M King, PhD, E Herman, MD, Div of Environmental Hazards and Health Effects, National Center for Environmental Health; and survey coordinators for the Behavioral Risk Factor Surveillance System and the National Health Interview Survey, National Center Health Statistics, CDC.
References
- Kliegman RM, Behrman RE, Jenson HB, Stanton BF. Nelson textbook of pediatrics. 18th ed. Philadelphia, PA: Saunders Elsevier; 2007.
- National Institutes of Health, National Heart, Lung, and Blood Institute. Expert panel report 3: guidelines for the diagnosis and management of asthma. Bethesda, MD: US Department of Health and Human Services, National Institutes of Health, National Heart, Lung, and Blood Institute; 2007. Available at http://www.nhlbi.nih.gov/guidelines/asthma/asthgdln.pdf. Accessed April 7, 2011.
- CDC. CDC health disparities and inequalities report---United States, 2001. MMWR 2011;60(Suppl).
- CDC. National Health Interview Survey (NHIS) data: 2008 lifetime and current asthma. Atlanta, GA: US Department of Health and Human Services, CDC; 2010. Available at http://www.cdc.gov/asthma/nhis/08/data.htm. Accessed April 7, 2011.
- CDC. National surveillance for asthma---United States, 1980--2004. MMWR 2007;56(No. SS-8).
- Akinbami LJ, Moorman JE, Liu X. Asthma prevalence, health care use, and mortality: United States, 2005--2009. National health statistics reports no. 32. Hyattsville, MD: National Center for Health Statistics; 2011.
- Barnett SBL, Nurmagambetov TA. Costs of asthma in the United States: 2002--2007. J Allergy Clin Immunol 2011;127:145--52.
- National Center for Health Statistics. National Health Interview Survey (NHIS) 2009 data release. Atlanta, GA: US Department of Health and Human Services, CDC, National Center for Health Statistics; 2010. Available at http://www.cdc.gov/nchs/nhis/nhis_2009_data_release.htm. Accessed April 7, 2011.
- CDC. BRFSS [Behavioral Risk Factor Surveillance System] annual survey data. Atlanta, Georgia: US Department of Health and Human Services, CDC; 2009. Available at http://www.cdc.gov/brfss. Accessed December 28, 2010.
- CDC. 2009 Behavioral Risk Factor Surveillance System summary data quality report. Atlanta, Georgia: US Department of Health and Human Services, CDC; 2011. Available at http://www.cdc.gov/brfss/technical_infodata/quality.htm. Accessed March 16, 2011.
- Environmental Protection Agency. Air quality trends. Washington, DC: Environmental Protection Agency; 2011. Available at http://www.epa.gov/airtrends/aqtrends.html#airquality. Accessed April 27, 2011.
- CDC. Cigarette smoking---United States, 1965--2008. MMWR 2011;60:109--13.
- CDC. Vital signs: nonsmokers' exposure to secondhand smoke---United States, 1999--2008. MMWR 2010;59:1141--6.
- Dixon, AE, Holguin F, Sood A, et al. An official American Thoracic Society workshop report: obesity and asthma. Proc Am Thorac Soc 2010;7:325--35.
- US Department of Health and Human Services. The health consequences of involuntary exposure to tobacco smoke: a report of the Surgeon General. Atlanta GA, 2006.
- US Department of Health and Human Services. Healthy people 2010: understanding and improving health. 2nd ed. Washington, DC: US Government Printing Office; 2000.
- Task Force on Community Prevention Services. Asthma control: home-based multi-trigger, multicomponent environmental interventions. In: Task Force on Community Prevention Services. The guide to community preventive services. New York, NY: Oxford University Press; 2005. Available at http://www.thecommunityguide.org/asthma/multicomponent.html. Accessed April 7, 2011.
* Arizona, Connecticut, Hawaii, Indiana, Kentucky, Maryland, Massachusetts, Mississippi, Nebraska, New Hampshire, New Jersey, New Mexico, New York, North Carolina, North Dakota, Ohio, Oklahoma, Oregon, Pennsylvania, South Dakota, Washington, and Wisconsin.
† Additional information available at http://www.census.gov/geo/www/us_regdiv.pdf.
|
Key Points |
|
* Includes persons who answered "yes" to the questions: "Have you ever been told by a doctor or other health professional that [you/your child] had asthma?" and "Do [you/your child] still have asthma?"
† Age-adjusted to the 2000 U.S. population, except age-group--specific estimates.
Alternate Text: The figure above shows the current asthma prevalence, by age group, sex, and race/ethnicity for the United States, according to the National Health Interview Survey. During 2001-2009, the proportion of persons of all ages with asthma in the United States increased significantly (12.3%), from 7.3% (20.3 million persons) to 8.2% (24.6 million persons). A rising trend in asthma prevalence was observed across all demographic groups studied.
|
TABLE 1. Prevalence of current asthma* among children and adults,† by selected characteristics --- National Health Interview Survey, United States, 2009 |
|||||||||
|---|---|---|---|---|---|---|---|---|---|
|
Characteristic |
Total (N = 38,815) |
Children (n = 11,129) |
Adults (n = 27,686) |
||||||
|
No. in sample |
(%§) |
(95% CI)§ |
No. in sample |
(%§) |
(95% CI)§ |
No. in sample |
(%§) |
(95% CI)§ |
|
|
Total |
38,815 |
(8.2) |
(7.8--8.6) |
11,129 |
(9.6) |
(8.9--10.4) |
27,686 |
(7.7) |
(7.3--8.1) |
|
Sex |
|||||||||
|
Male |
17,881 |
(7.0) |
(6.5--7.6) |
5,640 |
(11.3) |
(10.2--12.5) |
12,241 |
(5.5) |
(5.0--6.1) |
|
Female |
20,934 |
(9.3) |
(8.8--9.9) |
5,489 |
(7.9) |
(7.0--8.9) |
15,445 |
(9.7) |
(9.1--10.3) |
|
Race/Ethnicity |
|||||||||
|
White, non-Hispanic |
20,915 |
(8.1) |
(7.7--8.6) |
4,816 |
(8.5) |
(7.6--9.5) |
16,099 |
(8.1) |
(7.6--8.6) |
|
Black , non-Hispanic |
6,138 |
(11.1) |
(9.9--12.4) |
1,791 |
(17.0) |
(14.5--19.9) |
4,347 |
(8.7) |
(7.5--10.1) |
|
Hispanic |
8,579 |
(6.3) |
(5.6--7.1) |
3,420 |
(7.7) |
(6.5--9.2) |
5,159 |
(5.5) |
(4.7--6.4) |
|
Other race¶ |
3,183 |
(7.5) |
(6.2--9.0) |
1,102 |
(9.6 ) |
(7.5--12.2) |
2,081 |
(6.6) |
(5.3--8.4) |
|
Poverty threshold** |
|||||||||
|
Poor |
6,898 |
(11.6) |
(10.6--12.7) |
2,307 |
(13.5 ) |
(11.6--15.5) |
4,591 |
(10.6) |
(9.5--11.7) |
|
Near poor |
8,293 |
(8.5) |
(7.8--9.4) |
2,595 |
(9.5 ) |
(7.9--11.3) |
5,698 |
(8.1) |
(7.3--9.1) |
|
Not poor |
23,624 |
(7.3) |
(6.9--7.8) |
6,227 |
(8.3) |
(7.5--9.1) |
17,397 |
(7.0) |
(6.6--7.6) |
|
Region†† |
|||||||||
|
Northeast |
6,426 |
(9.3) |
(8.4--10.3) |
1,828 |
(11.1) |
(9.5--13.0) |
4,598 |
(8.7) |
(7.8--9.9) |
|
Midwest |
8,528 |
(8.8) |
(8.0--9.6) |
2,289 |
(10.9 ) |
(9.2--12.8) |
6,239 |
(8.1) |
(7.3--9.0) |
|
South |
14,163 |
(7.5) |
(6.9--8.1) |
4,024 |
(9.8 ) |
(8.7--11.0) |
10,139 |
(6.8) |
(6.2--7.4) |
|
West |
9,698 |
(7.7) |
(7.0--8.5) |
2,988 |
(7.1) |
(6.0--8.5) |
6,710 |
(7.9) |
(7.0--8.8) |
|
Abbreviation: CI = confidence interval. * Includes persons who answered "yes" to the questions: "Have you ever been told by a doctor or other health professional that [you/your child] had asthma?" and "Do [you/your child] still have asthma?" † Children aged <18 years; adults aged ≥18 years. § Weighted estimates. ¶ Includes American Indian/Alaska Native, Asian, Native Hawaiian/other Pacific Islander, and persons of multiple races. ** Poor = household income below the federal poverty level (FPL), near poor = 100% to <200% of the FPL, and nonpoor = ≥200% of the FPL. †† U.S. Census Bureau regions. Additional information available at http://www.census.gov/geo/www/us_regdiv.pdf. |
|||||||||
FIGURE 2. Current asthma prevalence among adults --- Behavioral Risk Factor Surveillance System, United States, 2001, 2005, and 2009*
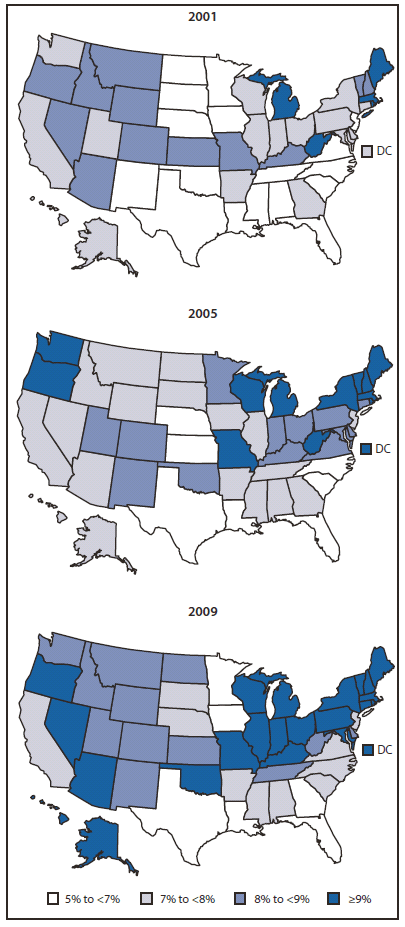
* Cut-off points are the approximate quartiles of the state-specific prevalence of asthma among adults during 2001, 2005, and 2009.
Alternate Text: The figure above shows current asthma prevalence among adults in the United States during 2001, 2005 and 2009, according to the Behavioral Risk Factor Surveillance System. Asthma prevalence among adults varied across states, ranging from 5.3% to 9.5% (median: 7.3%) in 2001, 5.9% to 10.7% (median: 8.0%) in 2005, and 6.3% to 11.1% (median: 8.8%) in 2009. Prevalence increased significantly from 2001 to 2009 in 22 states and the District of Columbia.
Use of trade names and commercial sources is for identification only and does not imply endorsement by the U.S. Department of
Health and Human Services. |
All MMWR HTML versions of articles are electronic conversions from typeset documents.
This conversion might result in character translation or format errors in the HTML version.
Users are referred to the electronic PDF version (http://www.cdc.gov/mmwr)
and/or the original MMWR paper copy for printable versions of official text, figures, and tables.
An original paper copy of this issue can be obtained from the Superintendent of Documents, U.S.
Government Printing Office (GPO), Washington, DC 20402-9371;
telephone: (202) 512-1800. Contact GPO for current prices.
**Questions or messages regarding errors in formatting should be addressed to
mmwrq@cdc.gov.
