What to know
- The following graphs show trends in invasive female breast cancer incidence by race and age group for 1999 to 2013.
- These graphs were produced as part of the analysis for an MMWR article
Trends in invasive female breast cancer incidence by age (in years), race, and year of diagnosis, United States, 1999–2013
These graphs were produced as part of the analysis for an article titled "Patterns and Trends in Age-Specific Black-White Differences in Breast Cancer Incidence and Mortality—United States, 1999–2014," published in MMWR on October 14, 2016, using data from population-based cancer registries participating in CDC's National Program of Cancer Registries or the National Cancer Institute's Surveillance, Epidemiology, and End Results Program. The following graphs show trends in invasive female breast cancer incidence by race and age group.
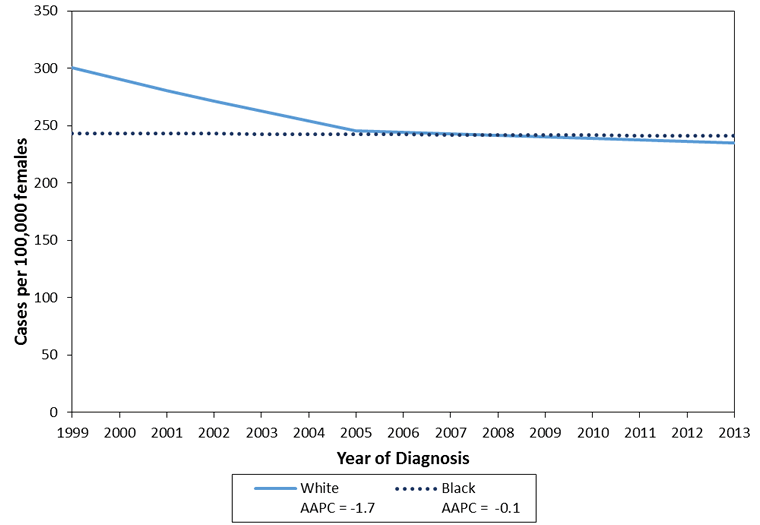
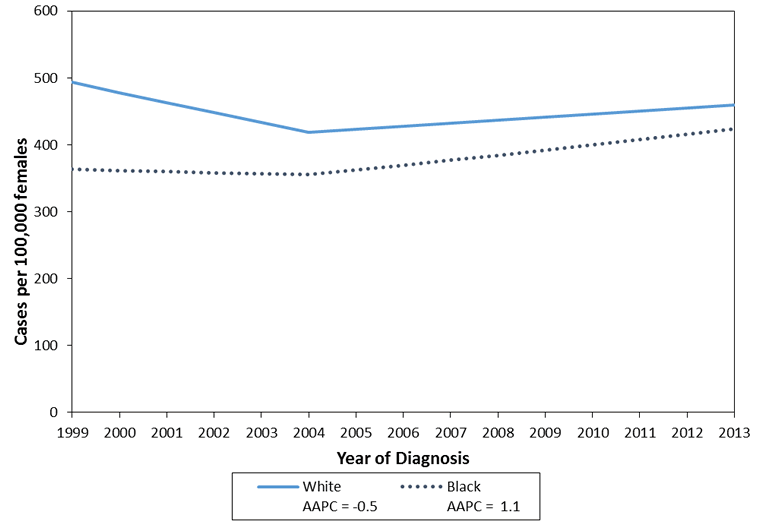
Note: Trends were measured with average annual percentage change (AAPC) in rates, calculated using joinpoint regression, which allowed different slopes for three periods; the year at which slopes changed could vary by age and race. Trends among Black women were significantly different (P<.05) than among White women except among women aged <50 years.
Data are compiled from cancer registries that meet the data quality criteria for all invasive cancer sites combined for all years 1999 to 2013 (covering approximately 92% of the US population). Registry-specific data quality information is available.
Trends in invasive female breast cancer incidence for women younger than 50 years, by race and year of diagnosis, United States, 1999 to 2013
Trends in invasive female breast cancer incidence for women between 50 and 59 years, by race and year of diagnosis, United States, 1999 to 2013
Trends in invasive female breast cancer incidence for women between 60 and 69 years, by race and year of diagnosis, United States, 1999 to 2013
Trends in invasive female breast cancer incidence for women between 70 and 79 years, by race and year of diagnosis, United States, 1999 to 2013
Trends in invasive female breast cancer incidence for women 80 years or older, by race and year of diagnosis, United States, 1999 to 2013
Page last reviewed: October 13, 2016