What to know
The 2022 Adult Obesity Prevalence Maps for 50 states, the District of Columbia (DC), and three U.S. territories show the proportion of adults with obesity. These maps are based on self-reported weight and height from the Behavioral Risk Factor Surveillance System (BRFSS). Maps are also presented by race/ethnicity and location. (Updated September 21, 2023)
Overview
The CDC 2022 Adult Obesity Prevalence Maps for 50 states, the District of Columbia, and 3 U.S. territories show the proportion of adults with a body mass index (BMI) equal to or greater than 30 ( ≥30 kg/m2) based on self-reported weight and height. Data are presented by race/ethnicity and location. The data come from the Behavioral Risk Factor Surveillance System, an ongoing state-based, telephone interview survey conducted by CDC and state health departments.
The 2022 maps show that obesity impacts some groups more than others. There are notable differences by race and ethnicity, as shown by combined data from 2020–2022. Read more about the maps and what can be done.
BMI
BMI Category
Below 18.5
Underweight
18.5–24.9
Healthy Weight
25.0–29.9
Overweight
30.0 and Above
Obesity
By Geography
Among geographic groups (states, territories, or DC) with enough data, the number with an adult obesity prevalence of 35% or higher, by race/ethnicity, is:
- Non-Hispanic Asian adults: 0 (among 37 states, 1 territory, and DC)
- Non-Hispanic White adults: 14 (among 49 states, 1 territory, and DC)
- Hispanic adults: 32 (among 49 states, 2 territories, and DC)
- Non-Hispanic American Indian or Alaska Native adults: 33 (among 47 states)
- Non-Hispanic Black adults: 38 (among 48 states and DC)
Across states and territories
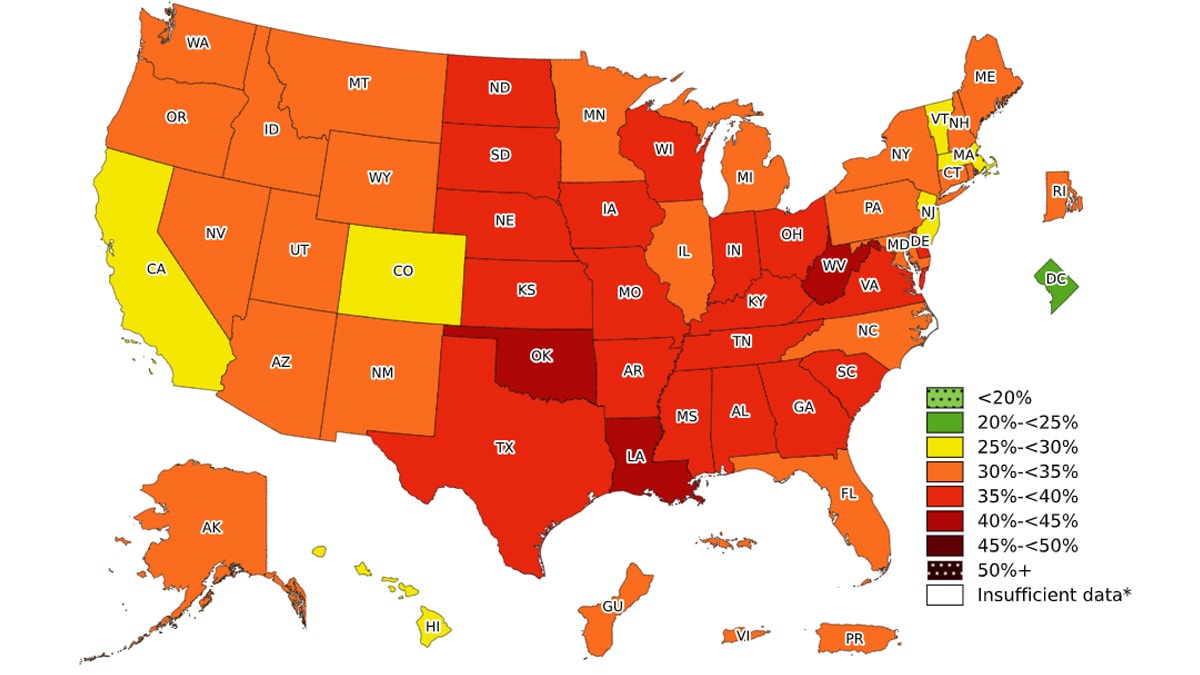
In 2022, all U.S. states and territories had an obesity prevalence higher than 20% (more than 1 in 5 adults). Overall, the Midwest (35.8%) and South (35.6%) had the highest prevalence of obesity, followed by the Northeast (30.5%) and West (29.5%).
- DC had an obesity prevalence between 20% and less than 25%.
- Six states had an obesity prevalence between 25% and less than 30%.
- 22 states, Guam, Puerto Rico, and the Virgin Islands had an obesity prevalence between 30% and less than 35%.
- 19 states had an obesity prevalence between 35% and less than 40%.
- Three states (Louisiana, Oklahoma, and West Virginia) had an obesity prevalence of 40% or greater.
By race and ethnicity
Combined BRFSS data from 2020–2022 show notable differences in adult obesity prevalence by race and ethnicity. Among states, territories, or DC with enough data, the number with an obesity prevalence of 35% or higher is:
- Non-Hispanic Asian adults: 0 (among 37 states, 1 territory, and DC)
- Non-Hispanic White adults: 14 (among 49 states, 1 territory, and DC)
- Hispanic adults: 32 (among 49 states, 2 territories, and DC)
- Non-Hispanic American Indian or Alaska Native adults: 33 (among 47 states)
- Non-Hispanic Black adults: 38 (among 48 states and DC)
By education level and age
In 2022, the prevalence of adult obesity decreased as education level increased.
- 37.6% of adults without a high school diploma or equivalent had obesity.
- 35.9% of adults with some college education had obesity.
- 27.2% of college graduates had obesity.
In 2022, young adults were half as likely to have obesity as middle-aged adults. Adults aged 18–24 years had the lowest prevalence of obesity (20.5%) while adults aged 45–54 years had the highest (39.9%).
Map: Overall Obesity

Source: Behavioral Risk Factor Surveillance System
*Sample size <50, the relative standard error (dividing the standard error by the prevalence) ≥30%, or no data in a specific year.
Map: Non-Hispanic Asian Adults

Source: Behavioral Risk Factor Surveillance System
*Sample size <50, the relative standard error (dividing the standard error by the prevalence) ≥30%, or no data in a specific year.
TABLE: Prevalence of Obesity Based on Self-Reported Weight and Height Among Non-Hispanic Asian Adults by State and Territory, BRFSS, 2020–2022.
Map: Non-Hispanic White Adults

Source: Behavioral Risk Factor Surveillance System
*Sample size <50, the relative standard error (dividing the standard error by the prevalence) ≥30%, or no data in a specific year.
TABLE: Prevalence of Obesity Based on Self-Reported Weight and Height Among Non-Hispanic White Adults by State and Territory, BRFSS, 2020–2022.
Map: Hispanic Adults

Source: Behavioral Risk Factor Surveillance System
*Sample size <50, the relative standard error (dividing the standard error by the prevalence) ≥30%, or no data in a specific year.
TABLE: Prevalence of Obesity Based on Self-Reported Weight and Height Among Hispanic Adults by State and Territory, BRFSS, 2020–2022.
Map: Non-Hispanic American Indian or Alaska Native Adults

Source: Behavioral Risk Factor Surveillance System
*Sample size <50, the relative standard error (dividing the standard error by the prevalence) ≥30%, or no data in a specific year.
TABLE: Prevalence of Obesity Based on Self-Reported Weight and Height Among Non-Hispanic American Indian or Alaska Native Adults, by State and Territory, BRFSS, 2020–2022
Map: Non-Hispanic Black Adults

Source: Behavioral Risk Factor Surveillance System
*Sample size <50, the relative standard error (dividing the standard error by the prevalence) ≥30%, or no data in a specific year.
TABLE: Prevalence of Obesity Based on Self-Reported Weight and Height Among Non-Hispanic Black Adults by State and Territory, BRFSS, 2020–2022.
Related Information
Media Statement
CDC's 2023 media statement about the Adult Obesity Prevalence Maps.
PLACES: Local Data for Better Health
Model-based population-level analysis and community estimates on obesity and other chronic disease factors for counties, census tracts, and ZIP Code Tabulation Areas (ZCTAs) across the United States.
Data, Trends, and Maps
Interactive tool that provides additional obesity prevalence estimates by state and territory, as well as nutrition and physical activity indicators.
Notes on Images and Language
Download maps
Adult Obesity Maps by State and Territory, 2011–2022
Adult Race/Ethnicity Obesity Maps by State and Territory, 2020–2022
Suggested citation
Centers for Disease Control and Prevention. Adult Obesity Prevalence Maps. U.S. Dept of Health and Human Services; 2022.