
Engineering Controls Database
Guidelines for the Control and Monitoring of Methane Gas on Continuous Mining Operations – Methane Monitoring – Measuring Methanometers Response Times
|
The introduction of conventional mining methods, which increased the rate of mining, was an important step in the mechanization of mining. The intermittent nature of the conventional mining process halted the extraction process for ore-loading and usually allowed time for methane gas to be dispersed. However, the introduction of continuous mining machines in the 1940s produced a constant flow of ore from the working face of the mine and resulted in an increase in methane levels. The number of face ignitions increased as more continuous mining machines were placed underground. Methane levels were found to be dangerously high. In some cases, methane concentrations measured 20 ft from the mining face exceeded the lower explosive limit (5% by volume) [USBM 1958]. The need for better face area ventilation was recognized to reduce the potential for explosions. |
|
|
Excessive levels of methane gas can affect the safety of the underground work force. Available methane control systems have been challenged in recent years by mining developments which include the use of continuous mining machines. Most mining accidents today generally involve only a few individuals. However, the infrequent occurrence of gas explosions puts the lives of the entire underground workforce at risk. In the past 10 years, explosions have led to 65 fatalities and 18 injuries with major explosions occurring at the Sago Mine in West Virginia in 2006 (12 fatalities and 1 injury), the Darby No. 1 Mine in Kentucky in 2006 (5 fatalities and 1 injury) and, most recently, at the Upper Big Branch Mine in West Virginia in 2010 (29 fatalities) [NIOSH 2011]. |
|
|
The U.S. Bureau of Mines (USBM) was formed in 1910 following a series of underground explosions that resulted in many fatalities and injuries [Kirk 1996]. The agency was responsible for conducting scientific research and disseminating information on the extraction, processing, use, and conservation of mineral resources. The USBM research program for mining health and safety was transferred to NIOSH in 1996. Since that time, NIOSH has established a ventilation test gallery where techniques for methane control and monitoring are evaluated under a variety of conditions that simulate airflow near the working face of a continuous mining section. Airflow patterns and methane concentrations are studied in a detailed manner that is not possible in a working underground mine. Effect of Water Sprays on Face Airflow and Methane Engineering controls such as water sprays and scrubbers help maintain safe methane levels in coal mines. Methane monitoring is required to ensure that engineering controls are effective and that methane concentrations do not exceed regulatory standards. NIOSH research examined instruments and sampling strategies used for methane sampling and developed methods for evaluating performance. The research included monitors using both catalytic heat of combustion and infrared absorption sensors. Measuring Methanometers Response Times Instrument response time is defined as the time interval between the application of a gas of uniform concentration (e.g., calibration gas) to the sensor head and the final steady state reading of the instrument. Since the sensor output approaches the final reading asymptotically, the 90% response time (time required for the instrument to read 90% of the final gas concentration) is often used to compare instrument performance. Currently there are no regulations regarding measurement of response times for instruments used in coal mines. While a mining machine is cutting coal, methane concentrations at the face can rise and fall rapidly. The methanometers should not only monitor methane levels accurately but also be able to respond quickly to changes in methane concentration. If the methanometer response time is slow, the actual concentrations may be higher than the indicated readings. NIOSH developed and tested two techniques for measuring methanometer response times for machine-mounted methane monitors [Taylor et al. 2002a, 2002b]. One response measurement technique was designed for use underground. It requires only a stop watch and equipment normally used for calibration. Methane gas is applied to the sensor head through the calibration cup. The methanometer does not have to be removed from the mining machine. The second is a simple laboratory technique that requires the methane sensor be placed in a test box where it is exposed to methane gas. Underground Response Time Measurements Using a Calibration Cup • Methane calibration gas (typically 2.5% by volume) is delivered at a constant flow rate through the manufacturer-supplied calibration cup. • At time zero, the calibration cup is placed over the sensor dust cap. • The elapsed time and corresponding concentration displayed on the visual readout are recorded every 5 seconds until the instrument readings become steady. • The response time curve is drawn and used to determine the 90% response time. Laboratory Response Time Measurement Using a Test Box The wooden test box, 14 x 14 x 14 inch, is shown in Figure 1. • One or more instrument sensors are placed in the box. The box is sealed by replacing the lid. The visual displays for each instrument remain attached to the sensors but are placed outside the box where they can be observed. • One thousand cm3 of methane gas (99% by volume) is injected into the box using a 1500-cm3 graduated plastic syringe. Approximately 4 seconds are required to inject this quantity of gas. Two small fans mounted on the bottom of the box provide rapid mixing of the methane and air. Although there is some leakage from the box during and following methane transfer, the gas concentration remains approximately 2.2% by volume for more than 2 minutes. • Time zero is when the gas is injected. Every 5 seconds, the gas concentration is read and recorded from the visual display until the readings no longer increase. • Response time curves are drawn and used to determine the 90% response time. Measurement of Response Times, Machine-mounted Monitors Three methane monitors that are approved by MSHA for use on mining machines were selected for testing. The three, identified as monitors “A," “C," and “G," (Figure 2) use catalytic heat of combustion sensors. The 90% response times were determined using the response time curves obtained using the two measurement techniques—calibration cup and test box—described above (Figure 3). • Response times varied between monitors with both measurement techniques. Flow patterns, which were affected most by the dust cap design (calibration cup test), had the biggest effect on response times (Figure 3 and 4). • Placing the calibration cup on the dust cap restricted flow through the sensor head, especially with monitor C. • Response times measured with the test box were shorter than when measured with the calibration cup. o In the test box, flow was not restricted by the calibration cup. o In the test box, flow through the sensor head was more representative of flow conditions underground. • Using the test box, response times were measured with the dust caps removed from the sensor heads (Figure 5). The response times were 6 to 16 seconds shorter when the caps were removed from the sensor heads. This represents the time required for the gas to diffuse through the dust cap. Measurement of Response Times, Infrared Monitors Most methane monitors used in coal mines have catalytic heat of combustion sensors, but some infrared monitors and detectors have been approved by MSHA for underground use. Response times were measured for two methanometers equipped with infrared sensors [Taylor et al. 2008]. The two sensor heads with their dust caps, designated IR-1 and IR-2, are shown in Figure 6. Both dust caps have narrow slot openings with baffles, which reduce the amount of dust and water mist that passes into the sensor. In addition, the inner surface of the IR-2 sensor head is lined with a filter material that resembles dense foam (180-micron pore size). Response times were measured in the test box with and without the dust caps attached to the sensor heads (Figure 7). • With the dust caps, the response time was three times longer for IR-2. The differences in the response times are due to the structure of the dust caps. • Without the dust caps, the response times for both IR-1 and IR-2 were approximately 3 seconds. (Near the beginning of the test, concentrations exceeded 100% of the final response concentration—approximately 2% by volume—because methane gas injected into the box had not mixed completely). Effect of Response Time on Peak Concentration Measurements A study was conducted to evaluate how response time affects face methane measurements. Methane concentrations were measured with three instruments placed on the mining machine in the ventilation test gallery (Figure 8). Two of the methanometers (IR-1 and IR-2 described above) used infrared sensors and the third (HC) used a catalytic heat of combustion sensor. The heat of combustion instrument (Figure 9) was approved for use underground but not included in earlier response time tests. The 90% response times for the three instruments were • IR-1–10 seconds • IR-2–33 seconds • HC–19 seconds Data were collected at a rate of one sample/sec for 2 minutes for several different ventilation conditions. Data from one of these tests are shown in Figure 10. • The average concentrations for the entire sampling period measured by IR-1, IR-2, and HC were approximately the same (0.37%, 0.38%, and 0.41% methane respectively). • Concentrations varied similarly during the sampling periods. • The faster the instrument response, the quicker the concentration changed (up or down). • The faster the instrument response the larger the peaks and dips in concentration. 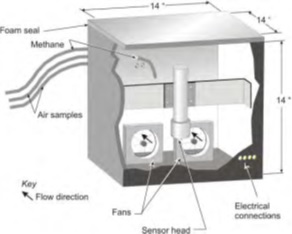 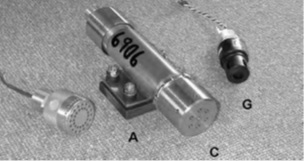 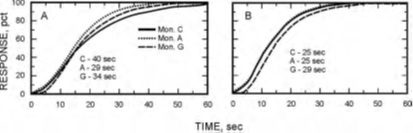 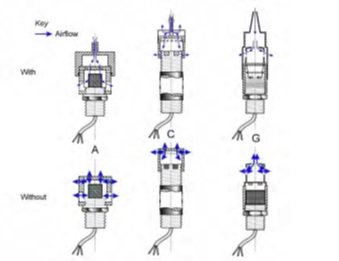 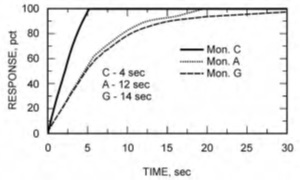 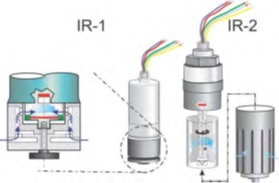 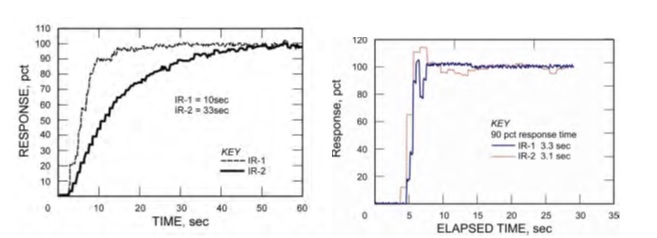 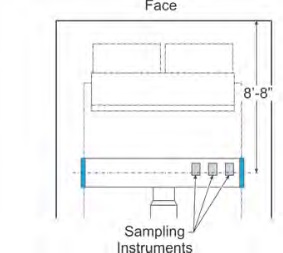 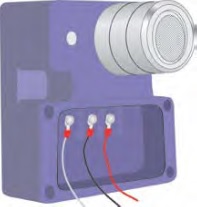 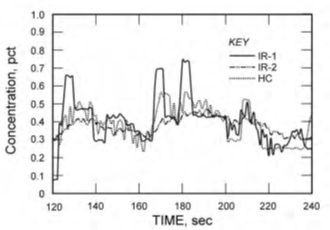 NOTE: The above control information is taken directly from the following publication: NIOSH [2010]. Information circular 9523. Guidelines for the control and monitoring of methane gas in continuous mining operations. Morgantown, WV: U.S. Department of Health and Human Services, Centers for Disease Control and Prevention, National Institute for Occupational Safety and Health, DHHS (NIOSH) Publication No. 2010-141. |
|
|
Kirk WS [1996]. The history of the Bureau of Mines. In: U.S. Bureau of Mines Minerals Yearbook, 1994. Washington, DC: U.S. Bureau of Mines. NIOSH [2011]. Ventilation and explosion prevention highlights. [http://www.cdc.gov/niosh/mining/highlights/programareahighlights16.html] Taylor CD, Chilton JE, Mal T [2002a]. Evaluating performance characteristics of machine-mounted methane monitors by measuring response time. In: de Souza E, ed. Mine ventilation: proceedings of the North American/Ninth U.S. Mine Ventilation Symposium. Lisse, The Netherlands: Swets & Zeitlinger, pp. 315-321. Taylor CD, Timko RJ, Thimons ED, Zimmer JA [2002b]. Safety concerns associated with the use of electrically powered haulage to remove workers from mines during main fan stoppages. In: de Souza E, ed. Mine ventilation: proceedings of the North American/Ninth U.S. Mine Ventilation Symposium. Lisse, The Netherlands: Swets & Zeitlinger, pp. 649–653. Taylor CD, Chilton JE, Martikainen AL [2008]. Use of infrared sensors for monitoring methane in underground mines. In: Wallace KG Jr., ed. Proceedings of the 12th U.S./North American Mine Ventilation Symposium. Reno NV: University of Nevada, pp. 307–312. USBM [1958]. Auxiliary ventilation of continuous miner places. By Stahl RW. Washington, DC: U.S. Bureau of Mines, Report of Investigations, No. 5414. |
|
|
coal mining continuous mining operations deep-cut mining miners |