Prospecting for Zoonotic Pathogens by Using Targeted DNA Enrichment
Egie E. Enabulele, Winka Le Clec’h, Emma K. Roberts, Cody W. Thompson, Molly M. McDonough, Adam W. Ferguson, Robert D. Bradley, Timothy J. C. Anderson, and Roy N. Platt

Author affiliations: Texas Biomedical Research Institute, San Antonio, Texas, USA (E.E. Enabulele, W. Le Clec’h, T.J.C. Anderson, R.N. Platt II); Texas Tech University, Lubbock, Texas, USA (E.K. Roberts, R.D. Bradley); University of Michigan, Ann Arbor, Michigan, USA (C.W. Thompson); Chicago State University, Chicago, Illinois, USA (M.M. McDonough); Field Museum of Natural History, Chicago (A.W. Ferguson)
Main Article
Figure 5
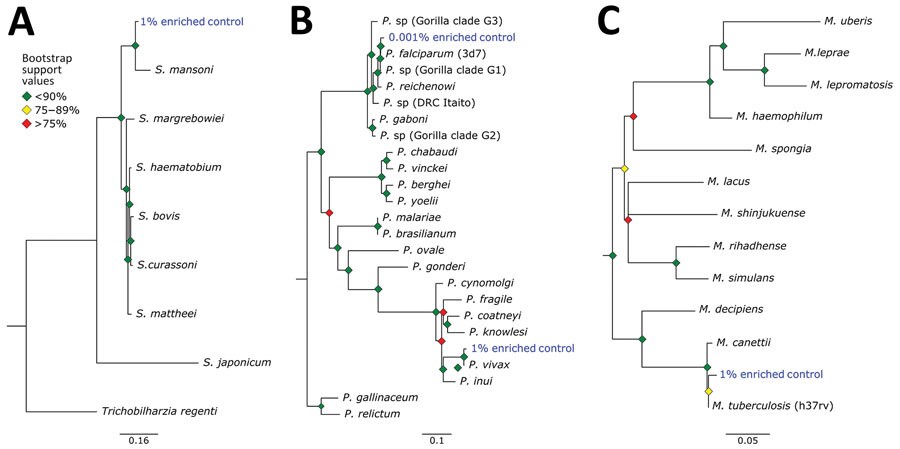
Figure 5. Phylogenetic analysis of pathogens used in control samples for study of prospecting for zoonotic pathogens by using targeted DNA enrichment. A) Schistosoma; B) Plasmodium; C) Mycobacterium. Reads from each control pathogen (M. tuberculosis, P. falciparum, P. vivax, and S. mansoni) were extracted, assembled, aligned, and trimmed for maximum-likelihood phylogenetic analyses. The phylogenies were used to identify the species or strain of pathogen used in the controls. Blue indicates control samples. Bootstrap support values are indicated by colored diamonds at each available node. Branches with <50% bootstrap support were collapsed. Nodal support is indicated by color coded diamonds. Scale bars indicate nucleotide substitutions per site. Assembly accession numbers (e.g., GCA902374465) and tree files are available from https://doi.org/10.5281/zenodo.8014941.
Main Article
Page created: June 07, 2023
Page updated: July 20, 2023
Page reviewed: July 20, 2023
The conclusions, findings, and opinions expressed by authors contributing to this journal do not necessarily reflect the official position of the U.S. Department of Health and Human Services, the Public Health Service, the Centers for Disease Control and Prevention, or the authors' affiliated institutions. Use of trade names is for identification only and does not imply endorsement by any of the groups named above.