Sodium Content in Packaged Foods by Census Division in the United States, 2009
BRIEF — Volume 12 — April 2, 2015
Alexandra K. Lee, MSPH; Linda J. Schieb, MSPH; Keming Yuan, MS; Joyce Maalouf, MS, MPH; Cathleen Gillespie, PhD; Mary E. Cogswell, DrPH
Suggested citation for this article: Lee AK, Schieb LJ, Yuan K, Maalouf J, Gillespie C, Cogswell ME. Sodium Content in Packaged Foods by Census Division in the United States, 2009. [Erratum appears in Prev Chronic Dis 2015;12. http://www.cdc.gov/pcd/issues/2015/14_0500e.htm.] Prev Chronic Dis 2015;12:140500. DOI: http://dx.doi.org/10.5888/pcd12.140500external icon.
PEER REVIEWED
PEER REVIEWED
Abstract
Excess sodium intake correlates positively with high blood pressure. Blood pressure varies by region, but whether sodium content of foods sold varies across regions is unknown. We combined nutrition and sales data from 2009 to assess the regional variation of sodium in packaged food products sold in 3 of the 9 US census divisions. Although sodium density and concentration differed little by region, fewer than half of selected food products met Food and Drug Administration sodium-per-serving conditions for labeling as “healthy.” Regional differences in hypertension were not reflected in differences in the sodium content of packaged foods from grocery stores.
Introduction
Excess sodium intake is a major preventable risk factor for hypertension (1,2). More than 90% of US adults consume more sodium than recommended (2,3). Recent studies highlighted the challenges of eating low-sodium diets, given the current availability of commercially packaged food products (4,5). Hypertension prevalence varies by geographic region (6). However, it is unclear if regional variation in sodium consumption exists, and, if so, whether that variation is due to regional differences in sodium content of packaged foods (7,8). The purpose of this study was to investigate regional differences in the sodium content of packaged food products sold in US grocery stores.
Methods
The 2009 product-level point-of-sales Nielsen ScanTrack database (www.nielsen.com/us/en.html) captures all branded products sold in US grocery stores with annual sales of $2 million or more (not including warehouse-type stores and Walmart) and includes 52 markets in 9 US census divisions. For these analyses, 3 census divisions — South Atlantic, East North Central, and Pacific — representing approximately 50% of the US population were chosen to reflect places with high (South Atlantic), medium (East North Central), and low (Pacific) prevalence of hypertension (6).
We identified products in the 10 food categories that contribute the most sodium to the US diet (9). We obtained nutritional information for those products in the top 80% or with greater than 1% of sales in each census division. A detailed description of nutrient data collection methods are published elsewhere (5). To allow comparison of products of different sizes, we estimated the equivalized unit sales, weighted in ounces, calculated as unit sales × unit size in ounces. We then calculated the mean and standard deviation of sodium content in each food category in milligrams (mg) per serving, mg per kilocalorie (density), and mg per 100 grams (concentration). Sodium density accounts for variation in the energy value of each product. Because sodium and kilocalorie consumption are generally highly positively correlated, use of sodium density has been proposed as a way to compare the sodium content of foods with the same amount of calories (4). Weighted t tests were used to determine differences between census divisions. The equivalized, sales-weighted proportion of products in each food category meeting Food and Drug Administration (FDA) sodium limits for foods using the “healthy” label claim (ie, ≤600 mg of sodium/serving for meals and ≤480 mg/serving for individual foods) was calculated (10). All analyses used grocery product sales and nutrition facts panel data; actual sodium consumption was not measured. We used SAS-callable SUDAAN version 9.3 (RTI, International).
Results
Out of 3,974 products identified, 3,876 products from the Nielsen sales database were matched with nutrition facts panel information. The sales-weighted mean sodium density varied from 1.34 (standard deviation [SD], 0.65) mg/kcal for savory snacks in the Pacific division to 18.89 (SD, 24.0) mg/kcal for soup in the South Atlantic division (Table 1). Although there were several significant pairwise differences between regions, no clear pattern emerged. Mean sodium density was highest in the East North Central for 4 of the 10 food categories (poultry, cheese, pasta mixed dishes, and meat mixed dishes). In the South Atlantic, mean sodium density was highest for 3 food categories (bread, soup, and savory snacks), and in the Pacific mean sodium density was highest for the remaining 3 food categories (cold cuts, pizza, and sandwiches). Results for sodium concentration were similar to those for sodium density.
More than 70% of pizzas, pasta mixed dishes, and meat mixed dishes and 50% to 70% of cold cuts, soups, and sandwiches exceeded FDA “healthy” labeling standards for sodium, whereas less than 10% of breads, savory snacks, and cheeses did (Figure). Few significant differences were seen between markets and are not presented here.
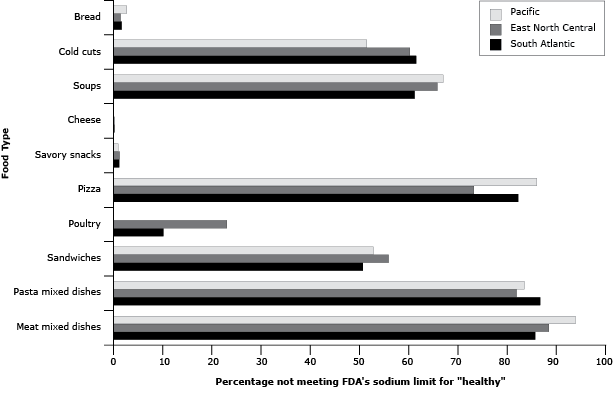
Figure. Percentage of packaged food products sold with sodium content higher than the Food and Drug Administration limit for “healthy” food (ie, ≤480 mg per serving for breads, cold cuts, soups, cheese, and savory snacks) or meal (ie, ≤600 mg per serving for pizza, poultry, sandwiches, pasta mixed dishes, and meat mixed dishes), by US Census Division, 2009. Percentages are based on equivalized, sales-weighted estimates (weighted by ounce) to allow comparison of products by common units. [A tabular description of this figure is also available.]
Discussion
Few differences in sodium density or concentration of packaged food products, as measured by grocery sales, were found across census divisions. In all 3 divisions, 50% or more of products sold in most food categories exceeded the sodium-per-serving conditions for a “healthy” food.
Although most of the regional differences found did not have a clear direction or contributor, some may relate to regional variations in the popularity of specific types of products within a food category. For example, in a post-hoc analysis, compared with the Pacific division, the South Atlantic and East North Central divisions had higher unit sales of “American cheese” (both cheese and cheese product), which has nearly double the sodium density and sodium concentration of other cheeses. However, because many of the top-selling packaged food products in each region were national brands, regional variation in sodium content of available products may be limited.
Although this study is unique in examining sodium content at the US census division level, we acknowledge several limitations. First, the Nielsen ScanTrack database does not capture all grocery sales in the United States, although it likely provides a representative sample. Second, we did not adjust for multiple comparisons; therefore, some observed differences may be due to chance. Finally, the data indicate sales of products, not consumption. However, in one study, nutrient intake estimated on the basis of sales data was comparable to average self-reported dietary intake from the New Zealand National Nutrition Survey (11).
Despite limitations, these data support recent findings that suggest that meeting sodium recommendations may be difficult in the current food environment, regardless of location (4,5). In all 3 census divisions, the similarly narrow distributions of sodium density in most food categories are indicative of the lack of variation in sodium content. If differences in the food environment are contributing to regional variation in hypertension, it is likely not through variation in the sodium content of packaged food products sold in the grocery store.
Acknowledgments
The authors acknowledge Kristy Gerdes and Gregory Schwartz for their contributions. The authors have no funding sources or conflicts of interest to disclose.
Author Information
Corresponding Author: Linda Schieb, MSPH, Epidemiologist, Centers for Disease Control and Prevention, Division for Heart Disease and Stroke Prevention, 4770 Buford Hwy, NE, MS F-72, Atlanta, GA 30341. Telephone: 770-488-5348. Email: Ekf7@cdc.gov.
Author Affiliations: Alexandra K. Lee, Emory University, Atlanta, Georgia; Keming Yuan, Joyce Maalouf, Cathleen Gillespie, Mary E. Cogswell, Centers for Disease Control and Prevention, Atlanta, Georgia.
References
- Sacks FM, Svetkey LP, Vollmer WM, Appel LJ, Bray GA, Harsha D, et al. ; DASH-Sodium Collaborative Research Group. Effects on blood pressure of reduced dietary sodium and the Dietary Approaches to Stop Hypertension (DASH) diet. Dash Sodium Collaborative Research Group. N Engl J Med 2001;344(1):3–10. CrossRefexternal icon PubMedexternal icon
- Institute of Medicine. Strategies to reduce sodium intake in the United States. Washington (DC): The National Academy Press; 2010.
- Centers for Disease Control and Prevention. Trends in the prevalence of excess dietary sodium intake — United States, 2003–2010. MMWR Morb Mortal Wkly Rep 2013;62(50):1021–5. PubMedexternal icon
- Guenther PM, Lyon JMG, Appel LJ. Modeling dietary patterns to assess sodium recommendations for nutrient adequacy. Am J Clin Nutr 2013;97(4):842–7. CrossRefexternal icon PubMedexternal icon
- Gillespie C, Maalouf J, Yuan K, Cogswell M, Gunn J, Levings J, et al. Sodium content in major brands of US packaged foods. Am J Clin Nutr 2015;101(2):344–53. PubMedexternal icon
- Ezzati M, Oza S, Danaei G, Murray CJL. Trends and cardiovascular mortality effects of state-level blood pressure and uncontrolled hypertension in the United States. Circulation 2008;117(7):905–14. CrossRefexternal icon PubMedexternal icon
- Newby PK, Noel SE, Grant R, Judd S, Shikany JM, Ard J. Race and region are associated with nutrient intakes among black and white men in the United States. J Nutr 2011;141(2):296–303. CrossRefexternal icon PubMedexternal icon
- Hajjar I, Kotchen T. Regional variations of blood pressure in the United States are associated with regional variations in dietary intakes: the NHANES-III data. J Nutr 2003;133(1):211–4. PubMedexternal icon
- Centers for Disease Control and Prevention. Vital signs: food categories contributing the most to sodium consumption — United States, 2007–2008. MMWR Morb Mortal Wkly Rep 2012;61(5):92–8. PubMedexternal icon
- US Department of Health and Human Services, Food and Drug Administration, 21CFR101.65. http://www.accessdata.fda.gov/scripts/cdrh/cfdocs/cfcfr/CFRSearch.cfm?fr=101.65. Accessed February 27, 2015.
- Hamilton S, Mhurchu CN, Priest P. Food and nutrient availability in New Zealand: an analysis of supermarket sales data. Public Health Nutr 2007;10(12):1448–55. CrossRefexternal icon PubMedexternal icon
Table
 Table 1. Sales-Weighted Distribution of Sodium Content in Packaged Foods Sold, by the Top Food Categories Contributing to Sodium Consumption, by Census Division, United States, 2009
| Food category | No. of Products | Mean (SD) Sodium Density, mg/kcal | Mean (SD) Sodium Concentration, mg/100 g | ||||||
|---|---|---|---|---|---|---|---|---|---|
| East North Central | South Atlantic | Pacific | East North Central | South Atlantic | Pacific | East North Central | South Atlantic | Pacific | |
| Bread | 339 | 220 | 243 | 1.92a (0.35) | 1.93 (0.43) | 1.84 (0.33) | 488.3 (81.9) | 477.9 (94.2) | 473.8 (76.8) |
| Cold cuts | 267 | 261 | 196 | 5.71b,c (3.46) | 6.59 (3.81) | 7.01 (3.77) | 970.6 (359.3) | 975.8 (377.7) | 1,011.4 (389.1) |
| Pizza | 164 | 100 | 90 | 2.21d (0.31) | 2.28 (0.36) | 2.35 (0.38) | 544.8d (81.6) | 565.5 (94.5) | 581.7 (90.8) |
| Poultry | 28 | 22 | 11 | 2.82 (2.49) | 1.92 (1.77) | 1.93 (0.67) | 274.9 (177.9) | 196.3 (140.3) | 274.6 (104.2) |
| Soup | 175 | 180 | 171 | 17.29 (24.1) | 18.89 (24.0) | 17.59 (22.7) | 407.2 (203.0) | 392.8 (208.1) | 469.5 (393.8) |
| Sandwiches | 122 | 109 | 73 | 2.11 (0.50) | 2.18 (0.54) | 2.32 (0.49) | 524.4a (137.0) | 564.5 (152.1) | 587.8 (121.3) |
| Cheese | 321 | 284 | 201 | 3.25e (1.60) | 3.16f (1.55) | 2.54 (1.35) | 993.9g (394.9) | 981.4h (391.8) | 810.3 (335.4) |
| Pasta mixed dishes | 166 | 165 | 148 | 3.17i (1.07) | 2.99 (0.87) | 2.86 (0.92) | 480.9 (416.0) | 437.2 (316.7) | 428.0 (357.6) |
| Meat mixed dishes | 91 | 98 | 70 | 3.38 (1.14) | 3.08 (1.06) | 3.25 (0.89) | 423.8 (138.4) | 423.8 (151.5) | 422.8 (120.5) |
| Savory snacks | 389 | 333 | 208 | 1.43 (0.84) | 1.45 (0.85) | 1.34 (0.65) | 701.5 (313.4) | 706.0 (312.6) | 687.2 (278.8) |
Abbreviation: SD, standard deviation.
a P = .03 for comparison of East North Central and Pacific.
b P = .04 for comparison of East North Central and Pacific.
c P = .03 for comparison of East North Central and South Atlantic.
d P = .01 for comparison of East North Central and Pacific.
e P = .003 for comparison of East North Central and Pacific.
f P = .007 for comparison of South Atlantic and Pacific.
g P = .004 for comparison of East North Central and Pacific.
h P = .009 for comparison of South Atlantic and Pacific.
i P = .02 for comparison of East North Central and Pacific.
The opinions expressed by authors contributing to this journal do not necessarily reflect the opinions of the U.S. Department of Health and Human Services, the Public Health Service, the Centers for Disease Control and Prevention, or the authors’ affiliated institutions.