Babesiosis Graphs
Number* of reported cases of babesiosis, by year, 2011–2020†
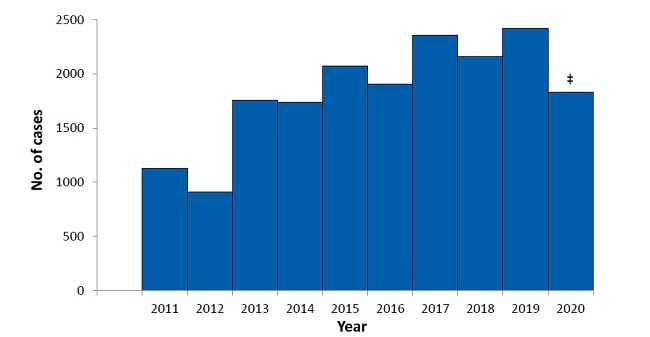
* A total of 18,294 cases of babesiosis were reported (2011, n = 1,126; 2012, n = 911; 2013, n = 1,761; 2014, n = 1,742; 2015, n = 2,074; 2016, n = 1,909; 2017, n = 2,358; 2018, n = 2,161; 2019, n = 2,418; 2020, n = 1,834).
† Year as reported by the health department.
‡ 2020 data may be lower or higher than previous years. COVID-19 likely had an impact on public health activities including case identification, case investigations, as well as possibly impacting transmission rates. This may reflect the impact of isolation and prevention measures, whether people sought health care when they were ill, and other changes in behavior during the COVID-19 pandemic period.
Number of reported cases of babesiosis, by age group* in years, 2020†,‡

* Data on age were available for most case-patients (2020, n = 1,827).
† Year as reported by the health department.
‡ 2020 data may be lower or higher than previous years. COVID-19 likely had an impact on public health activities including case identification, case investigations, as well as possibly impacting transmission rates. This may reflect the impact of isolation and prevention measures, whether people sought health care when they were ill, and other changes in behavior during the COVID-19 pandemic period.
Number of reported cases of babesiosis, by month of symptom onset*, 2020†,‡

* Data on month of symptom onset were available for most case-patients (2020, n = 1,418).
† Year as reported by the health department.
‡ 2020 data may be lower or higher than previous years. COVID-19 likely had an impact on public health activities including case identification, case investigations, as well as possibly impacting transmission rates. This may reflect the impact of isolation and prevention measures, whether people sought health care when they were ill, and other changes in behavior during the COVID-19 pandemic period.