Births in the United States, 2022
NCHS Data Brief No. 477, August 2023
PDF Version (520 KB)
Joyce A. Martin, M.P.H, Brady E. Hamilton, Ph.D., and Michelle J.K. Osterman, M.H.S.
- Key findings
- The number of births was essentially unchanged and the GFR declined from 2021 to 2022.
- Birth rates from 2021 to 2022 declined for females aged 15–24 and rose for women aged 25–29 and 35–44.
- The cesarean delivery rate remained unchanged in 2022.
- The preterm birth rate declined between 2021 and 2022.
- Summary
Data from the National Vital Statistics System
- The number of births in the United States was essentially unchanged from 2021 to 2022, following a rise of 1% from 2020 to 2021.
- The general fertility rate declined 1% in 2022 to 56.0 births per 1,000 females aged 15–44, following an increase of 1% from 2020 to 2021.
- Birth rates declined for age groups 15–19 and 20–24 and rose for age groups 25–29 and 35–44 between 2021 and 2022, similar to the pattern seen for 2020 to 2021.
- The cesarean delivery rate was 32.1% in 2022, unchanged from 2021. The rate rose 1% from 2020 to 2021.
- The preterm birth rate declined 1% in 2022 to 10.38%, following an increase of 4% from 2020 to 2021.
This report presents selected highlights from 2022 final birth data on key demographic, healthcare utilization, and infant health indicators. The number of births, general fertility rates (GFRs) (births per 1,000 females aged 15–44), age-specific birth rates (births per 1,000 women in specified age group), and cesarean delivery and preterm (less than 37 weeks of gestation) birth rates are presented. Results for 2020, 2021, and 2022 are shown for all births to describe changes in birth patterns during the COVID-19 pandemic years (1,2). Cesarean and preterm birth rates are shown for select race and Hispanic-origin groups.
Keywords: general fertility rate, cesarean delivery, gestational age, National Vital Statistics System
The number of births was essentially unchanged and the GFR declined from 2021 to 2022.
- In 2022, 3,667,758 births were registered in the United States, essentially unchanged from 2021 (3,664,292) (Figure 1).
- The GFR for the United States decreased 1% in 2022 to 56.0 per 1,000 females aged 15–44 from 56.3 in 2021.
- From 2020 to 2021, both the number of births and the GFR rose 1%.
Figure 1. Number of live births and general fertility rates: United States, 2020–2022
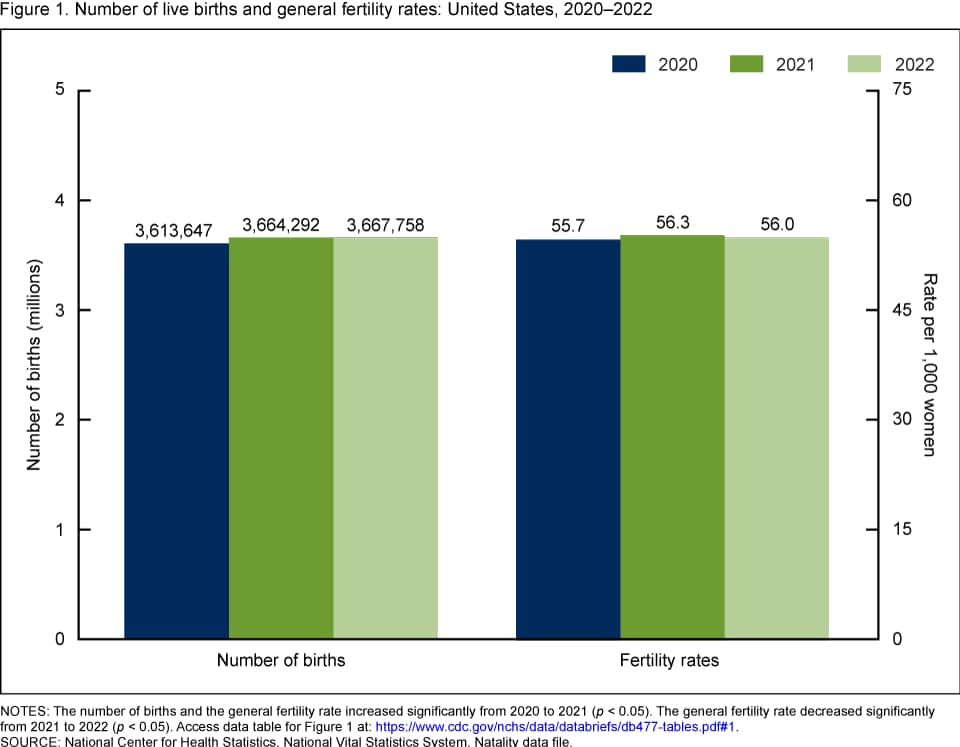
NOTES: The number of births and the general fertility rate increased significantly from 2020 to 2021
(p < 0.05). The general fertility rate decreased significantly from 2021 to 2022 (p < 0.05). Access data table for Figure 1.
SOURCE: National Center for Health Statistics, National Vital Statistics System, Natality data file.
Birth rates from 2021 to 2022 declined for females aged 15–24 and rose for women aged 25–29 and 35–44.
- The birth rate for teenagers aged 15–19 declined 2% from 2021 to 2022 (13.9 to 13.6 births per 1,000 females), following a decline of 7% from 2020 to 2021 (Figure 2).
- The birth rate for women aged 20–24 declined 7% from 61.5 in 2021 to 57.5 in 2022, following a decline of 3% from 2020 to 2021. The birth rate for women aged 25–29 rose 1% in 2022 to 93.5 from 93.0 in 2021, following a rise of 2% from 2020 to 2021.
- In 2022, the birth rate for women aged 30–34 was essentially unchanged at 97.5, while the rate for women aged 35–39 rose 3% to 55.3 from 53.7 in 2021. Rates for women in both age groups had risen 3% and 5%, respectively, from 2020 to 2021.
- The birth rate for women aged 40–44 rose 5% in 2022 from 12.0 to 12.6; the rate had risen 2% from 2020 to 2021.
Figure 2. Selected age-specific birth rates: United States, 2020–2022

1Significant decrease from 2020 to 2021 (p < 0.05).
2Significant decrease from 2021 to 2022 (p < 0.05).
3Significant increase from 2020 to 2021 (p < 0.05).
4Significant increase from 2021 to 2022 (p < 0.05).
NOTES: Access data table for Figure 2.
SOURCE: National Center for Health Statistics, National Vital Statistics System, Natality data file.
The cesarean delivery rate remained unchanged in 2022.
- The cesarean delivery rate was 32.1% in 2022, unchanged from 2021 (Figure 3).
- The cesarean delivery rate was stable for Black non-Hispanic (subsequently, Black) women from 2021 to 2022 at 36.8%.
- For White non-Hispanic (subsequently, White) women, the cesarean delivery rate was 31.1% in 2022, less than a 1% increase from the rate of 31.0% in 2021.
- For Hispanic women, the cesarean delivery rate increased less than 1% in 2022, from 31.6% in 2021 to 31.7%.
- The cesarean delivery rate had increased by 1% or less from 2020 to 2021 for all women and for Black, White, and Hispanic women.
Figure 3. Cesarean delivery rates, by race and Hispanic origin of mother: United States, 2020–2022
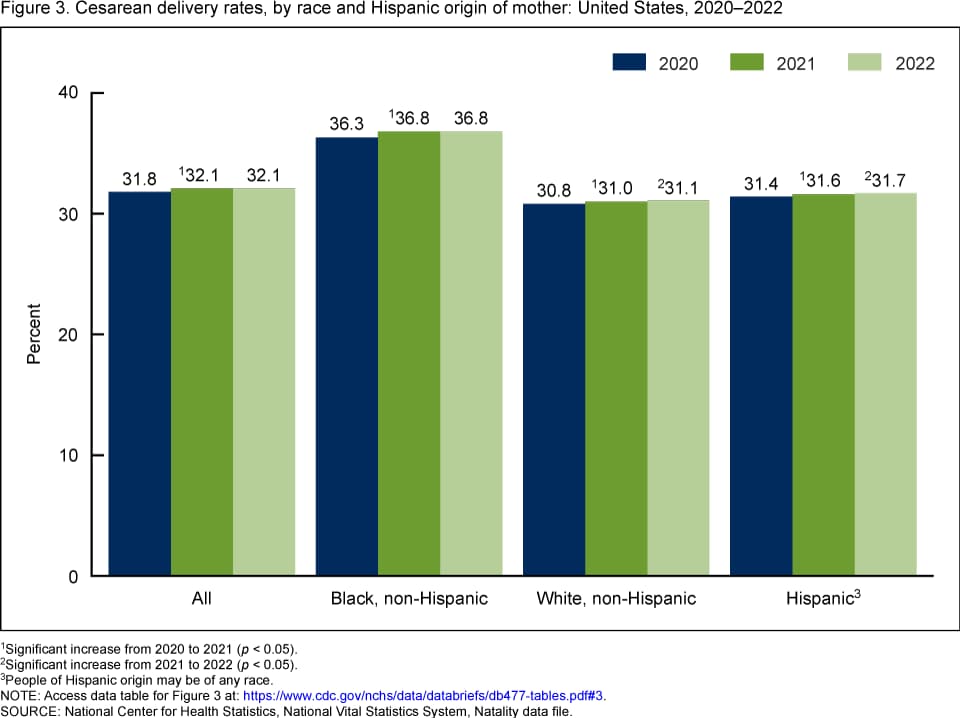
1Significant increase from 2020 to 2021 (p < 0.05).
2Significant increase from 2021 to 2022 (p < 0.05).
3People of Hispanic origin may be of any race.
NOTES: Access data table for Figure 3.
SOURCE: National Center for Health Statistics, National Vital Statistics System, Natality data file.
The preterm birth rate declined between 2021 and 2022.
- The percentage of newborns born preterm declined 1% from 10.49% of all births in 2021 to 10.38% in 2022. This decline follows a 4% rise in the preterm rate from 2020 (10.09%) to 2021 (Figure 4).
- The preterm birth rate declined 1% for Black mothers, from 14.75% in 2021 to 14.59% in 2022. The rate for this group had risen 3% from 2020 (14.36%) to 2021.
- The preterm rate also declined 1% for births to White mothers from 2021 (9.50%) to 2022 (9.44%). Preterm births to White mothers had risen 4% from 2020 (9.10%) to 2021.
- For Hispanic mothers, the preterm birth rate declined 2% in 2022 to 10.06% from 10.23% in 2021. The preterm rate for births to Hispanic mothers had risen 4% from 2020 (9.84%) to 2021.
Figure 4. Preterm birth rates, by race and Hispanic origin of mother: United States, 2020–2022

1People of Hispanic origin may be of any race.
NOTES: Rates for all groups significantly increased from 2020 to 2021 (p < 0.05). Rates for all groups significantly declined from 2021 to 2022 (p < 0.05). Preterm is less than 37 completed weeks of gestation. Access data table for Figure 4.
SOURCE: National Center for Health Statistics, National Vital Statistics System, Natality data file.
Summary
U.S. birth certificate data for 2022 show modest changes in some childbearing and perinatal health indicators compared with changes observed for 2020 and 2021, the first years of the COVID-19 pandemic. Following a 4% decline in births between 2019 and 2020 and a 1% increase between 2020 and 2021, the number of births was essentially stable in 2022. The GFR declined 1% in 2022 after a 1% increase from 2020 to 2021 and a 4% decrease from 2019 to 2020. From 2014 to 2019, the number of births and the GFR declined by average annual rates of 1% and 2%, respectively (2). Age-specific birth rates declined from 2021 to 2022 for females aged 15–24 and rose for women aged 25–29 and 39–44; patterns were generally consistent with changes for 2020 to 2021.
The cesarean delivery rate was unchanged in 2022 after increases of 1% or less from 2019 to 2020 and 2020 to 2021; the rate generally declined from 2009 to 2019 (2,3). The preterm birth rate declined 1% in 2022 following a 4% rise from 2020 to 2021 and a 1% decline from 2019 to 2020. The preterm rate had risen 7% from 2014 to 2019 (2).
Definitions
Age-specific birth rates: Births per 1,000 mothers in a specified age group.
Cesarean delivery rate: Number of births to mothers having a cesarean delivery per 100 births.
General fertility rate: Number of births per 1,000 females aged 15–44.
Preterm birth rate: Births delivered before 37 completed weeks of gestation per 100 births. Gestational age is based on the obstetric estimate of gestation.
Data source and methods
This report uses data from the Natality data file from the National Vital Statistics System. The vital statistics Natality file is based on information derived from birth certificates and includes information for all births occurring in the United States. This Data Brief accompanies the release of the 2022 natality public use file (4). More detailed analysis of the topics presented in this report plus others, such as births by age of mother; tobacco use during pregnancy; pregnancy risk factors; prenatal care timing and use; receipt of food from the Special Supplemental Nutrition Program for Women, Infants, and Children; maternal body mass index; and breastfeeding, is possible by using the annual natality files (4). This brief shows cesarean delivery and preterm birth rates for the three largest race and Hispanic-origin groups. Additional information from the 2022 final birth data file for additional and more detailed race and Hispanic-origin groups is available via CDC WONDER and will be included in the final 2022 National Vital Statistics birth report.
References to increases or decreases in rates or percentages indicate differences are statistically significant at the 0.05 level based on a two-tailed z test. Computations exclude records for which information is unknown.
Rates shown in this report are based on population estimates derived from a base that incorporates the 2020 census, vintage 2020 estimates, and 2020 Demographic Analysis estimates. Rates are calculated based on population estimates as of April 1, 2020, and July 1, 2021 (vintage 2021) and July 1, 2022 (vintage 2022) (1,5). The vintage 2022 population estimates include methodological changes made after the release of the vintage 2021 population estimates and projection (6,7). Changes in rates from 2020 to 2021 and from 2021 to 2022 reflect changes in births and changes in the population estimates.
About the authors
Joyce A. Martin, Brady E. Hamilton, and Michelle J.K. Osterman are with the National Center for Health Statistics, Division of Vital Statistics.
References
- Osterman MJK, Hamilton BE, Martin JA, Driscoll AK, Valenzuela CP. Births: Final data for 2021. National Vital Statistics Reports; vol 72 no 1. Hyattsville, MD: National Center for Health Statistics. 2023. DOI: https://dx.doi.org/10.15620/cdc:122047.
- Osterman MJK, Hamilton BE, Martin JA, Driscoll AK, Valenzuela CP. Births: Final data for 2020. National Vital Statistics Reports; vol 70 no 17. Hyattsville, MD: National Center for Health Statistics. 2022. DOI: https://dx.doi.org/10.15620/cdc:112078.
- Martin JA, Hamilton BE, Osterman MJK, Driscoll AK, Mathews TJ. Births: Final data for 2015. National Vital Statistics Reports; vol 66 no 1. Hyattsville, MD: National Center for Health Statistics. 2017.
- National Center for Health Statistics. Vital statistics online data portal.
- U.S. Census Bureau. Annual state resident population estimates for six race groups (five race alone groups and two or more races) by age, sex, and Hispanic origin: April 1, 2010, to July 1, 2022. 2023.
- U.S. Census Bureau. Methodology for the United States population estimates: Vintage 2022. Nation, states, counties, and Puerto Rico—April 1, 2010 to July 1, 2022. 2022.
- U.S. Census Bureau. Vintage 2022 release notes: May 18,2023 update. 2023.
Suggested citation
Martin JA, Hamilton BE, Osterman MJK. Births in the United States, 2022. NCHS Data Brief, no 477. Hyattsville, MD: National Center for Health Statistics. 2023. DOI: https://dx.doi.org/10.15620/cdc:131354.
Copyright information
All material appearing in this report is in the public domain and may be reproduced or copied without permission; citation as to source, however, is appreciated.
National Center for Health Statistics
Brian C. Moyer, Ph.D., Director
Amy M. Branum, Ph.D., Associate Director for Science
Division of Vital Statistics
Steven Schwartz Ph.D., Director
Andrés A. Berruti, Ph.D., M.A., Associate Director of Science