Characteristics of Mothers by Source of Payment for the Delivery: United States, 2021
- Key findings
- Private insurance and Medicaid were the largest sources of payment for the delivery in 2021.
- The principal source of payment for the delivery in 2021 varied by race and Hispanic origin.
- Deliveries to mothers under age 25 were more likely to be covered by Medicaid, while those to mothers aged 25 and over were more likely to be covered by private insurance.
- Coverage by private insurance rose with increasing educational attainment, while self-pay and Medicaid coverage declined.
- Summary
Data from the National Vital Statistics System
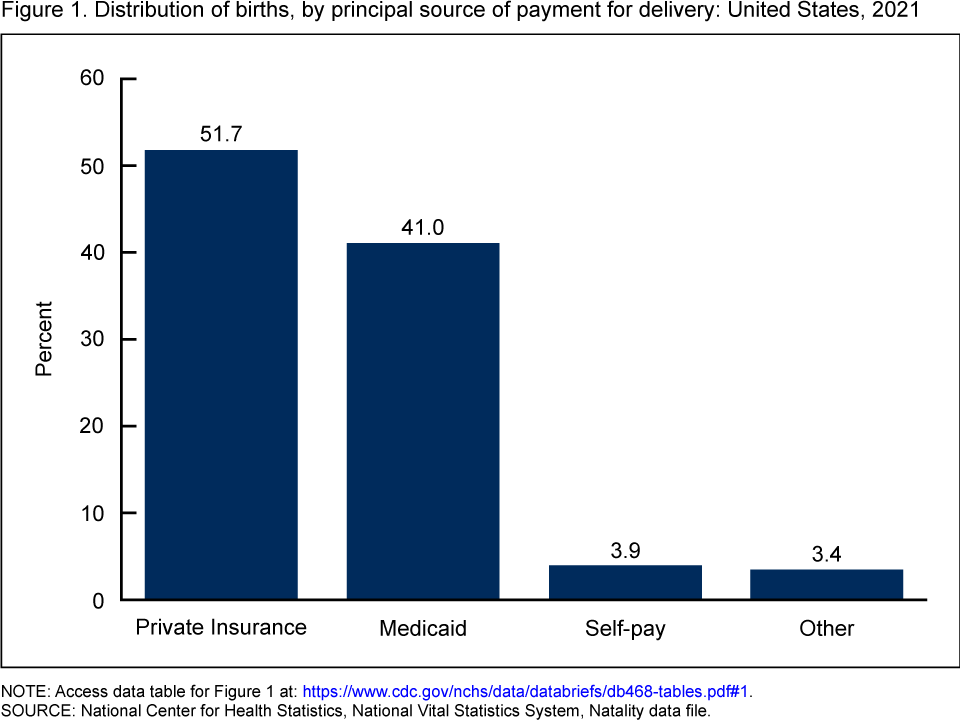
- More than one-half of mothers who gave birth in 2021 (51.7%) were covered by private insurance as the source of payment for the delivery, while 41.0% used Medicaid, 3.4% used other types of coverage, and 3.9% as self-pay.
- At least one-half of American Indian or Alaska Native non-Hispanic, Asian non-Hispanic, Native Hawaiian or Other Pacific Islander non-Hispanic, and White non-Hispanic mothers were covered by private insurance, while at least one-half of Black non-Hispanic and Hispanic mothers used Medicaid.
- Mothers under age 25 were more likely to be covered by Medicaid, while mothers aged 25 and over were more likely to use private insurance.
- Mothers with lower levels of educational attainment were more likely to be covered by Medicaid or to self-pay than mothers with higher educational attainment.
Access to health care coverage during pregnancy and delivery allows women to receive the care needed to maximize the likelihood of a healthy pregnancy and baby (1). National birth certificate data on the principal source of payment for the delivery became available in 2016, when all states implemented the 2003 U.S. Standard Certificate of Live Birth. This certificate provides information on payment through private insurance; Medicaid; CHAMPUS, TRICARE, and other types of government insurance; and self-pay, which has been shown to reflect the uninsured status of the mother at the time of delivery (2). This report describes the principal source of payment for the delivery in 2021 overall and by maternal race and Hispanic origin, age, and education.
Keywords: Race and Hispanic origin, educational attainment, National Vital Statistics System
Private insurance and Medicaid were the largest sources of payment for the delivery in 2021.
- Private insurance was the most common principal source of payment for the delivery in 2021 (51.7%), providing coverage for more than one-half of mothers giving birth in the United States (Figure 1).
- More than two out of five mothers who gave birth in 2021 had Medicaid as the principal source of payment for the delivery (41.0%).
- The percentage of mothers covered by other payment sources was 3.4%, while 3.9% of mothers self-paid for the delivery.
Figure 1. Distribution of births, by principal source of payment for delivery: United States, 2021
NOTE: Access data table for Figure 1.
SOURCE: National Center for Health Statistics, National Vital Statistics System, Natality data file.
The principal source of payment for the delivery in 2021 varied by race and Hispanic origin.
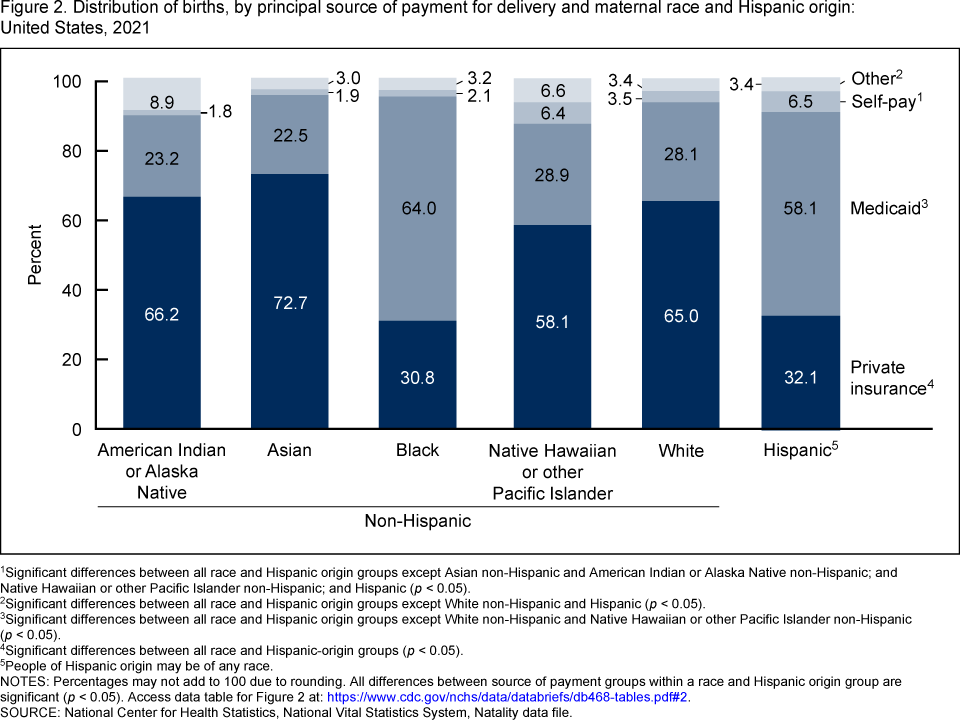
- More than one-half of deliveries of Asian non-Hispanic (subsequently, Asian) (72.7%), American Indian or Alaska Native non-Hispanic (subsequently, American Indian or Alaska Native) (66.2%), White non-Hispanic (subsequently, White) (65.0%) and Native Hawaiian or Other Pacific Islander non-Hispanic (subsequently, Native Hawaiian or Other Pacific Islander) (58.1%) mothers were covered by private insurance in 2021, compared with less than one-third of deliveries of Hispanic (32.1%) and Black non-Hispanic (subsequently, Black) (30.8%) mothers (Figure 2).
- Among Black and Hispanic mothers, 64.0% and 58.1% of deliveries, respectively, were covered by Medicaid in 2021, compared with 22.5% of deliveries to Asian, 23.2% to American Indian or Alaska Native, 28.9% to Native Hawaiian or Other Pacific Islander, and 28.1% to White mothers.
- Percentages of mothers who used other sources of payment ranged from 3.0% (Asian) to 8.9% (American Indian or Alaska Native).
- Percentages of mothers who self-paid for the delivery were two to three times higher among Hispanic (6.5%) and Native Hawaiian or Other Pacific Islander (6.4%) mothers than among mothers of other race and Hispanic-origin groups.
Figure 2. Distribution of births, by principal source of payment for delivery and maternal race and Hispanic origin: United States, 2021
1Significant differences between all race and Hispanic origin groups except Asian non-Hispanic and American Indian or Alaska Native non-Hispanic; and Native Hawaiian or other Pacific Islander non-Hispanic; and Hispanic (p < 0.05).
2Significant differences between all race and Hispanic origin groups except White non-Hispanic and Hispanic (p < 0.05).
3Significant differences between all race and Hispanic origin groups except White non-Hispanic and Native Hawaiian or other Pacific Islander non-Hispanic (p < 0.05).
4Significant differences between all race and Hispanic-origin groups (p < 0.05).
5People of Hispanic origin may be of any race.
NOTES: Percentages may not add to 100 due to rounding. All differences between source of payment groups within a race and Hispanic origin group are significant (p < 0.05). Access data table for Figure 2.
SOURCE: National Center for Health Statistics, National Vital Statistics System, Natality data file.
Deliveries to mothers under age 25 were more likely to be covered by Medicaid, while those to mothers aged 25 and over were more likely to be covered by private insurance.
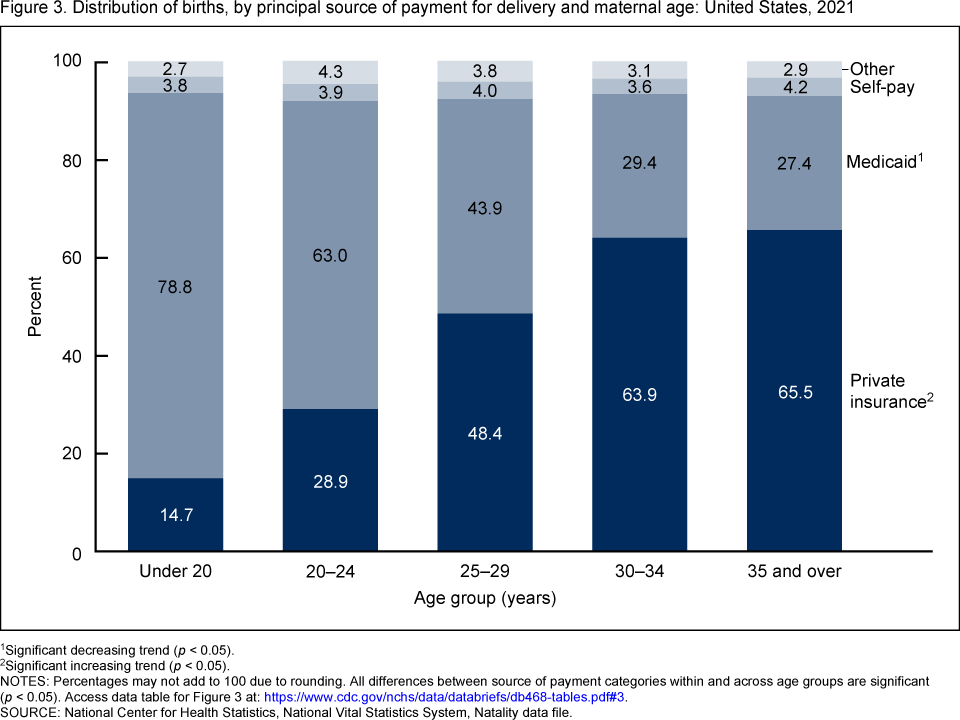
- Younger mothers were more likely to be covered by Medicaid as the source of payment, while older mothers were more likely to be covered by private insurance. For example, mothers under age 20 were nearly three times more likely to be covered by Medicaid (78.8%) than mothers aged 35 and over (27.4%) (Figure 3).
- Coverage by private insurance rose with age, from 14.7% for mothers under age 20 to 65.5% for mothers aged 35 and over.
- The level of coverage from other sources of payment ranged from 2.7% for mothers under 20 to 4.3% for mothers aged 20–24. Self-pay was lowest for mothers aged 30–34 (3.6%) and highest for mothers aged 35 and over (4.2%).
Figure 3. Distribution of births, by principal source of payment for delivery and maternal age: United States, 2021
1Significant decreasing trend (p < 0.05).
2Significant increasing trend (p < 0.05).
NOTES: Percentages may not add to 100 due to rounding. All differences between source of payment categories within and across age groups are significant (p < 0.05). Access data table for Figure 3.
SOURCE: National Center for Health Statistics, National Vital Statistics System, Natality data file.
Coverage by private insurance rose with increasing educational attainment, while self-pay and Medicaid coverage declined.
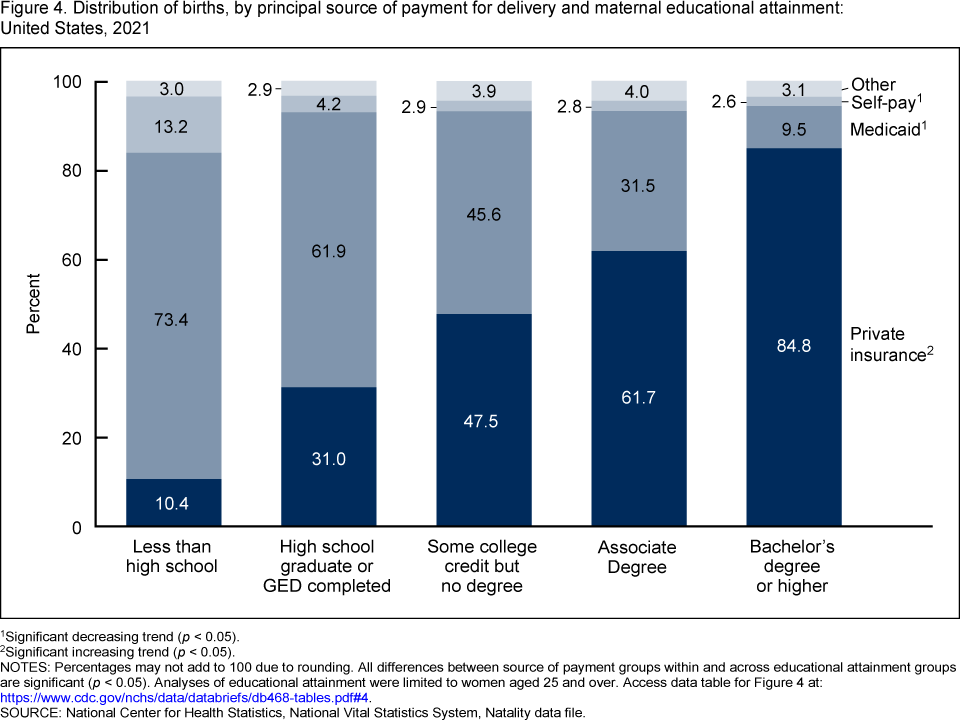
- Deliveries to mothers aged 25 and over with higher educational attainment were more likely to be covered by private insurance, while mothers with lower levels of educational attainment were more likely to be covered by Medicaid. For example, mothers with a bachelor’s degree or higher were eight times more likely to be covered by private insurance (84.8%) than mothers with less than a high school education (10.4%) (Figure 4).
- The percentage of mothers covered by other payment sources ranged from 2.9% (high school graduate or GED completed) to 4.0% (associate degree).
- Mothers with less than a high school education were the most likely to self-pay for the delivery (13.2%), while mothers with a bachelor’s degree or higher were least
likely to self-pay (2.6%).
Figure 4. Distribution of births, by principal source of payment for delivery and maternal educational attainment: United States, 2021
1Significant decreasing trend (p < 0.05).
2Significant increasing trend (p < 0.05).
NOTES: Percentages may not add to 100 due to rounding. All differences between source of payment groups within and across educational attainment groups are significant (p < 0.05). Analyses of educational attainment were limited to women aged 25 and over. Access data table for Figure 4.
SOURCE: National Center for Health Statistics, National Vital Statistics System, Natality data file.
Summary
About 96% of women had healthcare coverage for their delivery in 2021, including 51.7% through private insurance, 41.0% through Medicaid, and 3.4% through other types of coverage. The remaining 3.9% were “self-pay” and likely to be uninsured at the time of delivery. This distribution has essentially remained the same since 2016, when data on the principal source of payment for the delivery became available (3–6). Private insurance was the most common primary source of payment for American Indian or Alaska Native, Asian, Native Hawaiian or Other Pacific Islander, and White mothers, and for mothers aged 25 and over and those with higher levels of educational attainment. Medicaid was the most common primary source of payment for Black and Hispanic mothers, mothers under age 25, and those with lower levels of educational attainment. Nearly 4% of mothers self-paid for their delivery, with the highest rates among mothers with less than a high school education and Hispanic and Native Hawaiian or Other Pacific Islander mothers. Mothers who self-pay for their delivery are more likely to receive late or no prenatal care than women with some source of healthcare coverage (1). Healthcare coverage provides the services needed to maximize the likelihood of a healthy pregnancy and baby (7).
Definitions
Educational attainment: The highest degree or level of school completed by the mother at the time of birth. The education categories are: less than high school, high school graduate or GED completed, some college credit but no degree, associate degree, and bachelor’s degree or higher.
Principal source of payment for the delivery: The principal form of payment for the delivery at the time of delivery. Four options for source of payment at delivery are identified in a checkbox format on the U.S. Standard Certificate of Live Birth: 1) private insurance, 2) Medicaid, 3) self-pay, and 4) other.
- Private insurance: Providers such as Blue Cross Blue Shield, Aetna.
- Medicaid: Includes state programs comparable with Medicaid.
- Self-pay: No third-party payer identified; generally considered uninsured.
- Other: Includes Indian Health Service, TRICARE (formerly known as CHAMPUS), other government programs, and miscellaneous payment sources.
Data source and methods
This report uses data from the Natality data file from the National Vital Statistics System. The vital statistics natality file is based on information from birth certificates and includes information for all births occurring in the United States (8). The race and Hispanic-origin groups shown in this report follow the 1997 Office of Management and Budget standards and differ from the bridged-race categories in reports before 2016 (8). These groups are the six largest race and Hispanic-origin groups (Hispanic, American Indian or Alaska Native non-Hispanic, Asian non-Hispanic, Black non-Hispanic, Native Hawaiian or Other Pacific Islander non-Hispanic, and White non-Hispanic). Analyses of educational attainment were limited to women aged 25 and over. References to differences in percentages indicate differences are statistically significant at the 0.05 level based on a two-tailed z test. References to decreasing or increasing trends are statistically significant at the 0.05 level and assessed using the Cochran–Armitage test for trends, a modified chi-squared test. Computations exclude records for which information is unknown.
About the authors
Claudia P. Valenzuela and Michelle J.K. Osterman are with the National Center for Health Statistics, Division of Vital Statistics, Reproductive Statistics Branch.
References
- Henry J. Kaiser Family Foundation. Women’s health insurance coverage. 2022.
- Martin JA, Hamilton BE, Osterman MJK, Driscoll AK, Drake P. Births: Final data for 2016. National Vital Statistics Reports; vol 67 no 1. Hyattsville, MD: National Center for Health Statistics. 2018.
- Martin JA, Hamilton BE, Osterman MJK, Driscoll AK, Drake P. Births: Final data for 2017. National Vital Statistics Reports; vol 67 no 8. Hyattsville, MD: National Center for Health Statistics. 2018.
- Martin JA, Hamilton BE, Osterman MJK, Driscoll AK. Births: Final data for 2018. National Vital Statistics Reports; vol 68 no 13. Hyattsville, MD: National Center for Health Statistics. 2019.
- Martin JA, Hamilton BE, Osterman MJK, Driscoll AK. Births: Final data for 2019. National Vital Statistics Reports; vol 70 no 2. Hyattsville, MD: National Center for Health Statistics. 2021. DOI: https://dx.doi.org/10.15620/cdc:100472.
- Osterman MJK, Hamilton BE, Martin JA, Driscoll AK, Valenzuela CP. Births: Final data for 2020. National Vital Statistics Reports; vol 70 no 17. Hyattsville, MD: National Center for Health Statistics. 2022. DOI: https://dx.doi.org/10.15620/cdc:112078.
- Osterman MJK, Martin JA. Timing and adequacy of prenatal care in the United States, 2016. National Vital Statistics Reports; vol 67 no 3. Hyattsville, MD: National Center for Health Statistics. 2018.
- National Center for Health Statistics. User guide to the 2021 natality public use file.
Suggested citation
Valenzuela CP, Osterman MJK. Characteristics of mothers by source of payment for the delivery: United States, 2021. NCHS Data Brief, no 468. Hyattsville, MD: National Center for Health Statistics. 2023. DOI: https://dx.doi.org/10.15620/cdc:127266.
Copyright information
All material appearing in this report is in the public domain and may be reproduced or copied without permission; citation as to source, however, is appreciated.
National Center for Health Statistics
Brian C. Moyer, Ph.D., Director
Amy M. Branum, Ph.D., Associate Director for Science
Division of Vital Statistics
Steven Schwartz, Ph.D., Director
Andrés A. Berruti, Ph.D., M.A., Associate Director for Science