Diagnosed Allergic Conditions in Children Aged 0–17 Years: United States, 2021
NCHS Data Brief No. 459, January 2023
PDF Version (486 KB) | Visual Gallery
Benjamin Zablotsky, Ph.D., Lindsey I. Black, M.P.H., and Lara J. Akinbami, M.D.
- Key findings
- In 2021, just over one-quarter of children in the United States had at least one allergic condition.
- The percentage of children with a seasonal allergy varied by sex, age, and race and Hispanic origin.
- The percentage of children with eczema varied by age and race and Hispanic origin.
- The percentage of children with eczema varied by age and race and Hispanic origin.
- Summary
Data from the National Health Interview Survey
- In 2021, 18.9% of children had a seasonal allergy, 10.8% had eczema, and 5.8% had a food allergy.
- Boys (20.0%) were more likely to have a seasonal allergy than girls (17.7%).
- The percentage of children who had eczema varied by age, from 10.4% in children aged 0–5 years to 12.1% in those aged 6–11 and 9.8% in those aged 12–17.
- Non-Hispanic Black children were more likely than non-Hispanic White and Hispanic children to have a food allergy.
The percentage of children with certain allergic conditions has increased over previous decades (1,2). Seasonal allergies, which includes hay fever, allergic rhinitis, and allergic conjunctivitis, causes sneezing, cough, runny nose, and itchy eyes. Eczema, also known as atopic dermatitis, causes itchy, bumpy rashes and thickened skin that can appear anywhere on the body. Food allergies can cause hives, vomiting, trouble breathing, or throat tightening. Children with allergic conditions may have increased healthcare use and decreased quality of life (3). Food allergies can be life threatening (4). This report describes the percentage of children who had diagnosed seasonal allergy, eczema, or food allergy by sex, age, and race and Hispanic origin from the 2021 National Health Interview Survey (NHIS).
Keywords: seasonal allergies, eczema, food allergy, National Health Interview Survey
In 2021, just over one-quarter of children in the United States had at least one allergic condition.
- In 2021, 27.2% of children had one or more selected allergic conditions. About 1 in 5 children had a seasonal allergy (18.9%), 1 in 10 had eczema (10.8%), and 1 in 20 had a food allergy (5.8%) (Figure 1).
Figure 1. Percentage of children aged 0–17 years with a diagnosed seasonal allergy, eczema, food allergy, or any of these three allergic conditions: United States, 2021
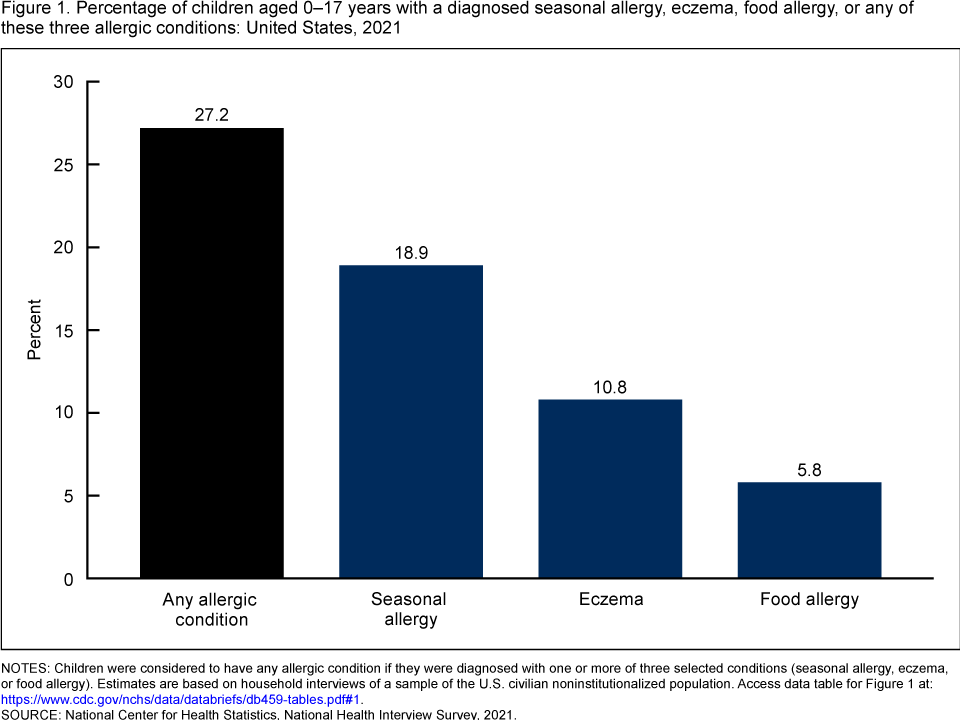
NOTES: Children were considered to have any allergic condition if they were diagnosed with one or more of three selected conditions (seasonal allergy, eczema, or food allergy). Estimates are based on household interviews of a sample of the U.S. civilian noninstitutionalized population. Access data table for Figure 1.
SOURCE: National Center for Health Statistics, National Health Interview Survey, 2021.
The percentage of children with a seasonal allergy varied by sex, age, and race and Hispanic origin.
- Boys (20.0%) were more likely to have a seasonal allergy than girls (17.7%) (Figure 2).
- Children aged 0–5 years (10.4%) were less likely to have a seasonal allergy than children aged 6–11 (21.3%) or 12–17 (24.2%).
- Non-Hispanic Black (21.3%) and non-Hispanic White (20.4%) children were more likely to have a seasonal allergy than Hispanic (15.3%) and non-Hispanic Asian (11.0%) children.
- Hispanic children were more likely to have a seasonal allergy than non-Hispanic Asian children.
Figure 2. Percentage of children aged 0–17 years with a diagnosed seasonal allergy, by sex, age, and race and Hispanic origin: United States, 2021
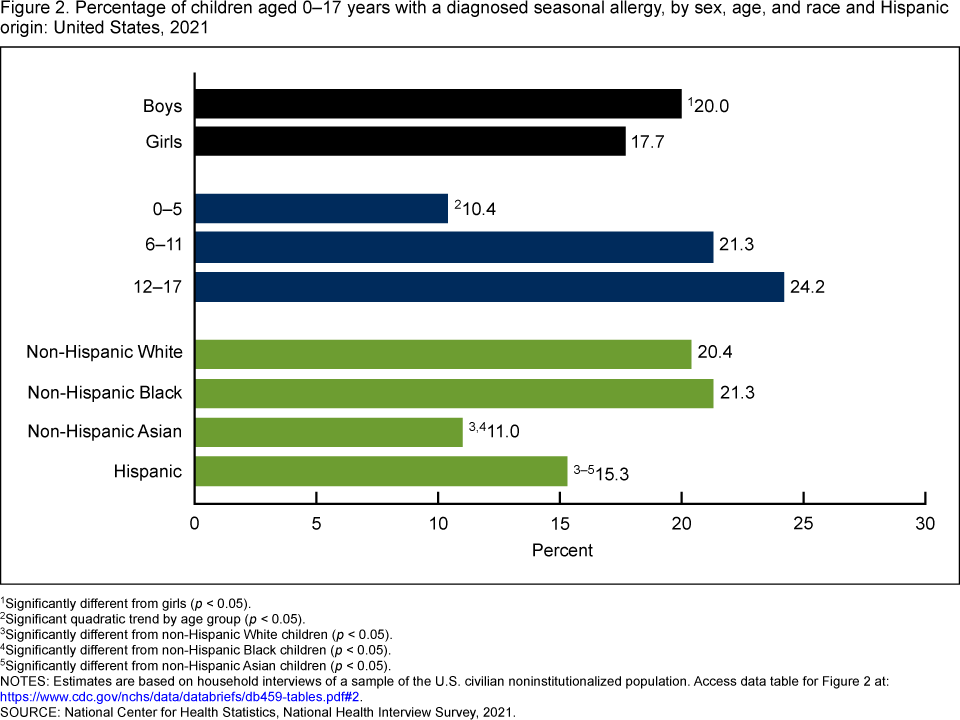
1Significantly different from girls (p < 0.05).
2Significant quadratic trend by age group (p < 0.05).
3Significantly different from non-Hispanic White children (p < 0.05).
4Significantly different from non-Hispanic Black children (p < 0.05).
5Significantly different from non-Hispanic Asian children (p < 0.05).
NOTES: Estimates are based on household interviews of a sample of the U.S. civilian noninstitutionalized population. Access data table for Figure 2.
SOURCE: National Center for Health Statistics, National Health Interview Survey, 2021.
The percentage of children with eczema varied by age and race and Hispanic origin.
- The percentage of children with eczema was the same for boys and girls (10.8%) (Figure 3).
- The percentage of children with eczema varied by age. It was highest in children aged 6–11 years (12.1%), followed by children aged 0–5 (10.4%) and 12–17 (9.8%).
- Non-Hispanic Black children (14.2%) were more likely to have eczema than non-Hispanic White (10.2%), Hispanic (9.5%), and non-Hispanic Asian (9.0%) children.
Figure 3. Percentage of children aged 0–17 years with diagnosed eczema, by sex, age, and race and Hispanic origin: United States, 2021
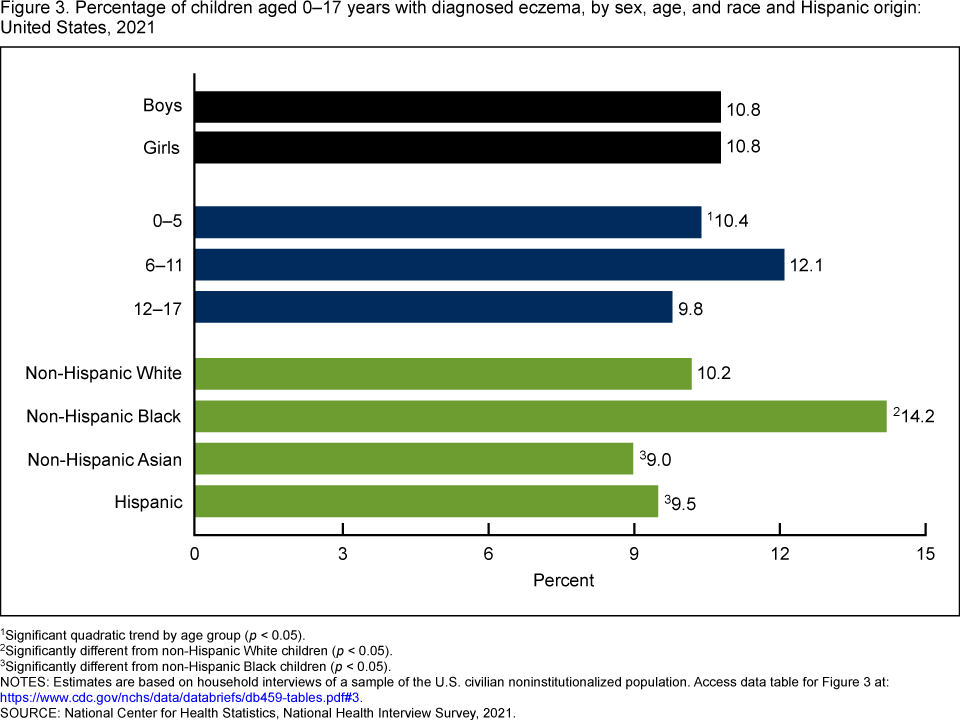
1Significant quadratic trend by age group (p < 0.05).
2Significantly different from non-Hispanic White children (p < 0.05).
3Significantly different from non-Hispanic Black children (p < 0.05).
NOTES: Estimates are based on household interviews of a sample of the U.S. civilian noninstitutionalized population. Access data table for Figure 3.
SOURCE: National Center for Health Statistics, National Health Interview Survey, 2021.
The percentage of children with eczema varied by age and race and Hispanic origin.
- A similar percentage of boys (5.9%) and girls (5.8%) had a food allergy (Figure 4).
- The percentage of children with a food allergy increased with age, from 4.4% in children aged 0–5 years to 5.8% in children aged 6–11 and 7.1% in children aged 12–17.
- Non-Hispanic Black children (7.6%) were more likely to have a food allergy compared with non-Hispanic White (5.3%) and Hispanic (5.0%) children.
- The observed differences between non-Hispanic White and non-Hispanic Asian children and Hispanic and non-Hispanic Asian children were not significant.
Figure 4. Percentage of children aged 0–17 years with a diagnosed food allergy, by sex, age, and race and Hispanic origin: United States, 2021
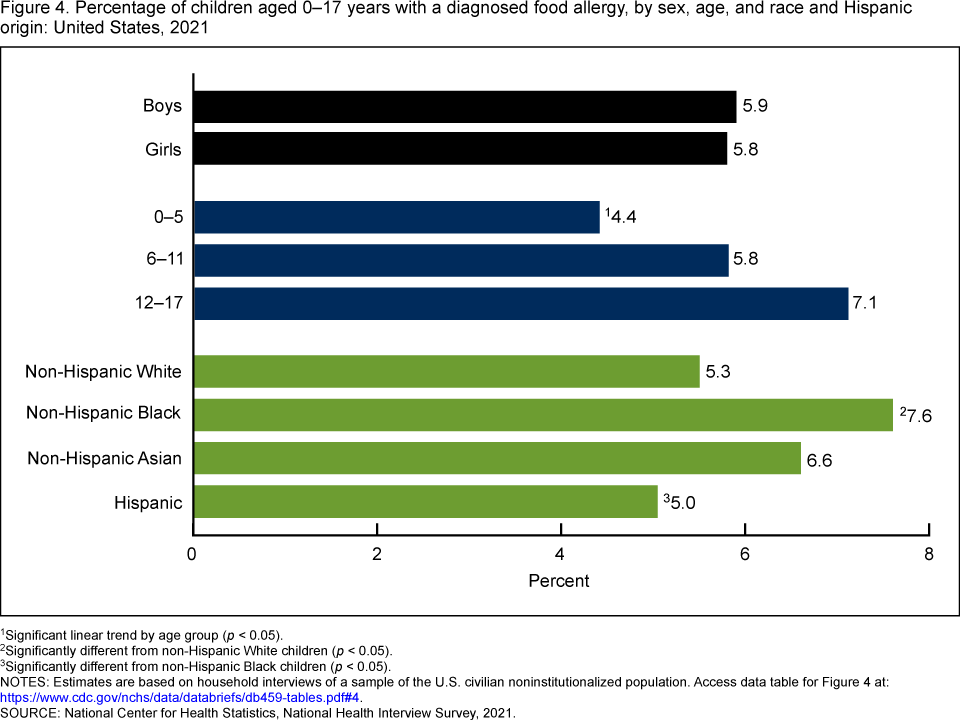
1Significant linear trend by age group (p < 0.05).
2Significantly different from non-Hispanic White children (p < 0.05).
3Significantly different from non-Hispanic Black children (p < 0.05).
NOTES: Estimates are based on household interviews of a sample of the U.S. civilian noninstitutionalized population. Access data table for Figure 4.
SOURCE: National Center for Health Statistics, National Health Interview Survey, 2021.
Summary
In 2021, 27.2% of all children had one or more of the three selected diagnosed allergic conditions (seasonal allergies, eczema, and food allergies). Seasonal allergies (18.9%) were the most prevalent, followed by eczema (10.8%) and food allergies (5.8%). Prevalence of diagnosed allergic conditions varied by age, and disparities were found across race and Hispanic-origin groups. Aside from seasonal allergies, which were more likely in boys than girls, there were no differences by sex in the percentage of children with eczema or food allergies. Estimates for allergy prevalence are not directly comparable to those calculated using data before the 2019 redesign of the NHIS questionnaire due to wording changes.
Definitions
Diagnosed allergic conditions: Children were considered to have any allergic condition if they were diagnosed with one or more of three selected conditions: eczema, food allergy, and seasonal allergy.
- Eczema: Based on an affirmative response to both survey questions: “Does [Sample Child] get an itchy rash due to eczema or atopic dermatitis?” and “Have you ever been told by a doctor or other health professional that [Sample Child] had eczema or atopic dermatitis?”
- Food allergy: Based on an affirmative response to both survey questions: “Does [Sample Child] have an allergy to one or more foods?” and “Have you ever been told by a doctor or other health professional that [Sample Child] had an allergy to one or more foods?”
- Seasonal allergy: Based on an affirmative response to both survey questions: “Does [Sample Child] get symptoms such as sneezing, runny nose, or itchy or watery eyes due to hay fever, seasonal, or year-round allergies?” and “Have you ever been told by a doctor or other health professional that [Sample Child] had hay fever, seasonal, or year-round allergies?”
Race and Hispanic origin: Children categorized as Hispanic may be of any race or combination of races. Children categorized as non-Hispanic White, non-Hispanic Black, and non-Hispanic Asian indicated only one race. Estimates for non-Hispanic children of races other than non-Hispanic White, non-Hispanic Black, or non-Hispanic Asian, and those of multiple races, are not shown but are included in total estimates. Analyses were limited to the race and Hispanic-origin groups for which data were reliable and sufficiently powered for group comparisons.
Data source and methods
Data from the 2021 NHIS were used for this analysis. NHIS is a nationally representative household survey of the U.S. civilian noninstitutionalized population. It is conducted continuously throughout the year by the National Center for Health Statistics (NCHS). Interviews are typically conducted in respondents’ homes, but follow-ups to complete interviews may be conducted over the telephone. Because of the COVID-19 pandemic, interviewing procedures were disrupted, and during 2021, 61.4% of Sample Child interviews were conducted at least partially by telephone (5). For more information about NHIS, visit https://www.cdc.gov/nchs/nhis.htm.
Point estimates and the corresponding confidence intervals were calculated using SAS-callable SUDAAN software (6) to account for the complex sample design of NHIS. All estimates are based on parent or guardian report and meet NCHS data presentation standards for proportions (7). Differences between percentages were evaluated using two-sided significance tests at the 0.05 level. Trends by age group were evaluated using orthogonal polynomials in logistic regression.
About the authors
Benjamin Zablotsky and Lindsey I. Black are with the National Center for Health Statistics (NCHS), Division of Health Interview Statistics. Lara J. Akinbami is with NCHS, Division of Health and Nutri-tion Examination Surveys.
References
- Jackson KD, Howie LD, Akinbami LJ. Trends in allergic conditions among children: United States, 1997–2011. NCHS Data Brief, no 121. Hyattsville, MD: National Center for Health Statistics. 2013.
- Keet CA, Savage JH, Seopaul S, Peng RD, Wood RA, Matsui EC. Temporal trends and racial/ethnic disparity in self-reported pediatric food allergy in the United States. Ann Allergy Asthma Immunol 112(3):222–9. 2014.
- Blaiss MS, Hammerby E, Robinson S, Kennedy-Martin T, Buchs S. The burden of allergic rhinitis and allergic rhinoconjunctivitis on adolescents: A literature review. Ann Allergy Asthma Immunol 121(1):43–52. 2018.
- Gupta RS, Warren CM, Smith BM, Blumenstock JA, Jiang J, Davis MM, Nadeau KC. The public health impact of parent-reported childhood food allergies in the United States. Pediatrics 142(6):e20181235. 2018.
- National Center for Health Statistics. National Health Interview Survey: 2021 survey description. 2022.
- RTI International. SUDAAN (Release 11.0.3) [computer software]. 2018.
- Parker JD, Talih M, Malec DJ, Beresovsky V, Carroll M, Gonzalez JF Jr, et al. National Center for Health Statistics data presentation standards for proportions. National Center for Health Statistics. Vital Health Stat 2(175). 2017.
Suggested citation
Zablotsky B, Black LI, Akinbami LJ. Diagnosed allergic conditions in children aged 0–17 years: United States, 2021. NCHS Data Brief, no 459. Hyattsville, MD: National Center for Health Statistics. 2023. DOI: https://dx.doi.org/10.15620/cdc:123250.
Copyright information
All material appearing in this report is in the public domain and may be reproduced or copied without permission; citation as to source, however, is appreciated.
National Center for Health Statistics
Brian C. Moyer, Ph.D., Director
Amy M. Branum, Ph.D., Associate Director for Science
Division of Health Interview Statistics
Stephen J. Blumberg, Ph.D., Director
Anjel Vahratian, Ph.D., M.P.H., Associate Director for Science
Division of Health and Nutrition Examination Surveys
Ryne Paulose-Ram, M.A., Ph.D., Acting Director
Lara J. Akinbami, M.D., Acting Associate Director for Science