Urban–Rural Differences in Drug Overdose Death Rates, 2020
NCHS Data Brief No. 440, July 2022
PDF Version (565 KB)
Merianne Rose Spencer, M.P.H., Matthew F. Garnett, M.P.H., and Arialdi M. Miniño, M.P.H.
- Key findings
- In 2020, the drug overdose rate for males was higher in urban counties, while the rate for females was higher in rural counties.
- Drug overdose death rates among non-Hispanic Black, Hispanic, and non-Hispanic White people were higher in urban counties than in rural counties.
- Drug overdose death rates by type of drug varied by urbanicity.
- In 2020, rates of drug overdose deaths were higher in urban counties than in rural counties in 23 states.
- Summary
Data from the National Vital Statistics System
- In 2020, the age-adjusted rate of drug overdose deaths was 28.6 per 100,000 standard population in urban counties and 26.2 in rural counties.
- For non-Hispanic Black people, the rate of drug overdose deaths in urban counties was nearly double the rate in rural counties.
- In 2020, the rate of deaths involving synthetic opioids, which includes fentanyl, fentanyl analogs, and tramadol, was higher in urban counties (18.3) than in rural counties (14.3).
- Compared with rural counties, urban counties had higher drug overdose death rates in 23 states and lower rates in 8 states in 2020.
Drug overdose death rates, which have been rising over the past decade, differ by urban and rural counties across the United States (1–4). A previous report demonstrated higher drug overdose death rates in urban counties by various demographic and geographic characteristics (4). This report uses the most recent final mortality data from the National Vital Statistics System (NVSS) to describe urban and rural differences in drug overdose death rates in 2020 by sex, race and Hispanic origin, and selected types of opioids and stimulants.
Keywords: health disparity, poisoning, opioids, mortality, National Vital Statistics System
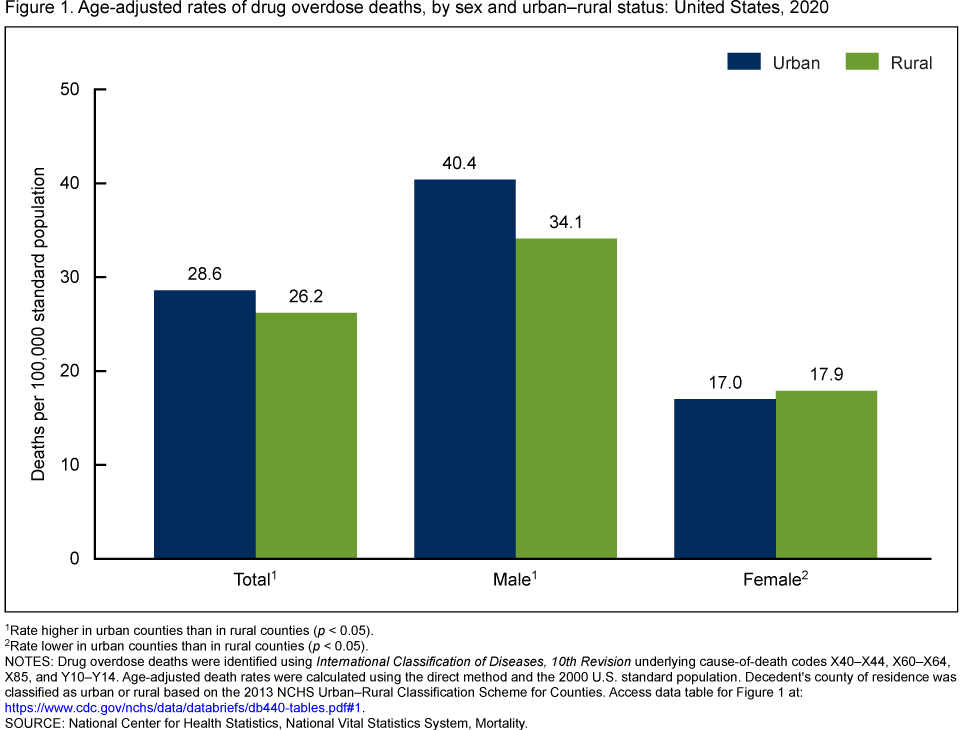
In 2020, the drug overdose rate for males was higher in urban counties, while the rate for females was higher in rural counties.
- Overall, the rate for drug overdose deaths was higher in urban counties (28.6 per 100,000 standard population) than in rural counties (26.2) (Figure 1).
- The rate of drug overdose deaths for males was 18% higher in urban counties (40.4) than in rural counties (34.1).
- The rate of drug overdose deaths for females was 5% lower in urban counties (17.0) than in rural counties (17.9).
- In both urban and rural counties, rates for males were about twice as high as rates for females.
Figure 1. Age-adjusted rates of drug overdose deaths, by sex and urban–rural status: United States, 2020
1Rate higher in urban counties than in rural counties (p < 0.05).
2Rate lower in urban counties than in rural counties (p < 0.05).
NOTES: Drug overdose deaths were identified using International Classification of Diseases, 10th Revision underlying cause-of-death codes X40–X44, X60–X64, X85, and Y10–Y14. Age-adjusted death rates were calculated using the direct method and the 2000 U.S. standard population. Decedent’s county of residence was classified as urban or rural based on the 2013 NCHS Urban–Rural Classification Scheme for Counties. Access data table for Figure 1 .
SOURCE: National Center for Health Statistics, National Vital Statistics System, Mortality.
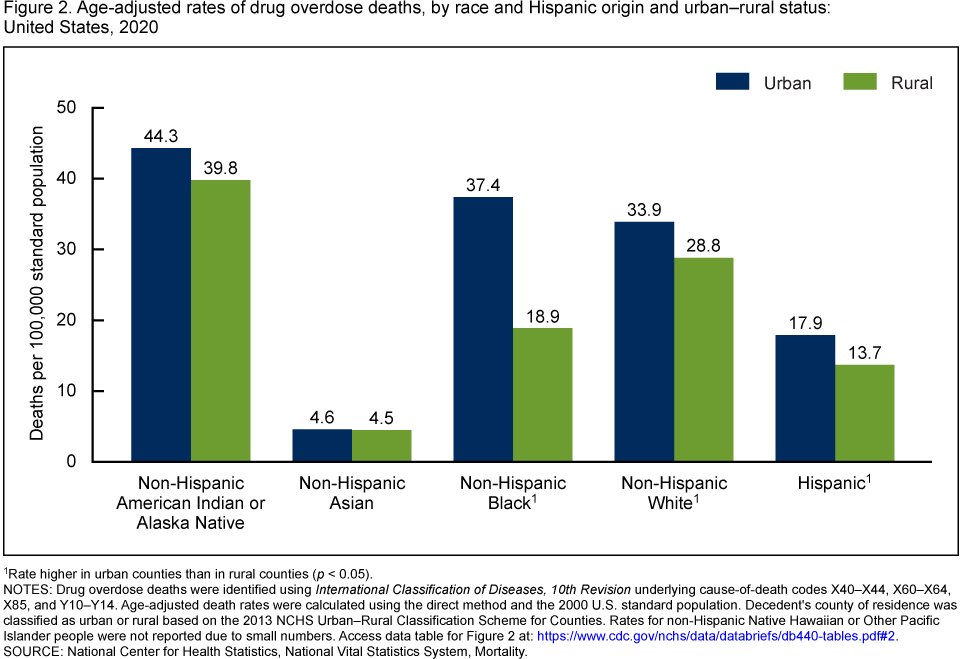
Drug overdose death rates among non-Hispanic Black, Hispanic, and non-Hispanic White people were higher in urban counties than in rural counties.
- Non-Hispanic American Indian or Alaska Native (AIAN) people had the highest rates of drug overdose deaths in urban and rural counties, at 44.3 per 100,000 and 39.8, respectively (Figure 2).
- Non-Hispanic Asian people had the lowest rates in urban and rural counties, at 4.6 and 4.5, respectively.
- Rates were higher in urban counties than in rural counties among non-Hispanic Black (37.4 and 18.9, respectively), Hispanic (17.9 and 13.7, respectively), and non-Hispanic White (33.9 and 28.8, respectively) people.
Figure 2. Age-adjusted rates of drug overdose deaths, by race and Hispanic origin and urban–rural status: United States, 2020
1Rate higher in urban counties than in rural counties (p < 0.05).
NOTES: Drug overdose deaths were identified using International Classification of Diseases, 10th Revision underlying cause-of-death codes X40–X44, X60–X64, X85, and Y10–Y14. Age-adjusted death rates were calculated using the direct method and the 2000 U.S. standard population. Decedent’s county of residence was classified as urban or rural based on the 2013 NCHS Urban–Rural Classification Scheme for Counties. Rates for non-Hispanic Native Hawaiian or Other Pacific Islander people were not reported due to small numbers. Access data table for Figure 2.
SOURCE: National Center for Health Statistics, National Vital Statistics System, Mortality.
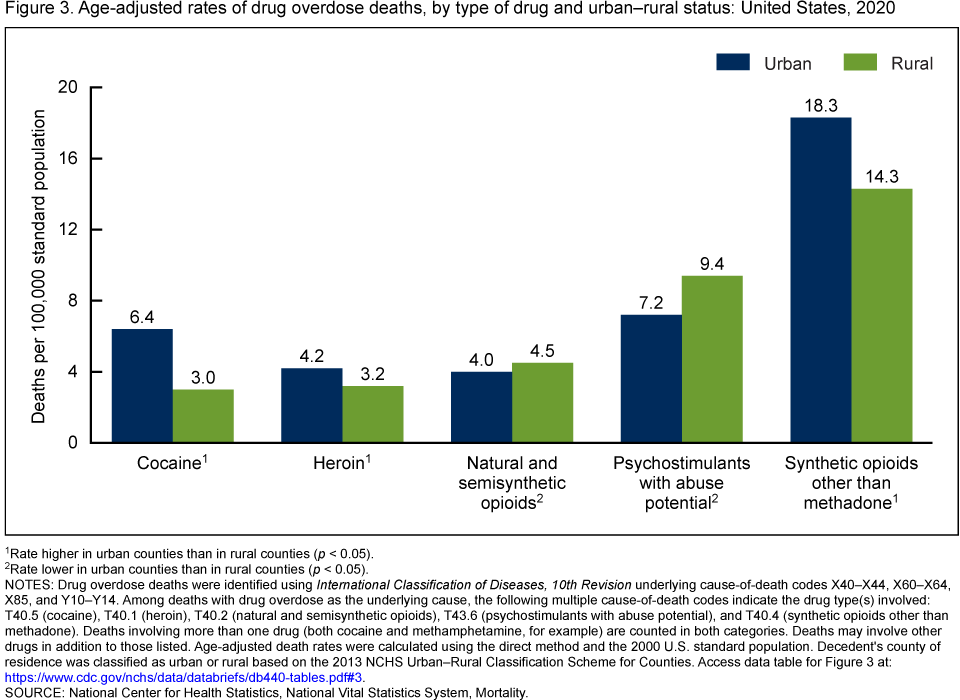
Drug overdose death rates by type of drug varied by urbanicity.
- In 2020, the rate of drug overdose deaths involving cocaine, heroin, and synthetic opioids other than methadone, which includes fentanyl, fentanyl analogs, and tramadol, was higher in urban counties than in rural counties (Figure 3).
- The rate of deaths involving cocaine in urban counties (6.4 per 100,000) was more than double the rate in rural counties (3.0). The rate of deaths involving heroin in urban counties (4.2) was 31% higher than the rate in rural counties (3.2).
- The rate of deaths involving synthetic opioids other than methadone was 28% higher in urban counties than in rural counties, at 18.3 and 14.3, respectively.
- The rate of deaths involving psychostimulants with abuse potential was 31% higher in rural counties (9.4) than in urban counties (7.2), and the rate of deaths involving natural and semisynthetic opioids was nearly 13% higher in rural counties (4.5) than in urban counties (4.0).
Figure 3. Age-adjusted rates of drug overdose deaths, by type of drug and urban–rural status: United States, 2020
1Rate higher in urban counties than in rural counties (p < 0.05).
2Rate lower in urban counties than in rural counties (p < 0.05).
NOTES: Drug overdose deaths were identified using International Classification of Diseases, 10th Revision underlying cause-of-death codes X40–X44, X60–X64, X85, and Y10–Y14. Among deaths with drug overdose as the underlying cause, the following multiple cause-of-death codes indicate the drug type(s) involved: T40.5 (cocaine), T40.1 (heroin), T40.2 (natural and semisynthetic opioids), T43.6 (psychostimulants with abuse potential), and T40.4 (synthetic opioids other than methadone). Deaths involving more than one drug (both cocaine and methamphetamine, for example) are counted in both categories. Deaths may involve other drugs in addition to those listed. Age-adjusted death rates were calculated using the direct method and the 2000 U.S. standard population. Decedent’s county of residence was classified as urban or rural based on the 2013 NCHS Urban–Rural Classification Scheme for Counties. Access data table for Figure 3.
SOURCE: National Center for Health Statistics, National Vital Statistics System, Mortality.
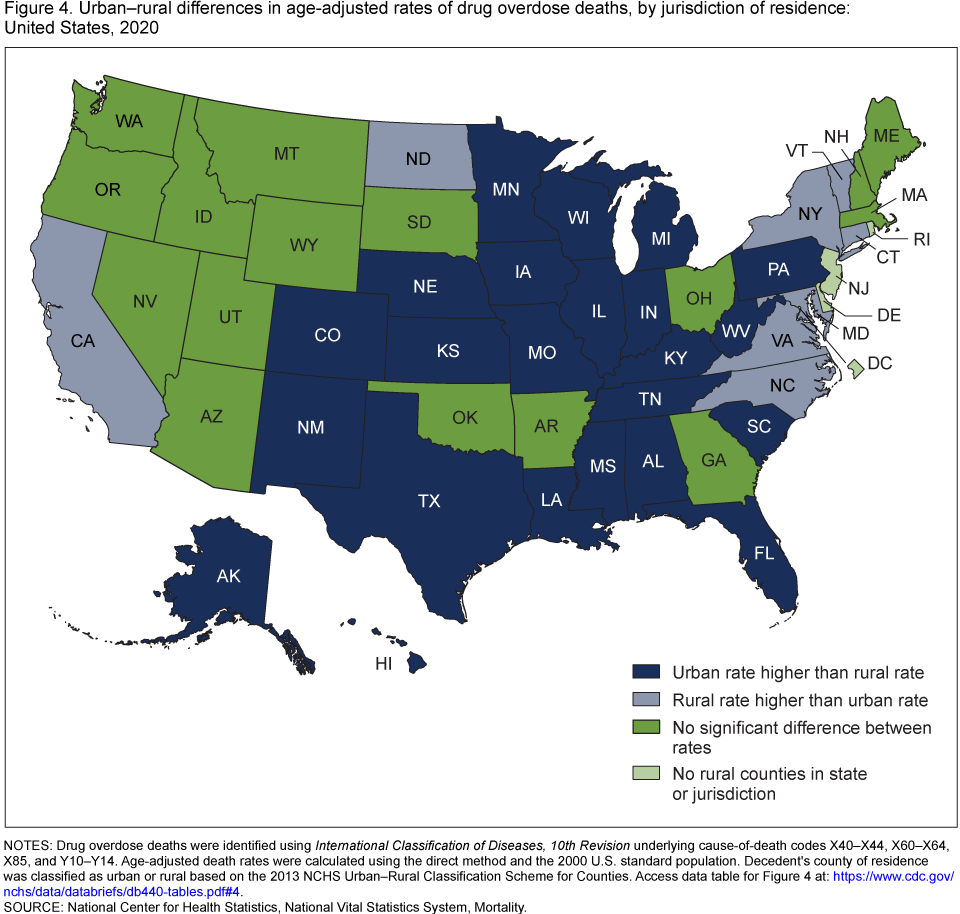
In 2020, rates of drug overdose deaths were higher in urban counties than in rural counties in 23 states.
- Rates were higher in urban counties than in rural counties for Alabama, Alaska, Colorado, Florida, Hawaii, Illinois, Indiana, Iowa, Kansas, Kentucky, Louisiana, Michigan, Minnesota, Mississippi, Missouri, Nebraska, New Mexico, Pennsylvania, South Carolina, Tennessee, Texas, West Virginia, and Wisconsin (Figure 4).
- Eight states had drug overdose death rates that were higher in rural counties than in urban counties: California, Connecticut, Maryland, New York, North Carolina, North Dakota, Vermont, and Virginia.
- Urban and rural rates were similar in 16 states: Arizona, Arkansas, Georgia, Idaho, Maine, Massachusetts, Montana, Nevada, New Hampshire, Ohio, Oklahoma, Oregon, South Dakota, Utah, Washington, and Wyoming.
Figure 4. Urban–rural differences in age-adjusted rates of drug overdose deaths, by jurisdiction of residence: United States, 2020
NOTES: Drug overdose deaths were identified using International Classification of Diseases, 10th Revision underlying cause-of-death codes X40–X44, X60–X64, X85, and Y10–Y14. Age-adjusted death rates were calculated using the direct method and the 2000 U.S. standard population. Decedent’s county of residence was classified as urban or rural based on the 2013 NCHS Urban–Rural Classification Scheme for Counties. Access data table for Figure 4.
SOURCE: National Center for Health Statistics, National Vital Statistics System, Mortality.
Summary
In 2020, urban–rural differences in age-adjusted drug overdose death rates occurred by sex, race and Hispanic origin, type of drug, and state of residence across the United States. Overall, the rate of drug overdose deaths was higher in urban counties (28.6 per 100,000 standard population) than in rural counties (26.2). The rate for males was 18% higher in urban counties (40.4) than in rural counties (34.1), while the rate for females was 5% lower in urban counties (17.0) than in rural counties (17.9). Rates were higher in urban counties than in rural counties among non-Hispanic Black, non-Hispanic White, and Hispanic people; among non-Hispanic Black people, the rate in urban counties was nearly double the rate of rural counties (37.4 compared with 18.9). Rates of drug overdose deaths involving cocaine, heroin, and synthetic opioids other than methadone were higher in urban than in rural counties. Rates were higher in urban counties than rural counties for 23 states, while rates were lower in urban counties than in rural counties in 8 states.
In addition to differences between rates in urban and rural areas, differences were seen in the rates of drug overdose deaths between demographic subgroups. Males had nearly double the rate of drug overdose deaths compared with females in both urban and rural counties. Non-Hispanic AIAN people had the highest rates of drug overdose deaths in both urban (44.3) and rural (39.8) counties. By type of drug, drug overdose deaths involving synthetic opioids other than methadone had the highest rates in both urban (18.3) and rural (14.3) counties.
Definitions
Drug overdose (poisoning) deaths: Includes deaths resulting from unintentional or intentional overdose of a drug, being given the wrong drug, taking a drug in error, or taking a drug inadvertently.
Natural and semisynthetic opioids: Includes drugs such as morphine, codeine, hydrocodone, and oxycodone.
Synthetic opioids other than methadone: Includes drugs such as fentanyl, fentanyl analogs, and tramadol.
Psychostimulants with abuse potential: Includes drugs such as methamphetamine, amphetamine, and methylphenidate.
Data source and methods
Estimates are based on the NVSS multiple cause-of-death mortality files available on CDC WONDER (5). Drug overdose deaths are defined as having an International Classification of Diseases, 10th Revision (ICD–10) underlying-cause-of-death code of X40–X44 (unintentional), X60–X64 (suicide), X85 (homicide), or Y10–Y14 (undetermined intent) (6). Of the drug overdose deaths in 2020, 91.0% were unintentional, 4.7% were suicides, 4.1% were of undetermined intent, and less than 1.0% were homicides. The type of drug(s) involved were indicated by ICD–10 multiple cause-of-death codes T40.1 (heroin), T40.2 (natural and semisynthetic opioids), T40.4 (synthetic opioids other than methadone), T40.5 (cocaine), and T43.6 (psychostimulants with abuse potential).
Race and Hispanic origin are categorized based on the Office of Management and Budget’s 1997 standards for federal statistical and administrative reporting (7). All of the race categories are single race, meaning that only one race was reported on the death certificate. Data shown for the Hispanic population include people of any race. Death rates for non-Hispanic Asian, non-Hispanic AIAN, and Hispanic people may be affected by misclassification of race and Hispanic origin on death certificates. This misclassification could result in underreporting of deaths for these groups, by about 3% for non-Hispanic Asian and Hispanic people, and by about 33% for non-Hispanic AIAN people (8).
Age-adjusted death rates are calculated using the direct method and adjusted to the 2000 U.S. standard population (9). Pairwise comparisons of rates were conducted using the z test statistic with an alpha level of 0.05 (two-sided) (9).
The decedent’s county of residence is categorized using the 2013 NCHS Urban–Rural Classification Scheme for Counties (10). Counties were classified into six urbanization levels based on metropolitan–nonmetropolitan status, population distribution, and other factors. The four metropolitan categories (large central metropolitan, large fringe metropolitan, medium metropolitan, and small metropolitan) were grouped as urban counties. The two nonmetropolitan categories (micropolitan and noncore) were grouped as rural counties.
Several factors related to death investigation and reporting may affect measurement of death rates involving specific drugs. At autopsy, the substances tested for and the circumstances under which the toxicology tests are performed vary by jurisdiction. This variability is more likely to affect substance-specific death rates than the overall drug overdose death rate. The percentage of drug overdose deaths that identified the specific drugs involved varied by year, ranging from 75% to 79% for 1999 through 2013, and increasing from 81% in 2014 to 94% in 2020. Additionally, drug overdose deaths may involve multiple drugs; consequently, a death might be included in more than one category when describing the rate of drug overdose deaths involving specific drugs. For example, a death that involved both fentanyl and cocaine would be included in both the rate of drug overdose deaths involving synthetic opioids other than methadone and the rate of drug overdose deaths involving cocaine.
About the authors
Merianne Rose Spencer and Matthew F. Garnett are with the National Center for Health Statistics (NCHS), Division of Analysis and Epidemiology. Arialdi M. Miniño is with the NCHS Division of Vital Statistics.
References
- Hedegaard H, Miniño AM, Spencer MR, Warner M. Drug overdose deaths in the United States, 1999–2020. NCHS Data Brief, no 428. Hyattsville, MD: National Center for Health Statistics. 2021. DOI: https://dx.doi.org/10.15620/cdc:112340.
- Ahmad FB, Cisewski JA, Rossen LM, Sutton P. Provisional drug overdose death counts. National Center for Health Statistics. 2021.
- Wilson N, Kariisa M, Seth P, Smith H IV, Davis NL. Drug and opioid-involved overdose deaths—United States, 2017–2018. MMWR 69(11):290–7. 2020.
- Hedegaard H, Spencer MR. Urban–rural differences in drug overdose death rates, 1999–2019. NCHS Data Brief, no 403. Hyattsville, MD: National Center for Health Statistics. 2021. DOI: https://dx.doi.org/10.15620/cdc:102891.
- Centers for Disease Control and Prevention. National Center for Health Statistics: Mortality data on CDC WONDER. Mortality multiple cause files. 2019.
- World Health Organization. International statistical classification of diseases and related health problems, 10th revision (ICD–10). 2008 ed. 2009.
- Office of Management and Budget. Revisions to the standards for the classification of federal data on race and ethnicity. Fed Regist 62(210):58782–90. 1997.
- Arias E, Heron M, Hakes JK. The validity of race and Hispanic-origin reporting on death certificates in the United States: An update. National Center for Health Statistics. Vital Health Stat 2(172). 2016.
- Xu J, Murphy SL, Kochanek KD, Arias E. Deaths: Final data for 2019. National Vital Statistics Reports; vol 70 no 8. Hyattsville, MD: National Center for Health Statistics. 2021. DOI: https://dx.doi.org/10.15620/cdc:106058.
- Ingram DD, Franco SJ. 2013 NCHS urban–rural classification scheme for counties. National Center for Health Statistics. Vital Health Stat 2(166). 2014.
Suggested citation
Spencer MR, Garnett MF, Miniño AM. Urban–rural differences in drug overdose death rates, 2020. NCHS Data Brief, no 440. Hyattsville, MD: National Center for Health Statistics. 2022. DOI: https://dx.doi.org/10.15620/cdc:118601.
Copyright information
All material appearing in this report is in the public domain and may be reproduced or copied without permission; citation as to source, however, is appreciated.
National Center for Health Statistics
Brian C. Moyer, Ph.D., Director
Amy M. Branum, Ph.D., Associate Director for Science
Division of Analysis and Epidemiology
Irma E. Arispe, Ph.D., Director
Kevin C. Heslin, Ph.D., Associate Director for Science
Division of Vital Statistics
Steven Schwartz, Ph.D., Director
Andrés A. Berruti, Ph.D., M.A., Associate Director for Science