Births in the United States, 2020
NCHS Data Brief No. 418, September 2021
PDF Version (339 KB)
Data from the National Vital Statistics System
- The U.S. general fertility rate declined 4%, from 58.3 to 56.0 births per 1,000 women aged 15–44, from 2019 to 2020; rates declined for non-Hispanic white, non-Hispanic black, and Hispanic women.
- Birth rates declined among women of all age groups 15–44 between 2019 and 2020 with the largest declines for women under age 25.
- The low-risk cesarean delivery rate rose from 25.6% in 2019 to 25.9% in 2020 with increases for each race and Hispanic-origin group.
- The U.S. preterm birth rate declined from 10.23% to 10.09% from 2019 to 2020.
This report presents selected highlights from 2020 final birth data on key demographic, health care utilization, and infant health indicators. General fertility rates (births per 1,000 women aged 15–44), age-specific birth rates (births per 1,000 women in specified age group), low-risk (nulliparous, term, singleton, cephalic births) cesarean delivery, and preterm (less than 37 weeks of gestation) birth rates are presented. All indicators are compared between 2019 and 2020 and shown for all births. General fertility rates (GFRs), low-risk cesarean and preterm birth rates are shown for the three largest race and Hispanic-origin groups: non-Hispanic white, non-Hispanic black, and Hispanic. Fertility rates are shown by age of mother.
Key words: general fertility rates, low-risk cesarean delivery, gestational age, National Vital Statistics System
The GFR declined for all three race and Hispanic-origin groups in 2020.
- The GFR for the United States declined 4% in 2020 to 56.0 per 1,000 women aged 15–44 from 58.3 in 2019 (Figure 1).
- GFRs declined for the three largest race and Hispanic-origin groups from 2019 to 2020, down 3% for Hispanic (65.3 to 63.1) women and 4% for non-Hispanic white (55.3 to 53.2) and non-Hispanic black (61.4 to 59.2) women.
- In both 2019 and 2020, the GFR was highest for Hispanic women, followed by non-Hispanic black and non-Hispanic white women.
Figure 1. General fertility rates, by race and Hispanic origin of mother: United States, 2019 and 2020
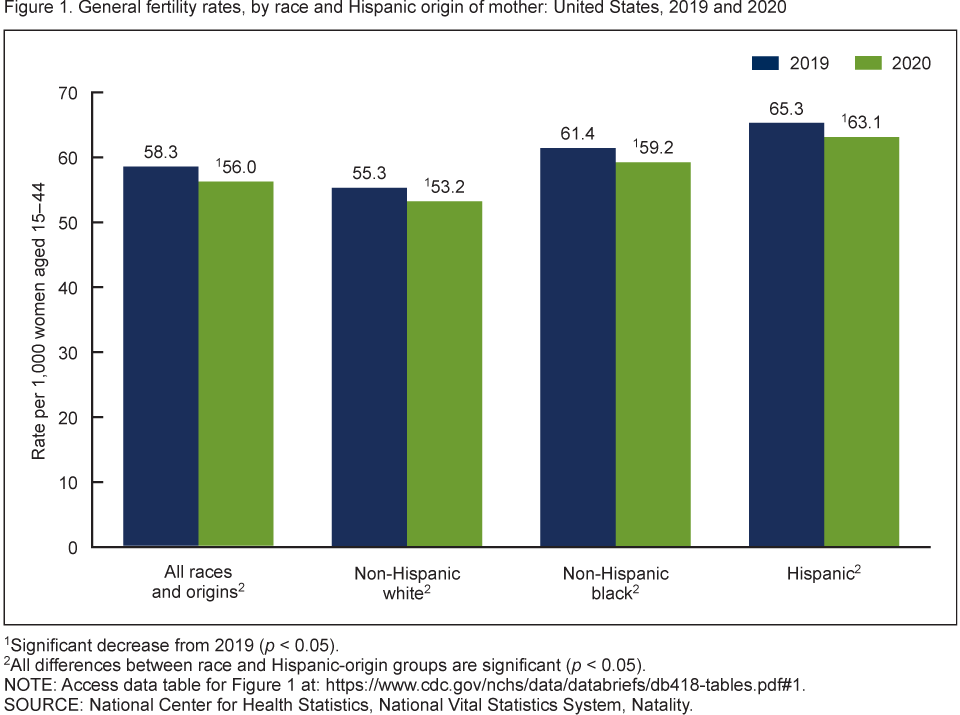
1Significant decrease from 2019 (p < 0.05).
2All differences between race and Hispanic-origin groups are significant (p < 0.05).
NOTE: Access data table for Figure 1.
SOURCE: National Center for Health Statistics, National Vital Statistics System, Natality.
Birth rates declined for all women in all age groups 15–44 in 2020.
- The birth rate for teenagers aged 15–19 declined 8% in 2020 to 15.4 per 1,000 births, from 16.7 in 2019 (Figure 2).
- The birth rate declined by 5% for women aged 20–24, from 66.6 in 2019 to 63.0 in 2020, and by 4% for women aged 25–29, from 93.7 to 90.2.
- For women aged 30–34 the birth rate declined 3%, from 98.3 in 2019 to 94.9 in 2020.
- The birth rate declined 2% from 2019 to 2020 for women aged 35–39, from 52.8 to 51.8 and women aged 40–44, from 12.0 to 11.8.
- Birth rates were highest for women aged 30–34 and lowest for those aged 40–44.
Figure 2. Birth rates, by selected age group: United States, 2019 and 2020
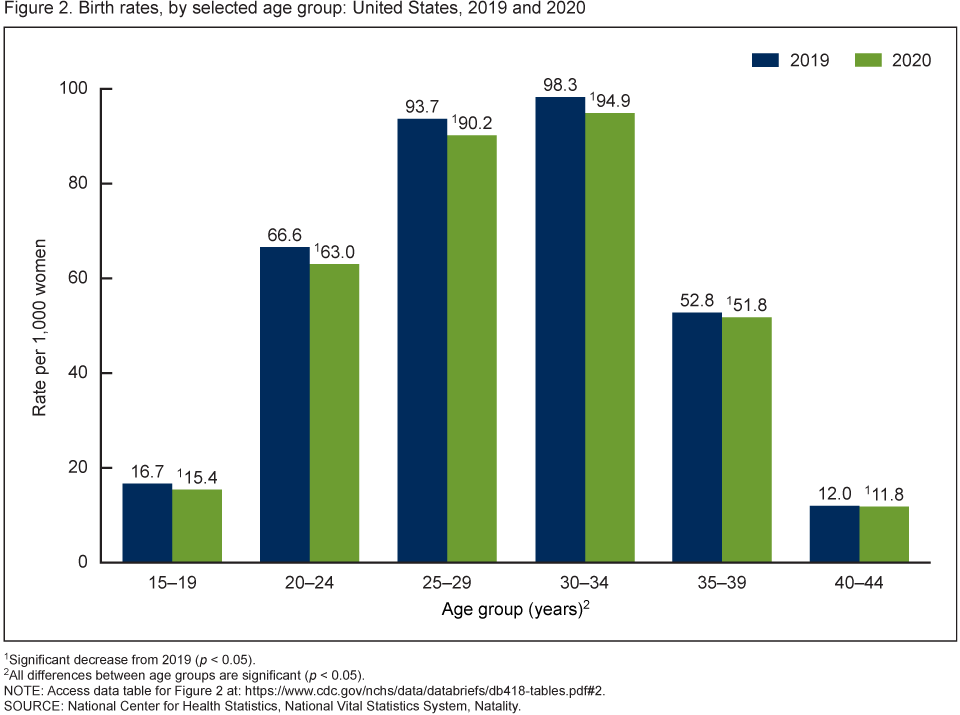
1Significant decrease from 2019 (p < 0.05).
2All differences between age groups are significant (p < 0.05).
NOTE: Access data table for Figure 2.
SOURCE: National Center for Health Statistics, National Vital Statistics System, Natality.
Low-risk cesarean delivery increased in the United States in 2020.
- The low-risk cesarean delivery rate increased to 25.9% in 2020, from 25.6% in 2019, a 1% increase (Figure 3).
- Low-risk cesarean delivery rates increased 2% in 2020 for non-Hispanic black women (30.0% to 30.6%) and 1% for Hispanic (24.8% to 25.1%) and non-Hispanic white (24.7% to 24.9%) women.
- In 2020 and 2019, low-risk cesarean delivery was higher among non-Hispanic black women than among non-Hispanic white and Hispanic women.
Figure 3. Low-risk cesarean delivery, by race and Hispanic origin of mother: United States, 2019 and 2020
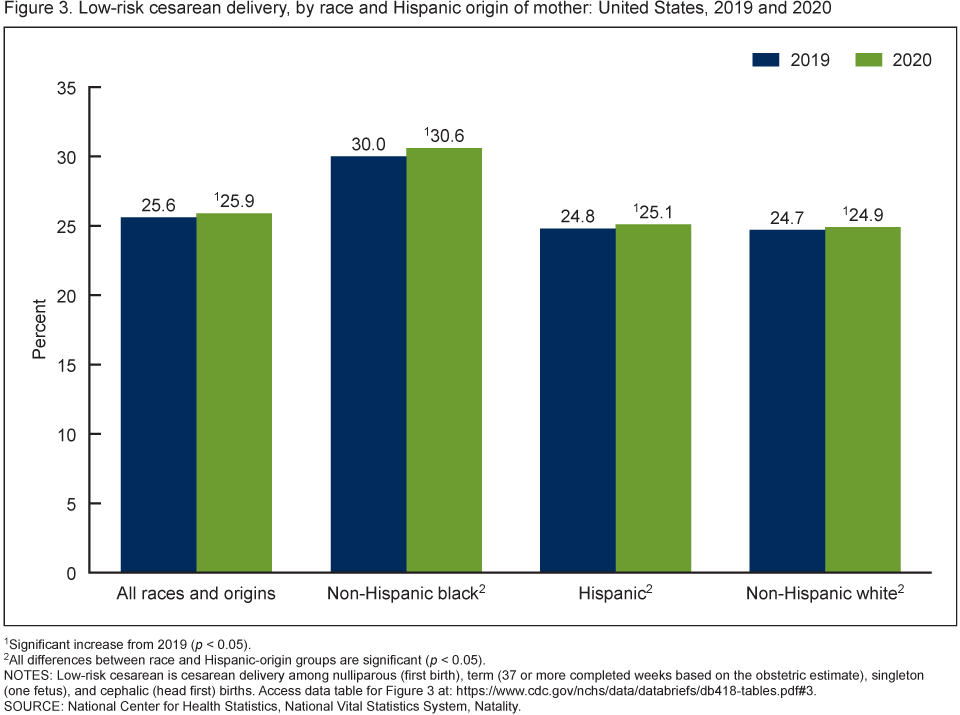
1Significant increase from 2019 (p < 0.05).
2All differences between race and Hispanic-origin groups are significant (p < 0.05).
NOTES: Low-risk cesarean is cesarean delivery among nulliparous (first birth), term (37 or more completed weeks based on the obstetric estimate), singleton (one fetus), and cephalic (head first) births. Access data table for Figure 3.
SOURCE: National Center for Health Statistics, National Vital Statistics System, Natality.
The U.S. preterm birth rate declined 1% between 2019 and 2020.
- The percentage of newborns delivered preterm declined 1% in 2020, to 10.09% from 10.23% in 2019 (Figure 4). Declines were seen in both late (7.46% to 7.40%) and early (2.77% to 2.70%) preterm births.
- Preterm rates declined 2% among births to non-Hispanic white mothers (9.26% to 9.10%) and 1% for Hispanic mothers (9.97% to 9.84%) from 2019 to 2020; the rate for non-Hispanic black mothers was essentially unchanged (14.39% to 14.36%).
- Late preterm births declined among non-Hispanic white mothers between 2019 and 2020 (6.99% to 6.90%); changes in rates for births to non-Hispanic black (9.45% to 9.54%) and Hispanic (7.36% to 7.32%) mothers were not significant.
- Early preterm birth rates declined slightly for each of the race and Hispanic-origin groups from 2019 to 2020.
- Preterm rates for births to non-Hispanic black women were about 50% higher than those for births to non-Hispanic white and Hispanic women in 2020.
Figure 4. Percentage of preterm births, by and race and Hispanic origin of mother: United States, 2019 and 2020
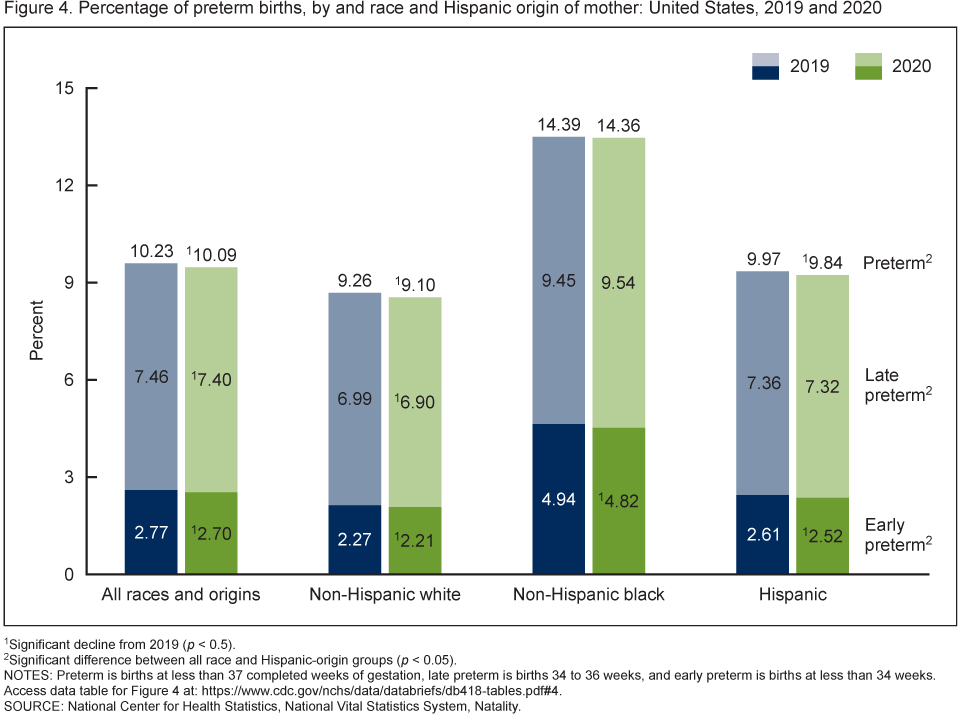
1Significant decline from 2019 (p < 0.05).
2Significant difference between all race and Hispanic-origin groups (p < 0.05).
NOTES: Preterm is births at less than 37 completed weeks of gestation, late preterm is births 34 to 36 weeks, and early preterm is births at less than 34 weeks. Access data table for Figure 4.
SOURCE: National Center for Health Statistics, National Vital Statistics System, Natality.
Summary
Birth certificate data for 2020 show wide-ranging declines in childbearing in the United States. The GFR, which had been on the decline since 2007 (1,2) fell 4% to another all-time low (1–3). Fertility rates were down 3%–4% among the three largest race and Hispanic-origin groups. Birth rates fell among women of all age groups from age 15–44; the decline in the birth rate for women aged 40–44 was the first since 1981 (1–3). The low-risk cesarean rate, which had declined between 2018 and 2019, rose 1% in 2020, to the same level as 2018 (25.9%) with increases seen for each race and Hispanic-origin group (3). The preterm birth rate, which had risen from 2014 to 2019 (3), declined 1% in 2020 with declines seen in both early and late preterm births. Preterm rates declined for births to non-Hispanic white and Hispanic women but were unchanged for births to non-Hispanic black women. Early preterm birth rates were down for each of the race and Hispanic-origin groups.
Definitions
Age-specific birth rates: Births per 1,000 women in the specified age group.
General fertility rate: Number of births per 1,000 women aged 15–44.
Low-risk cesarean delivery rate: Cesarean delivery among nulliparous (first births), term (37 or more completed weeks of gestation), singleton (one fetus), and cephalic (head-first) births.
Preterm birth rate: Births delivered prior to 37 completed weeks of gestation per 100 births. Gestational age is based on the obstetric estimate of gestation.
- Early preterm birth rate: Births delivered at less than 34 completed weeks of gestation per 100 births.
- Late preterm birth rate: Births delivered at 34–36 completed weeks of gestation per 100 births.
Data source and methods
This report uses data from the Natality Data File from the National Vital Statistics System. The vital statistics natality file is based on information derived from birth certificates and includes information for all births occurring in the United States. This Data Brief accompanies the release of the 2020 natality public use file (4). More detailed analysis of the topics presented in this report plus many others such as births by age of mother, tobacco use during pregnancy, pregnancy risk factors, prenatal care timing and utilization, receipt of food from the Special Supplemental Nutrition Program for Women, Infants, and Children (WIC), maternal body mass index, and breastfeeding is possible by using the annual natality files (4).
The race and Hispanic-origin groups shown in this report follow the 1997 standards and differ from the bridged-race categories shown in reports prior to 2016 (1).
References to increases or decreases in rates or percentages indicate differences are statistically significant at the 0.05 level based on a two-tailed z test. Computations exclude records for which information is unknown.
About the authors
Joyce A. Martin, Brady E. Hamilton, and Michelle J.K. Osterman are with the National Center for Health Statistics, Division of Vital Statistics, Reproductive Statistics Branch.
References
- Martin JA, Hamilton BE, Osterman MK, Driscoll AK, Matthews TJ. Births: Final data for 2015. National Vital Statistics Reports; vol 66 no 1. Hyattsville, MD: National Center for Health Statistics. 2017.
- Martin JA, Hamilton BE, Osterman MJK, Driscoll AK. Births: Final data for 2019. National Vital Statistics Reports; vol 70 no 2. Hyattsville, MD: National Center for Health Statistics. 2021. DOI: https://dx.doi.org/10.15620/cdc:100472.
- National Center for Health Statistics. Vital statistics of the United States, 2003, vol I, natality. 2003.
- National Center for Health Statistics. Natality public-use file and CD-ROM. Hyattsville, MD: National Center for Health Statistics. 2021.
Suggested citation
Martin JA, Hamilton BE, Osterman MJK. Births in the United States, 2020. NCHS Data Brief, no 418. Hyattsville, MD: National Center for Health Statistics. 2021. DOI: https://dx.doi.org/10.15620/cdc:109213.
Copyright information
All material appearing in this report is in the public domain and may be reproduced or copied without permission; citation as to source, however, is appreciated.
National Center for Health Statistics
Brian C. Moyer, Ph.D., Director
Amy M. Branum, Ph.D., Associate Director for Science
Division of Vital Statistics
Steven Schwartz, Ph.D., Director
Andrés A. Berruti, Ph.D., M.A., Acting Associate Director for Science