Unintentional Injury Death Rates in Rural and Urban Areas: United States, 1999–2017
- Key findings
- Overall, unintentional injury death rates increased from 1999 through 2017, although trends varied by leading causes of the injury deaths.
- Age-adjusted death rates for motor vehicle traffic injuries were highest in rural counties and lowest in large central metro counties in 2017.
- In 2017 compared with 2014, large fringe metro counties had the largest increase in unintentional drug overdose rates.
- Rural counties had the largest increase in death rates due to unintentional falls between 2014 and 2017.
- Summary
- Definitions
- Data source and methods
- About the authors
- References
- Suggested citation
NCHS Data Brief No. 343, July 2019
PDF Versionpdf icon (481 KB)
R. Henry Olaisen, Ph.D., M.P.H., Lauren M. Rossen, Ph.D., Margaret Warner, Ph.D., and Robert N. Anderson, Ph.D.
Key findings
Data from the National Vital Statistics System
- From 1999 through 2017, the age-adjusted unintentional injury death rate increased 40% from 35.3 deaths per 100,000 standard population to 49.4.
- Motor vehicle traffic death rates increased across all levels of urbanization between 2014 and 2017, with the largest increase in small metropolitan (metro) counties.
- Unintentional drug overdose death rates increased across all levels of urbanization between 2014 and 2017, with the largest increase in large fringe metro counties.
- Unintentional fall death rates increased across urbanization levels except for large central metro counties between 2014 and 2017, with the largest increase in rural counties.
Unintentional injury is a leading cause of death in the United States (1). Higher death rates for unintentional injury have been reported in rural areas compared with urban areas (2–4). This report describes trends in the death rates for unintentional injuries and three leading causes of deaths due to unintentional injuries (motor vehicle traffic, drug overdose, and falls) from 1999 through 2017. Given an observed increase in overall unintentional injury rates starting in 2014 (5), differences in death rates are described by urbanization level (rural, small metropolitan [metro], large fringe metro, and large central metro) for the leading causes of unintentional injury deaths for 2014 and 2017.
Keywords: motor vehicle traffic, unintentional drug overdose, unintentional fall, National Viral Statistics System (NVSS)
Overall, unintentional injury death rates increased from 1999 through 2017, although trends varied by leading causes of the injury deaths.
- Overall, age-adjusted unintentional injury death rates increased 40% from 35.3 per 100,000 standard population in 1999 to 49.4 in 2017, with an average annual increase of 1.9% from 1999 through 2006 and 6.8% from 2014 through 2017 (Figure 1).
- Age-adjusted death rates for motor vehicle traffic injuries were stable from 1999 through 2006, declined 8.5% annually from 2006 through 2009, and were stable again from 2009 through 2014, but were followed by an average annual increase of 3.7% from 2014 through 2017.
- Age-adjusted death rates for unintentional drug overdose increased nearly fivefold from 4.0 in 1999 to 19.1 in 2017, with an average annual increase of 11.3% from 1999 through 2005, 5.3% from 2005 through 2014, and 16.4% from 2014 through 2017. In 2013, the death rate for unintentional drug overdose surpassed the rate for motor vehicle traffic deaths.
- Age-adjusted death rates for unintentional falls increased an average 3.8% annually from 1999 through 2017.
Figure 1. Age-adjusted rates for unintentional injury deaths, overall and by three leading causes: United States, 1999–2017

1Significant increasing trends from 1999 through 2006 and from 2014 through 2017 (p < 0.05).
2Significant decreasing trend from 2006 through 2009 and increasing trend from 2014 through 2017 (p < 0.05).
3Significant increasing trend from 1999 through 2017 with different rates of change over time (p < 0.05).
4Significant increasing trend from 1999 through 2017 (p < 0.05).
NOTES: Unintentional injury deaths are identified using International Classification of Diseases, 10th Revision underlying cause-of-death codes: Overall unintentional injury deaths include V01–X59 and Y85–Y86; unintentional motor vehicle traffic deaths, (V02–V04 [.1, .9]), V09.2, (V12–V14 [.3–.9]), V19 (.4–.6), (V20–V28 [.3–.9]), (V29–V79 [.4–.9]), V80 (.3–.5), V81.1, V82.1, (V83–V86 [.0–.3]), V87 (.0–.8), and V89.2; unintentional drug overdose deaths, X40–X44; and unintentional fall deaths, W00–W19. Access data table for Figure 1pdf icon.
SOURCE: NCHS, National Vital Statistics System, Mortality.
Age-adjusted death rates for motor vehicle traffic injuries were highest in rural counties and lowest in large central metro counties in 2017.
- Age-adjusted death rates for motor vehicle traffic injuries increased across all levels of urbanization between 2014 and 2017 (Figure 2).
- In 2017 compared with 2014, small metro counties had the largest increase in motor vehicle traffic death rates (14%, from 11.2 to 12.8 per 100,000).
- In 2017, the age-adjusted death rates for motor vehicle traffic injuries decreased with increasing level of urbanization and were highest in rural counties (19.7) and lowest in large central metro counties (8.3).
Figure 2. Age-adjusted death rates for motor vehicle traffic injuries, by urbanization level: United States, 2014 and 2017

1Significant increase between 2014 and 2017 (p < 0.05).
2Significant linear trend in death rates by urbanization for 2017 (p < 0.05).
NOTES: Unintentional motor vehicle traffic deaths are identified using International Classification of Diseases, 10th Revision underlying cause-of-death codes (V02–V04 [.1, .9]), V09.2, (V12–V14 [.3–.9]), V19 (.4–.6), (V20–V28 [.3–.9]), (V29–V79 [.4–.9]), V80 (.3–.5), V81.1, V82.1, (V83–V86 [.0–.3]), V87 (.0–.8), and V89.2. Classification of the decedent’s county of residence is based on the 2013 NCHS Urban–Rural Classification Scheme for Counties. Access data table for Figure 2pdf icon.
SOURCE: NCHS, National Vital Statistics System, Mortality.
In 2017 compared with 2014, large fringe metro counties had the largest increase in unintentional drug overdose rates.
- Age-adjusted death rates for unintentional drug overdoses increased across all levels of urbanization between 2014 and 2017 (Figure 3).
- In 2017 compared with 2014, large fringe metro counties had the largest increase in unintentional drug overdose rates (71%, from 11.9 to 20.3 per 100,000), followed by large central metro (62%, 11.3 to 18.3), small metro (53%, 13.2 to 20.2), and rural counties (34%, 12.9 to 17.3).
- In 2017, the age-adjusted death rates for unintentional drug overdose were highest in large fringe metro counties (20.3) and small metro counties (20.2), and lowest in rural counties (17.3).
Figure 3. Age-adjusted death rates for unintentional drug overdose, by urbanization level: United States, 2014 and 2017
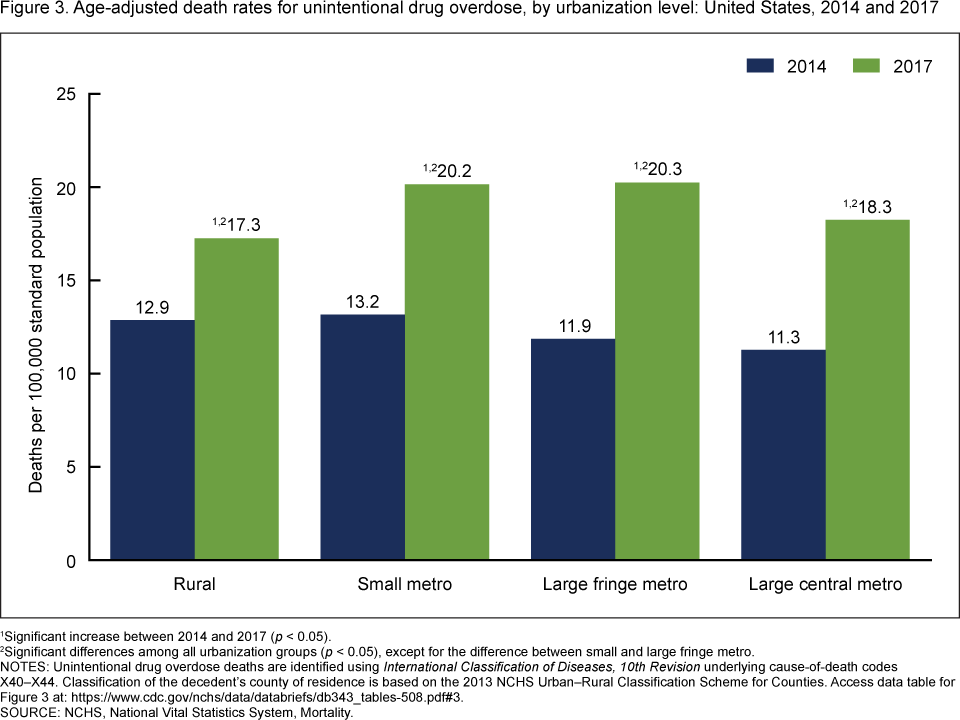
1Significant increase between 2014 and 2017 (p < 0.05).
2Significant differences among all urbanization groups (p < 0.05), except for the difference between small and large fringe metro.
NOTES: Unintentional drug overdose deaths are identified using International Classification of Diseases, 10th Revision underlying cause-of-death codes X40–X44. Classification of the decedent’s county of residence is based on the 2013 NCHS Urban–Rural Classification Scheme for Counties. Access data table for Figure 3pdf icon.
SOURCE: NCHS, National Vital Statistics System, Mortality.
Rural counties had the largest increase in death rates due to unintentional falls between 2014 and 2017.
- Age-adjusted death rates for unintentional falls increased in rural, small metro, and large fringe metro counties between 2014 and 2017 (Figure 4).
- Between 2014 and 2017, rural counties had the largest increase in death rates due to unintentional falls (11%, from 8.9 to 9.9 per 100,000).
- In 2017, the age-adjusted death rates for unintentional falls were highest in small metro (10.1) and rural counties (9.9), and lowest in large central metro counties (8.5).
Figure 4. Age-adjusted death rates for unintentional falls, by urbanization level: United States, 2014 and 2017

1Significant increase between 2014 and 2017 (p < 0.05).
2Significant differences among all urbanization groups (p < 0.05) except for the difference between rural and small metro.
NOTES: Unintentional fall deaths are identified using International Classification of Diseases, 10th Revision underlying cause-of-death codes W00–W19. Classification of the decedent’s county of residence is based on the 2013 NCHS Urban–Rural Classification Scheme for Counties. Access data table for Figure 4pdf icon.
SOURCE: NCHS, National Vital Statistics System, Mortality.
Summary
This report describes trends in unintentional injury death rates from 1999 through 2017, with a focus on recent increases between 2014 and 2017 by urbanization level. Overall, age-adjusted unintentional injury death rates have risen 40% from 1999 through 2017, although the trends varied by leading causes of unintentional injury death (motor vehicle traffic, drug overdose, and falls).
Between 2014 and 2017, large fringe metro counties had the largest increase in unintentional drug overdose death rates; small metro had the largest increase in motor vehicle death rates; and rural counties had the largest increase in death rates due to unintentional falls. Unintentional drug overdose death rates surpassed motor vehicle traffic death rates in 2013. In 2017, differences in death rates by urbanization level varied by leading causes of unintentional injury deaths.
Definitions
Unintentional injury deaths: Defined as having International Classification of Diseases, 10th Revision (ICD–10) underlying cause-of-death (UCOD) codes V01–X59 and Y85–Y86.
Motor vehicle traffic deaths: Defined as having ICD–10 UCOD codes (V02–V04 [.1, .9]), V09.2, (V12–V14 [.3–.9]), V19 (.4–.6), (V20–V28 [.3–.9]), (V29–V79 [.4–.9]), V80 (.3–.5), V81.1, V82.1, (V83–V86 [.0–.3]), V87 (.0–.8), and V89.2.
Drug overdose deaths: Defined as having ICD–10 UCOD codes X40–X44. Drug overdose deaths that are unintentional form a subset of the traditional drug-poisoning (overdose) death classification that is identified by UCOD codes X40–X44, X60–X64, X85, and Y10–Y14. This analysis focuses only on unintentional deaths and, therefore, excludes deaths due to intentional self-harm (X60–X64), assault (X85), or of unknown intent (Y10–Y14). Among drug overdose deaths, 87% are unintentional (6). Unintentional drug overdose deaths may be underestimated because some drug overdose deaths of undetermined intent (ICD–10 codes Y10–Y14, which are not included in this report) may be unintentional.
Unintentional fall deaths: Defined as having ICD–10 UCOD codes W00–W19.
Urbanization: Metropolitan (metro) counties are counties in metropolitan statistical areas (MSAs) as defined by the federal Office of Management and Budget. Nonmetropolitan (nonmetro) counties are counties that are not in MSAs. The 2013 NCHS Urban–Rural Classification Scheme for Counties (NCHS scheme) subdivides metro counties into four categories, based partly on MSA population size, and subdivides nonmetro counties into two categories (7). For this report, county of residence was categorized by collapsing the NCHS scheme into the following three metro and one nonmetro categories: large central metro (central counties in MSAs of 1 million or more population), large fringe metro (suburban counties in MSAs of 1 million or more population), small metro (counties in MSAs of less than 1 million population), and rural (nonmetropolitan counties).
Data source and methods
Estimates are based on the National Vital Statistics System underlying cause-of-death data for 1999–2017 (8). Deaths are classified using the International Classification of Diseases, 10th Revision (ICD–10). Age-adjusted death rates are calculated using the direct method and the 2000 standard population (9).
Given an observed nonlinear trend in the overall unintentional injury death rates and some of the cause-specific rates with a steeper trajectory around 2014, death rates by the three leading causes of unintentional injury death were compared between 2014 and 2017.
Linear and nonlinear time trends were tested with orthogonal polynomial contrasts (10). For trends that were nonlinear, piecewise linear regression was used to identify the years at which the trends changed using the segmented package in R, version 3.5 (11). Trends across urbanization levels were tested with Jonckheere-Terpstra, a test for ordered differences. Pairwise differences between 2014 and 2017 and between urbanization levels were assessed using z tests, with an alpha level of 0.05.
About the authors
R. Henry Olaisen is with the Centers for Disease Control and Prevention’s Epidemic Intelligence Service, assigned to the National Center for Health Statistics (NCHS), Division of Vital Statistics. Lauren M. Rossen is with the NCHS Division of Research Methodology. Margaret Warner and Robert N. Anderson are with the NCHS Division of Vital Statistics. The authors gratefully acknowledge the assistance of Jiaquan Xu, who provided content review.
References
- National Center for Injury Prevention and Control, National Center for Health Statistics. 10 leading causes of death by age group, United States—2017pdf icon.
- Mack KA, Jones CM, Ballesteros MF. Illicit drug use, illicit drug use disorders, and drug overdose deaths in metropolitan and nonmetropolitan areas—United States. MMWR Surveill Summ 66(19):1–12. 2017.
- Moy E, Garcia MC, Bastian B, Rossen LM, Ingram DD, Faul M, et al. Leading causes of death in nonmetropolitan and metropolitan areas—United States, 1999–2014. MMWR Surveill Summ 66(1):1–8. 2017.
- Shiels MS, Bennington de González A, Best AF, Chen Y, Chemyavskiy P, Hartge P, et al. Premature mortality from all causes and drug poisonings in the USA according to socioeconomic status and rurality: An analysis of death certificate data by county from 2000–15pdf iconexternal icon. Lancet Public Health 4(2):e97–106. 2019.
- Kochanek KD, Murphy SL, Xu JQ, Tejada-Vera B. Deaths: Final data for 2014pdf icon. National Vital Statistics Reports; vol 65 no 4. Hyattsville, MD: National Center for Health Statistics. 2016.
- Hedegaard H, Miniño AM, Warner M. Drug overdose deaths in the United States, 1999–2017pdf icon. NCHS Data Brief, no 329. Hyattsville, MD: National Center for Health Statistics. 2018.
- Ingram DD, Franco SJ. 2013 NCHS urban–rural classification scheme for counties. National Center for Health Statistics. Vital Health Stat 2(166). 2014.
- National Center for Health Statistics. CDC WONDER: About underlying cause of death 1999–2017. 2019.
- Anderson RN, Rosenberg HM. Age standardization of death rates: Implementation of the year 2000 standard. National Vital Statistics Reports; vol 47 no 3. Hyattsville, MD: National Center for Health Statistics. 1998.
- Ingram DD, Malec DJ, Makuc DM, Kruszon-Moran D, Gindi RM, Albert M, et al. National Center for Health Statistics guidelines for analysis of trendspdf icon. National Center for Health Statistics. Vital Health Stat 2(179). 2018.
- R Foundation for Statistical Computing. R (version 3.5) [computer software]. 2018.
Suggested citation
Olaisen RH, Rossen LM, Warner M, Anderson RN. Unintentional injury death rates in rural and urban areas: United States, 1999–2017. NCHS Data Brief, no 343. Hyattsville, MD: National Center for Health Statistics. 2019.
Copyright information
All material appearing in this report is in the public domain and may be reproduced or copied without permission; citation as to source, however, is appreciated.
National Center for Health Statistics
Jennifer H. Madans, Ph.D., Acting Director
Amy M. Branum, Ph.D., Acting Associate Director for Science
Division of Vital Statistics
Steven Schwartz, Ph.D., Director
Hanyu Ni, Ph.D., M.P.H., Associate Director for Science