Opioids Prescribed at Discharge or Given During Emergency Department Visits Among Adults in the United States, 2016
- Key findings
- The rate of ED visits with opioids only given in the ED was higher than the rate for visits with opioids only prescribed at discharge and visits with both given and prescribed opioids.
- Among adults aged 45 and older, the rate of ED visits with opioids only given was higher than the rate for visits with opioids only prescribed or both given and prescribed.
- Opioids were only given at around one-half of ED visits where opioids were given, prescribed, or both and where Medicare was the primary expected source of payment.
- The type of opioid administration among ED visits where opioids were given, prescribed, or both varied according to primary diagnosis.
- Summary
- Definitions
- Data source and methods
- About the authors
- References
- Suggested citation
PDF Version (481 KB) | Visual Abstract
Pinyao Rui, M.P.H., and Susan M. Schappert, M.A.
Key findings
National Hospital Ambulatory Medical Care Survey
- In 2016, opioids were given during the visit and a prescription for opioids was provided at discharge at 35.4 emergency department (ED) visits per 1,000 adults. Opioids were only given during the ED visit at 53.4 visits per 1,000 adults, whereas opioids were only prescribed at discharge at 38.4 visits per 1,000 adults.
- Among ED visits where opioids were given at the visit, prescribed at discharge, or both, opioids were most likely to be only given during the visit for visits paid by private insurance, Medicare, or Medicaid.
- Among ED visits where opioids were given at the visit, prescribed at discharge, or both, opioids were most likely to be only prescribed at discharge for visits primarily for injury or trauma.
Opioid analgesics are primarily used to treat chronic and acute pain and, when used appropriately, can be an important part of treatment (1). Pain is a major symptom of patients visiting the emergency department (ED), with up to 42% of ED visits being related to pain (2). Opioids may either be administered in the ED as part of treatment, provided post-treatment in the form of a prescription, or both (3). This report compares rates and percentages of ED visits by adults at which opioids were only given in the ED, only prescribed at discharge, or both, by selected characteristics.
Keywords: pain, narcotic, National Hospital Ambulatory Medical Care Survey (NHAMCS)
The rate of ED visits with opioids only given in the ED was higher than the rate for visits with opioids only prescribed at discharge and visits with both given and prescribed opioids.
- In 2016, opioids were given during the visit and a prescription for opioids was provided at discharge at 35.4 emergency department (ED) visits per 1,000 adults, which was similar to the rate of visits with opioids only prescribed at discharge (38.4). The rate of ED visits where opioids were only given during the visit (53.4) was higher compared with visits where opioids were given and prescribed, and only prescribed (Figure 1).
- Among women, opioids were only given at the ED visit at 61.5 visits per 1,000, which was higher than the rate for visits with opioids only prescribed at discharge (42.6) and visits where opioids were both given at the visit and prescribed at discharge (39.4).
- Among men, opioids were only given at the ED visit at 44.7 visits per 1,000, which was higher than the rate for visits with opioids only prescribed at discharge (34.0) and visits where opioids were both given and prescribed at discharge (31.0).
- The ED visit rate where opioids were only given at the ED visit was higher for women compared with men.
Figure 1. Rate of emergency department visits with opioids given in emergency departments, prescribed at discharge, or both, per 1,000 adult women and men: United States, 2016
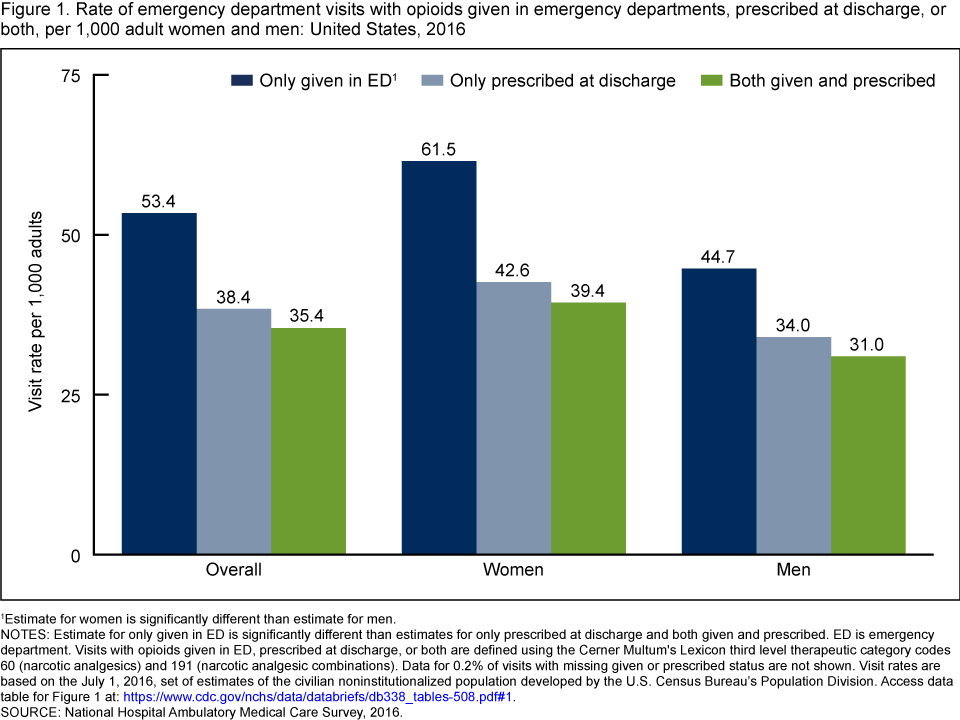
1Estimate for women is significantly different than estimate for men.
NOTES: Estimate for only given in ED is significantly different than estimates for only prescribed at discharge and both given and prescribed. ED is emergency department. Visits with opioids given in ED, prescribed at discharge, or both are defined using the Cerner Multum’s Lexicon third level therapeutic category codes 60 (narcotic analgesics) and 191 (narcotic analgesic combinations). Data for 0.2% of visits with missing given or prescribed status are not shown. Visit rates are based on the July 1, 2016, set of estimates of the civilian noninstitutionalized population developed by the U.S. Census Bureau’s Population Division. Access data table for Figure 1.
SOURCE: National Hospital Ambulatory Medical Care Survey, 2016.
Among adults aged 45 and older, the rate of ED visits with opioids only given was higher than the rate for visits with opioids only prescribed or both given and prescribed.
- Among adults aged 18–44, opioids were only given at the ED visit at 46.3 visits per 1,000, which was similar to the rate for visits with opioids only prescribed at discharge (45.8) and higher than the rate for visits with opioids both given and prescribed at discharge (35.8). The observed difference between the rates where opioids were only prescribed at discharge and both given and prescribed was not significant (Figure 2).
- Among adults aged 45–64, the ED visit rate was higher where opioids were only given at the ED visit (59.4) compared with the rate for visits with opioids only prescribed at discharge (33.4) and both given and prescribed at discharge (39.2).
- Among adults aged 65 and over, the ED visit rate was higher where opioids were only given at the ED visit (59.6) compared with the rate for visits with opioids only prescribed at discharge (29.9) and both given and prescribed at discharge (27.6).
- The ED visit rate for visits with opioids only prescribed at discharge was higher for adults aged 18–44 (45.8) compared with older adults aged 45–64 (33.4) and 65 and over (29.9).
- The ED visit rate where opioids were only given at the ED visit was higher for older adults aged 45–64 (59.4) compared with younger adults aged 18–44 (46.3). The observed difference between the visit rates for adults aged 18–44 and 65 and over was not significant.
Figure 2. Rate of emergency department visits with opioids given in emergency departments, prescribed at discharge, or both, per 1,000 adults aged 18–44, 45–64, and 65 and over: United States, 2016

1Estimate for adults aged 18–44 is significantly different than estimate for adults aged 45–64.
2Estimate for adults aged 18–44 is significantly different than estimate for adults aged 45–64 and 65 and over.
3Estimate for only given in ED is significantly different than estimates for both given and prescribed.
4Estimate for only given in ED is significantly different than estimates for only prescribed at discharge and both given and prescribed.
NOTES: ED is emergency department. Visits with opioids given in ED, prescribed at discharge, or both are defined using the Cerner Multum’s Lexicon third level therapeutic category codes 60 (narcotic analgesics) and 191 (narcotic analgesic combinations). Data for 0.2% of visits with missing given or prescribed status are not shown. Visit rates are based on the July 1, 2016, set of estimates of the civilian noninstitutionalized population developed by the U.S. Census Bureau’s Population Division. Access data table for Figure 2.
SOURCE: National Hospital Ambulatory Medical Care Survey, 2016.
Opioids were only given at around one-half of ED visits where opioids were given, prescribed, or both and where Medicare was the primary expected source of payment.
- Among ED visits where opioids were given at the visit, prescribed at discharge, or both, 41.9% were only given at the ED visit, which was higher than both the percentage of visits with opioids only prescribed at discharge (30.2%) and visits with opioids both given and prescribed (27.7%) (Figure 3).
- Among ED visits where opioids were given at the visit, prescribed at discharge, or both, the percentage of visits where opioids were only given at the ED visit was higher than the percentage of visits where opioids were only prescribed at discharge, or both given and prescribed, when the primary expected source of payment for the visit was private insurance (39.9%), Medicare (50.6%), or Medicaid (41.4%).
Figure 3. Percentage of emergency department visits by adults with opioids given in emergency departments, prescribed at discharge, or both, by primary expected source of payment: United States, 2016
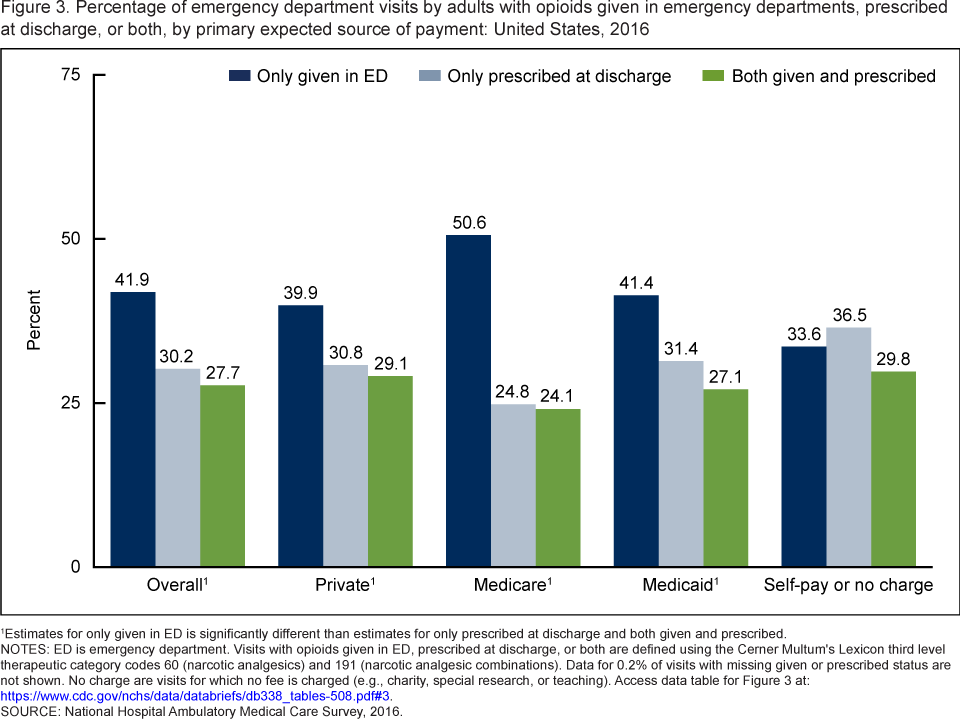
1Estimates for only given in ED is significantly different than estimates for only prescribed at discharge and both given and prescribed.
NOTES: ED is emergency department. Visits with opioids given in ED, prescribed at discharge, or both are defined using the Cerner Multum’s Lexicon third level therapeutic category codes 60 (narcotic analgesics) and 191 (narcotic analgesic combinations). Data for 0.2% of visits with missing given or prescribed status are not shown. No charge are visits for which no fee is charged (e.g., charity, special research, or teaching). Access data table for Figure 3.
SOURCE: National Hospital Ambulatory Medical Care Survey, 2016.
The type of opioid administration among ED visits where opioids were given, prescribed, or both varied according to primary diagnosis.
- Among ED visits where opioids were given at the visit, prescribed at discharge, or both, with a primary diagnosis of injury or trauma, the percentage with opioids only prescribed at discharge (40.7%) was higher than both the percentage of visits with opioids only given at the visit (26.3%) and visits with opioids both given and prescribed at discharge (32.7%) (Figure 4).
- For ED visits with a primary diagnosis of abdominal pain, where opioids were given at the visit, prescribed at discharge, or both, 50.3% included opioids only given at the visit, which was higher than both the percentage of visits with opioids only prescribed at discharge (19.4%) and visits with opioids both given and prescribed (29.8%); additionally, the percentage of visits with opioids only prescribed at discharge was lower than that of visits with opioids both given and prescribed.
- For ED visits with a primary diagnosis of chest pain, where opioids were given at the visit, prescribed at discharge, or both, 62.2% included opioids only given at the visit, which was higher than both the percentage of visits with opioids only prescribed at discharge (17.9%) and visits with opioids both given and prescribed (20.0%).
Figure 4. Percentage of emergency department visits by adults with opioids given in emergency departments, prescribed at discharge, or both, by selected primary diagnoses: United States, 2016

1Estimate for only prescribed at discharge is significantly different than estimates for only given in ED and both given and prescribed.
2Estimates for only given in ED, only prescribed at discharge, and both given and prescribed are significantly different from each other.
3Estimate for only given in ED is significantly different than estimates for only prescribed at discharge and both given and prescribed.
NOTES: ED is emergency department. Visits with opioids given in ED, prescribed at discharge, or both are defined using the Cerner Multum’s Lexicon third level therapeutic category codes 60 (narcotic analgesics) and 191 (narcotic analgesic combinations). Data for 0.2% of visits with missing given or prescribed status are not shown. Diagnoses are coded according to the International Classification of Diseases, 10th Revision, Clinical Modification (ICD–10–CM). Access data table for Figure 4.
SOURCE: National Hospital Ambulatory Medical Care Survey, 2016.
Summary
In 2016, there were an estimated 53.4 ED visits per 1,000 adults with opioids given in the ED, 38.4 visits per 1,000 adults with opioids prescribed at ED discharge, and 35.4 visits per 1,000 adults that included opioids both given at the ED visit and prescribed at discharge. The rate of visits where opioids were only given at the ED visit, compared with visits where opioids were only prescribed at discharge, or were both given and prescribed, was higher among patients aged 45 and over and for both women and men. The rate where opioids were only given at the ED visit was higher for women than men and adults aged 45–64 than for adults aged 18–44 years. The rate of visits with opioids only prescribed at discharge was higher for younger adults compared with older adults.
Opioids were only given at the ED visit at a significantly higher percentage of visits where opioids were given, prescribed, or both, where the primary expected source of payment was Medicare (50.6%) compared with opioids only prescribed at discharge (24.8%); this pattern likely reflects the age distribution differences showing higher rates of opioids given in the ED among visits made by older patients. Opioids were only prescribed at discharge at a higher percentage of visits where opioids were given, prescribed, or both, with a primary diagnosis of injury or trauma, compared with opioids given in the ED. The reverse pattern was observed among visits where opioids were given, prescribed, or both, with primary diagnoses of chest pain and abdominal pain in which the percentage of visits with opioids only given at the ED visit was higher than the percentage of visits with opioids only prescribed at discharge.
Definitions
Emergency department visits with opioids given in ED, prescribed at discharge, or both given and prescribed: Opioids were defined using the Cerner Multum’s Lexicon third level therapeutic category codes for narcotic analgesics (60) and narcotic analgesic combinations (191). Data for up to 30 drugs and corresponding given or prescribed statuses could be collected per visit record. In 2016, 25.0% of adult ED visits with at least one opioid mention (i.e., opioid was given, prescribed, or both) included more than one opioid mention in the medical record. Given in ED, prescribed at discharge, or both given and prescribed are mutually exclusive and derived from the drug variables GPMED1–GPMED30, which have the following values: given in ED; prescribed at discharge; both given in ED and prescribed at discharge; not applicable; and blank. In 2016, 27.7% (Figure 3) of adult ED visits with at least one opioid mention contained opioid(s) that were both given and prescribed.
Only given in ED: Visits with opioids that were only given in the ED. This could include visits for which extra opioids were given to the patient to take home without a prescription; however, the extent to which this happens cannot be measured from the data. If visit included more than one opioid mention, all opioids must have the designation of “given in ED.”
Only prescribed at discharge: Visits with opioids that were only prescribed at discharge from the ED. If visit included more than one opioid mention, all opioids must have the designation of “prescribed at discharge.”
Both given and prescribed: Visits with opioids that were both given in ED and prescribed at discharge from the ED. If visit included one opioid mention, the opioid must have the designation of “both given in ED and prescribed at discharge;” if visit included more than one opioid mention, the combination of all opioid mentions in the visit must include a designation of “given in ED,” “prescribed at discharge,” or “both given in ED and prescribed at discharge.”
Primary expected sources of payment: During data collection, all sources of payment were collected. These sources of payment were collapsed into one mutually exclusive variable (primary expected source of payment) that ranks payment sources based on the hierarchy below:
- Medicare: Partial or full payment by Medicare plan includes payments made directly to the hospital as well as payments reimbursed to the patient. Charges covered under a Medicare-sponsored prepaid plan are included.
- Medicaid: Partial or full payment by Medicaid plan includes payments made directly to the hospital or reimbursed to the patient. Charges covered under a Medicaid-sponsored prepaid plan (HMO) or “managed Medicaid” are included.
- Private: Partial or full payment by a private insurer (e.g., BlueCross BlueShield), either directly to the hospital or reimbursed to the patient. Charges covered under a private insurance sponsored prepaid plan are included.
- Self-pay or no charge: Includes self-pay, no charge, or charity. Self-pay are charges that are paid by the patient or patient’s family, which will not be reimbursed by a third party. Self-pay includes visits for which the patient is expected to be ultimately responsible for most of the bill, even if the patient never actually pays it. This does not include copayments or deductibles. No charge or charity are visits for which no fee is charged (e.g., charity, special research, or teaching).
Primary diagnosis: The principal diagnosis, considered to be the main cause or reason for the ED visit. Diagnoses are coded according to the International Classification of Diseases, 10th Revision, Clinical Modification (ICD–10–CM) coding system (4). The ICD–10–CM codes for the primary diagnoses included in (Figure 4) are the following:
Injury/trauma: S00–T88, Y92–Y93
Abdominal pain: R10.0, R10.1, R10.3, R10.8
Back pain: M54
Extremity pain: M79.6, M25.51–M25.57
Chest pain: R07.1, R07.2, R07.8, R07.9
Data source and methods
ED visit data are from the 2016 National Hospital Ambulatory Medical Care Survey (NHAMCS), a nationally representative survey of nonfederal general and short-stay hospitals conducted by the National Center for Health Statistics. NHAMCS uses a multistage probability design with samples of geographic primary sampling units (PSUs), hospitals within PSUs, and patient visits within EDs. In 2016, 265 hospitals reported emergency department data in NHAMCS, and data were collected on approximately 19,000 ED visits. Additional information on the methodology of NHAMCS is available online (5), as is the public-use data file (6).
The study population includes all ED visits made by patients aged 18 and over with at least one opioid mention in the medical record. Figures 1 and 2 display rates of ED visits, which were calculated by dividing the number of ED visits with opioids given in ED, prescribed at discharge, or both, by the July 1, 2016, estimate of the civilian noninstitutionalized population of the U.S. (obtained from the U.S. Census Bureau’s Population Division) for each demographic group.
Data analysis was performed using the statistical packages SAS version 9.4 (SAS Institute, Cary, N.C.) and SAS-callable SUDAAN version 11.0 (RTI International, Research Triangle Park, N.C.). Differences among subgroups were evaluated using a two-tailed t test (p < 0.05). All proportion estimates presented meet NCHS guidelines for presentation of proportions (7).
About the authors
Pinyao Rui and Susan M. Schappert are with the National Center for Health Statistics, Division of Health Care Statistics.
References
- Prescription opioid data. Centers for Disease Control and Prevention.
- Pletcher MJ, Kertesz SG, Kohn MA, Gonzales R. Trends in opioid prescribing by race/ethnicity for patients seeking care in U.S. emergency departments. JAMA 299:70–8. 2008.
- Kyriacou DN. Opioid vs nonopioid acute pain management in the emergency department. JAMA 318(17):1655–6. 2017.
- National Center for Health Statistics. International classification of diseases, 10th revision, clinical modification (ICD–10–CM).
- National Center for Health Statistics. 2016 NHAMCS micro-data file documentation. Hyattsville, MD. 2018.
- National Center for Health Statistics. 2016 NHAMCS micro-data set file. Hyattsville, MD. 2018.
- Parker JD, Talih M, Malec DJ, Beresovsky V, Carroll M, Gonzalez JF Jr, et al. National Center for Health Statistics data presentation standards for proportions. National Center for Health Statistics. Vital Health Stat 2(175). 2017.
Suggested citation
Rui P, Schappert SM. Opioids prescribed at discharge or given during emergency department visits among adults in the United States, 2016. NCHS Data Brief, no 338. Hyattsville, MD: National Center for Health Statistics. 2019.
Copyright information
All material appearing in this report is in the public domain and may be reproduced or copied without permission; citation as to source, however, is appreciated.
National Center for Health Statistics
Jennifer H. Madans, Ph.D., Acting Director
Amy M. Branum, Ph.D., Acting Associate Director for Science
Division of Health Care Statistics
Denys T. Lau, Ph.D., Director
Alexander Strashny, Ph.D., Associate Director for Science