Characteristics of Office-based Physician Visits, 2015
- Key findings
- Do office-based physician visit rates vary by patient age and sex?
- What was the expected primary source of payment at office-based physician visits, and did it vary by age?
- What were the major reasons for office-based physician visits?
- What were the services ordered or provided at office-based physician visits, and did they vary by age?
- Summary
- Definitions
- Data source and methods
- About the authors
- References
- Suggested citation
NCHS Data Brief No. 310, June 2018
PDF Versionpdf icon (183 KB)
Jill J. Ashman, Ph.D., Pinyao Rui, M.P.H., Titilayo Okeyode
Key findings
Data from the National Ambulatory Medical Care Survey
- In 2015, there were an estimated 313 office-based physician visits per 100 persons.
- The visit rate among females exceeded the rate for males, and the rates for both infants and older adults exceeded the rates for those aged 1–64 years.
- Private insurance was the primary expected source of payment for the majority of visits by children under age 18 and adults aged 18–64, whereas Medicare was the primary expected source of payment for the majority of visits by adults aged 65 and over.
- Compared with adults, a larger percentage of visits by children were for either preventive care or a new problem.
- Compared with children, a larger percentage of visits by adults included a laboratory test, imaging service, or procedure that was ordered or provided.
In 2015, most Americans had a usual place to receive health care (85% of adults and 96% of children) (1,2). The majority of children and adults listed a doctor’s office as the usual place they received care (1,2). In 2015, there were an estimated 990.8 million office-based physician visits in the United States (3,4). This report examines visit rates by age and sex. It also examines visit characteristics—including insurance status, reason for visit, and services—by age. Estimates use data from the 2015 National Ambulatory Medical Care Survey (NAMCS).
Keywords: ambulatory health care, insurance, NAMCS
Do office-based physician visit rates vary by patient age and sex?
- In 2015, there were 313 office-based physician visits per 100 persons (Figure 1).
- The visit rate for both infants under one year (617 per 100 infants) and adults aged 65 and over (658 per 100 adults aged 65 and over) was higher than the rate for children aged 1–17 years, (180 per 100 children aged 1–17 years), adults aged 18–44 (204 per 100 adults aged 18–44), and adults aged 45–64 (366 per 100 adults aged 45–64).
- The visit rate among females (362 visits per 100 females) was higher than the rate for males (262 visits per 100 males).
Figure 1. Visit rates, by selected demographics: United States, 2015
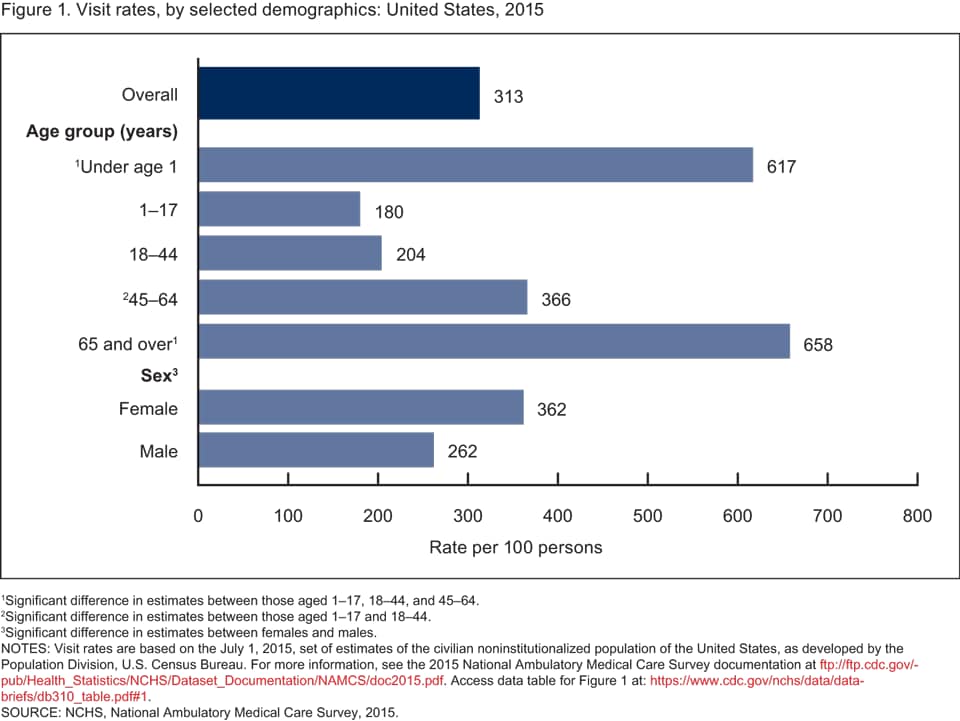
1Significant difference in estimates between those aged 1–17, 18–44, and 45–64.
2Significant difference in estimates between those aged 1–17 and 18–44.
3Significant difference in estimates between females and males.
NOTES: Visit rates are based on the July 1, 2015, set of estimates of the civilian noninstitutionalized population of the United States, as developed by the Population Division, U.S. Census Bureau. For more information, see the 2015 National Ambulatory Medical Care Survey documentationpdf icon. Access data table for Figure 1pdf icon.
SOURCE: NCHS, National Ambulatory Medical Care Survey, 2015.
What was the expected primary source of payment at office-based physician visits, and did it vary by age?
- Private insurance was the primary expected source of payment at one-half (50%) of all office-based physician visits, followed by Medicare (29%), Medicaid (15%), and no insurance (6%) (Figure 2).
- Private insurance was the primary expected source of payment for the majority of visits by children under age 18 years (57%) and adults aged 18–64
(67%), whereas Medicare was the primary expected source of payment for the majority of visits by adults aged 65 and over (79%). - Medicaid was the primary expected source of payment at a higher percentage of visits by children (38%) than adults aged 18–64 (15%) and 65 and over (2%).
- No insurance or self-pay was the primary expected source of payment at a higher percentage of visits by adults aged 18–64 (9%) than adults aged 65 and over (2%).
Figure 2. Expected primary source of payment, by age: United States, 2015
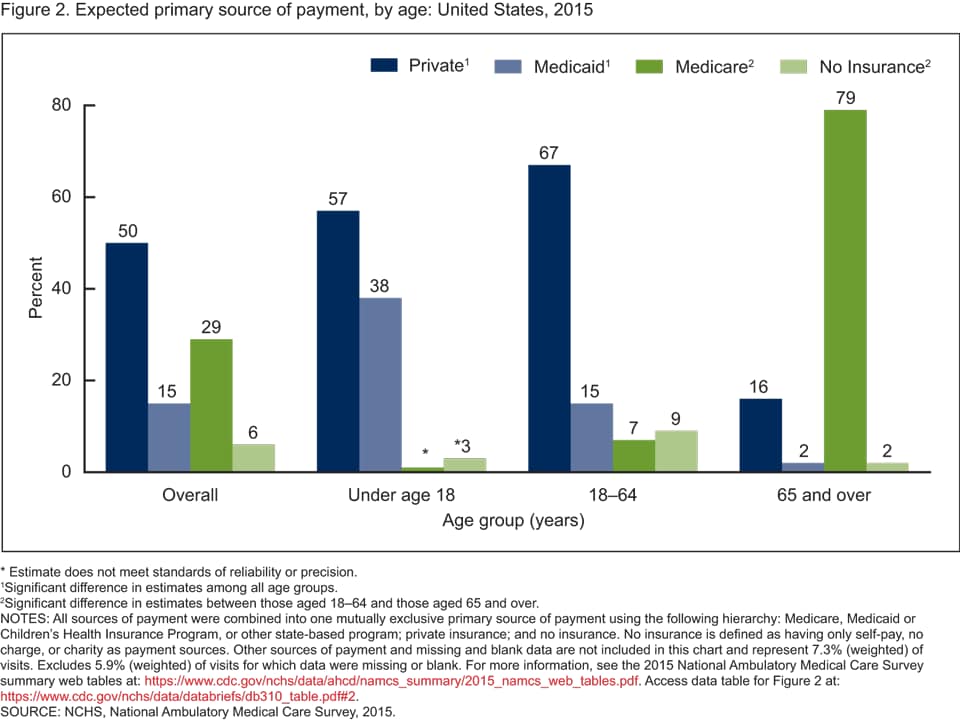
*Estimate does not meet standards of reliability or precision.
1Significant difference in estimates among all age groups.
2Significant difference in estimates between those aged 18–64 and those aged 65 and over.
NOTES: All sources of payment were combined into one mutually exclusive primary source of payment using the following hierarchy: Medicare, Medicaid or Children’s Health Insurance Program, or other state-based program; private insurance; and no insurance. No insurance is defined as having only self-pay, no charge, or charity as payment sources. Other sources of payment and missing and blank data are not included in this chart and represent 7.3% (weighted) of visits. Excludes 5.9% (weighted) of visits for which data were missing or blank. For more information, see the 2015 National Ambulatory Medical Care Survey summary web tablespdf icon. Access data table for Figure 2pdf icon.
SOURCE: NCHS, National Ambulatory Medical Care Survey, 2015.
What were the major reasons for office-based physician visits?
- A chronic condition was listed as the major reason for 39% of all office-based physician visits, followed by a new problem (27%), preventive care (20%), an injury (8%), and pre- or post-surgery care (5%) (Figure 3).
- A chronic condition was listed as the major reason for the visit at a higher percentage of visits by adults than children (51% for those aged 65 and over, 39% for those aged 18–64, and 15% for children under age 18 years).
- A new problem was listed as the major reason for the visit at a higher percentage of visits by children (41%) than adults (26% for those aged 18–64 and 21% for those aged 65 and over).
- Preventive care was listed as the major reason for the visit at a higher percentage of visits by children than adults (33% for children under age 18 years, 21% for those aged 18–64, and 13% for those aged 65 and over).
- Pre- and post-surgery care was listed as the major reason for the visit at a higher percentage of visits by adults (6% for those aged 18–64 and 65 and over) than children (2%).
Figure 3. Major reason for office-based physician visit, by age: United States, 2015
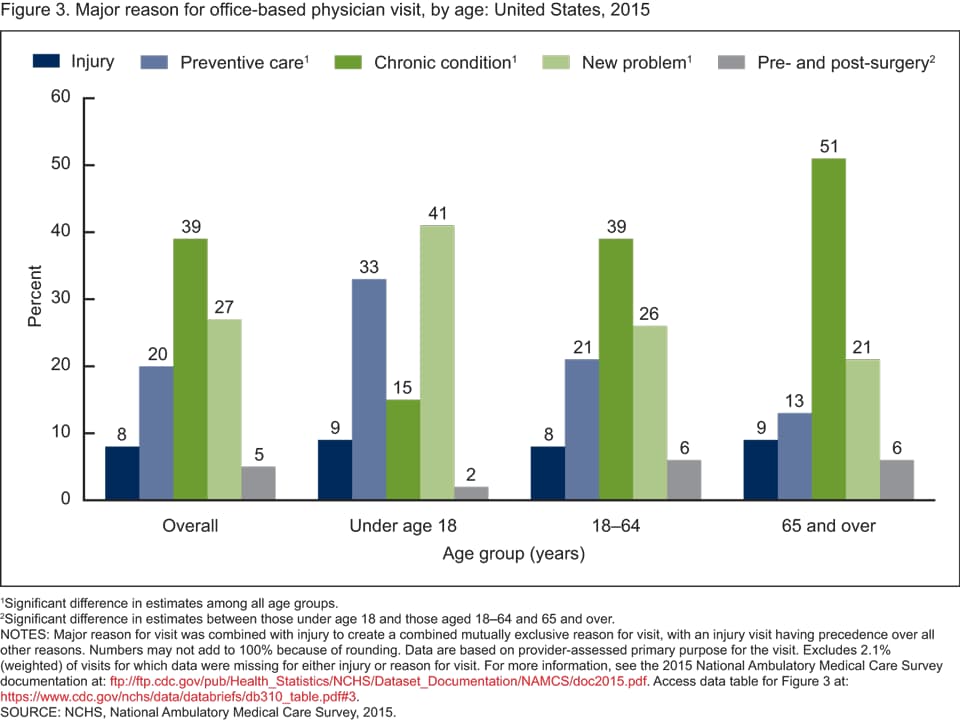
1Significant difference in estimates among all age groups.
2Significant difference in estimates between those under age 18 and those aged 18–64 and 65 and over.
NOTES: Major reason for visit was combined with injury to create a combined mutually exclusive reason for visit, with an injury visit having precedence over all other reasons. Numbers may not add to 100% because of rounding. Data are based on provider-assessed primary purpose for the visit. Excludes 2.1% (weighted) of visits for which data were missing for either injury or reason for visit. For more information, see the 2015 National Ambulatory Medical Care Survey documentationpdf icon. Access data table for Figure 3pdf icon.
SOURCE: NCHS, National Ambulatory Medical Care Survey, 2015.
What were the services ordered or provided at office-based physician visits, and did they vary by age?
- An examination or screening was ordered or provided at more than one-half (52%) of all office-based physician visits, followed by laboratory tests (29%), health education and counseling (23%), imaging (17%), and procedures (13%) (Figure 4).
- A higher percentage of laboratory tests were ordered or provided at visits by adults than children (28% for those aged 65 and over, 33% for those aged 18–64, and 14% for children under age 18 years).
- A higher percentage of imaging services were ordered or provided at visits by adults than children (18% for those aged 65 and over, 19% for those aged 18–64, and 6% for children under age 18 years).
- A higher percentage of procedures were ordered or provided at visits by adults than children (17% for those aged 65 and over, 13% for those aged 18–64, and 8% for children under age 18 years).
- A higher percentage of health education and counseling services were ordered or provided at visits by children than adults (28% for children under age 18 years, 23% for those aged 18–64, and 20% for those aged 65 and over).
Figure 4. Selected services ordered or provided at office-based physician visits, by age: United States, 2015
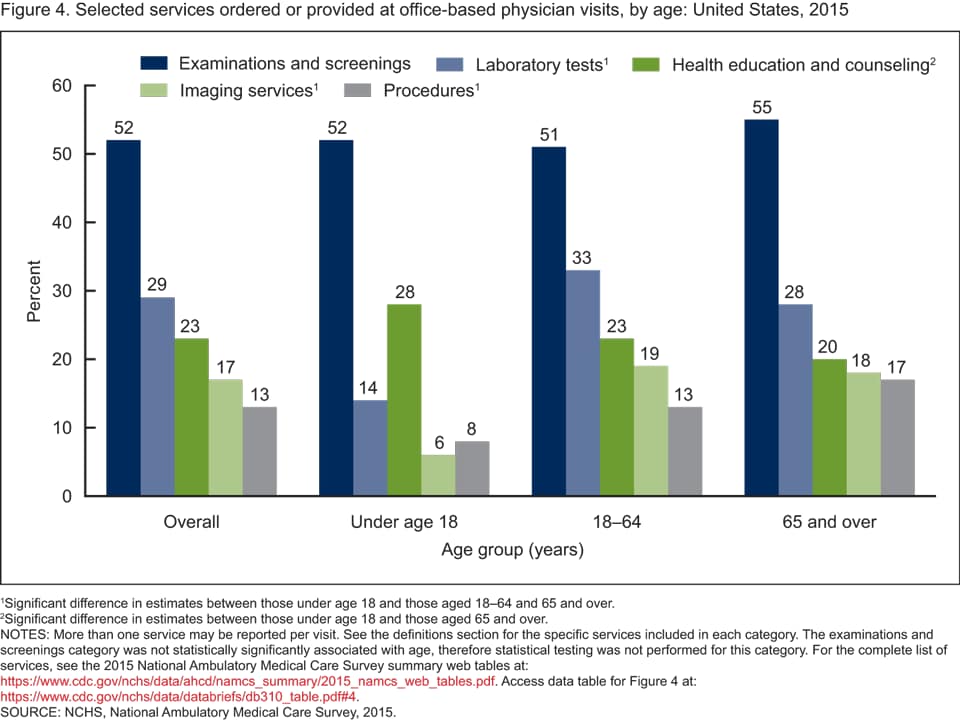
1Significant difference in estimates between those under age 18 and those aged 18–64 and 65 and over.
2Significant difference in estimates between those under age 18 and those aged 65 and over.
NOTES: More than one service may be reported per visit. See the definitions section for the specific services included in each category. The examinations and screenings category was not statistically significantly associated with age, therefore statistical testing was not performed for this category. For the complete list of services, see the 2015 National Ambulatory Medical Care Survey summary web tablespdf icon. Access data table for Figure 4pdf icon.
SOURCE: NCHS, National Ambulatory Medical Care Survey, 2015.
Summary
During 2015, the overall rate of office-based physician visits was 313 visits per 100 persons. The visit rate for infants and older adults was higher than the rate for other age groups. The visit rate for females was higher than the rate for males.
The majority of visits by children (57%) and adults aged 18–64 (67%) listed private insurance as the primary expected source of payment, whereas the majority of visits by older adults listed Medicare as the primary expected source of payment (79%). Only 6% of office-based physician visits were made by those with no insurance. A higher percentage of visits by adults aged 18–64 (9%) had no insurance compared with adults aged 65 and over (2%).
A chronic condition was the major reason for 39% of all office-based physician visits, and visits for chronic conditions were higher among adults than children. A higher percentage of visits by children than adults were for a new problem or preventive care, whereas the reverse was true for visits related to pre- or post-surgery care.
About one-half (52%) of all office-based physician visits included an examination or screening that was ordered or provided. Compared with adults, a higher percentage of visits by children included health education and counseling, which is consistent with a higher percentage of visits by children for preventive care compared with adults. Compared with children, a higher percentage of adults had visits that included laboratory tests, imaging, and procedures.
This report shows that there is wide variation by age in the characteristics of visits to office-based physicians in the United States.
Definitions
Major reason for this visit: A new variable was created by merging injury with the provider-assessed major reason for this visit (5). Injury was given preference over all other reasons. The five categories for major reason for this visit include:
- Injury: A visit defined as injury or poisoning related, based on any listed reason for visit and diagnosis (5).
- New problem: A visit for a condition, illness, or injury having a relatively sudden or recent onset (within 3 months of this visit).
- Chronic condition: A visit primarily to receive care or examination for a preexisting chronic condition, illness, or injury (onset of condition was 3 months or more before this visit). This includes both routine visits and flare-ups; a visit primarily due to a sudden exacerbation of a preexisting chronic condition.
- Pre- and post-surgery: A visit scheduled primarily for care required prior to or following surgery (e.g., presurgery tests or removing sutures).
- Preventive care: General medical examinations and routine periodic examinations. Includes prenatal care, annual physicals, well-child exams, screening, and insurance examinations.
Selected services: Included are services that were ordered or provided during the sampled visit for the purpose of screening (i.e., early detection of health problems in asymptomatic individuals) or diagnosis (i.e., identification of health problems causing individuals to be symptomatic) (5). Each selected service item was grouped into five categories as follows:
- Examinations or screenings: Alcohol misuse, breast, depression, domestic violence, foot, neurologic, pelvic, rectal, retinal or eye, skin, and substance abuse.
- Health education or counseling: Alcohol abuse counseling, asthma, asthma action plan given to patient, diabetes education, diet or nutrition, exercise, family planning or contraception, genetic counseling, growth or development, injury prevention, sexually transmitted disease prevention, stress management, substance abuse counseling, tobacco use or exposure, and weight reduction.
- Imaging services: Includes bone mineral density, CT scan, echocardiogram, ultrasound, mammography, MRI, and X-ray.
- Laboratory tests: Includes basic metabolic panel, complete blood count, chlamydia test, comprehensive metabolic panel, creatinine or renal function panel, culture (blood, throat, urine, or other), glucose, gonorrhea test, HbA1c, hepatitis testing, HIV test, human papillomavirus DNA test, lipid profile, liver enzymes or hepatic function panel, pap test, pregnancy or HCG test, prostate-specific antigen, rapid strep test, thyroid-stimulating hormone or thyroid panel, urinalysis, and vitamin D test.
- Procedures: Includes audiometry, biopsy, cardiac stress test, colonoscopy, cryosurgery or destruction of tissue, EKG or ECG, electroencephalogram, electromyogram, excision of tissue, fetal monitoring, peak flow, sigmoidoscopy, spirometry, tonometry, tuberculosis skin testing, and upper gastrointestinal endoscopy.
Data source and methods
Data for this report are from NAMCS, which is conducted by the National Center for Health Statistics. NAMCS is an annual, nationally representative survey of office-based physicians and visits to their practices (3,5). The target universe of NAMCS is physicians classified as providing direct patient care in office-based practices. Radiologists, anesthesiologists, and pathologists are excluded, as are physicians in community health centers. The 2015 sample consists of 8,091 physicians. Participating physicians provided 28,332 visit records. The participation rate—the percentage of in-scope physicians for whom at least one visit record was completed—was 36.5%. The response rate—the percentage of in-scope physicians for whom at least one-half of their expected number of visit records was completed—was 29.6%.
Data analyses were performed using the statistical packages SAS version 9.4 (SAS Institute, Cary, N.C.) and SAS-callable SUDAAN version 11.0 (RTI International, Research Triangle Park, N.C.). Differences in the distribution of selected characteristics of office-based physician visits are based on chi-square tests (p < 0.05). If a difference was found to be statistically significant, additional pairwise tests were performed. Statements of difference in paired estimates are based on two-tailed t tests with statistical significance at the p < 0.05 level. Terms such as “higher” or “lower” indicate that the differences are statistically significant.
About the authors
Jill J. Ashman, Pinyao Rui, and Titilayo Okeyode are with the National Center for Health Statistics, Division of Health Care Statistics.
References
- Bloom B, Simpson JL. Tables of summary health statistics for U.S. children: 2015. National Health Interview Survey. National Center for Health Statistics. 2016.
- Blackwell DL, Villarroel MA. Tables of summary health statistics for U.S. adults: 2015. National Health Interview Survey. National Center for Health Statistics. 2016.
- National Center for Health Statistics. 2015 NAMCS micro-data file. Hyattsville, MD. 2017.
- Rui P, Okeyode T. National Ambulatory Medical Care Survey: 2015 state and national summary tablespdf icon.
- National Center for Health Statistics. 2015 NAMCS micro-data file documentation. Hyattsville, MD. 2017.
Suggested citation
Ashman JJ, Rui P, Okeyode T. Characteristics of office-based physician visits, 2015. NCHS Data Brief, no 310. Hyattsville, MD: National Center for Health Statistics. 2018.
Copyright information
All material appearing in this report is in the public domain and may be reproduced or copied without permission; citation as to source, however, is appreciated.
National Center for Health Statistics
Charles J. Rothwell, M.S., M.B.A., Director
Jennifer H. Madans, Ph.D., Associate Director for Science
Division of Health Care Statistics
Denys T. Lau, Ph.D., Director
Alexander Strashny, Ph.D., Associate Director for Science