Emergency Department Visits by Patients Aged 45 and Over With Diabetes: United States, 2015
- Key findings
- Did the percentage of all ED visits for patients aged 45 and over with diabetes change from 2010 to 2015?
- Did the rate of emergency department visits by patients aged 45 and over with diabetes increase with age?
- Did the primary expected source of payment for ED visits made by patients aged 45 and over differ for patients with and without diabetes?
- For patients aged 45–64 and 65 and over, did a higher percentage of diabetes-related ED visits end in inpatient hospital admission than for non-diabetes ED visits?
- Summary
- Definitions
- Data source and methods
- About the authors
- References
- Suggested citation
NCHS Data Brief No. 301, February 2018
PDF Versionpdf icon (431 KB)
Margaret J. Hall, Ph.D., Pinyao Rui, M.P.H., and Alexander Schwartzman
Key findings
Data from the National Hospital Ambulatory Medical Care Survey
- In 2015, there were an estimated 12 million emergency department (ED) visits by patients aged 45 and over with diabetes, a rate of 92 per 1,000 persons aged 45 and over.
- The percentage of all ED visits for patients aged 45 and over made by those with diabetes increased from 2012 to 2015.
- The diabetes ED visit rate was about 2.5 times higher for those aged 75 and over than the rate for those aged 45–64.
- Twenty-four percent of the diabetes ED visits for those aged 45–64 had Medicare as the primary expected payment source, compared with 14% of the ED visits for patients aged 45–64 without diabetes.
- Twenty-two percent of the diabetes ED visits for those aged 45–64 ended in hospital admission compared with 12% of the visits by patients without diabetes in that age group.
An estimated 30 million Americans have diabetes, of whom 26 million are aged 45 and over (1). Healthy eating and exercise can prevent diabetes progression (1,2). Around 12 million emergency department (ED) visits in 2015 were by patients aged 45 and over with diabetes, representing 24% of ED visits by patients aged 45 and over and 80% of diabetes ED visits by patients of all ages (3). This report presents data on ED visits by patients aged 45 and over with diabetes, defined as visits for which diabetes is mentioned as either a diagnosis or as one of a set of conditions that the patient is reported to have.
Keywords: expected source of payment, NHAMCS
Did the percentage of all ED visits for patients aged 45 and over with diabetes change from 2010 to 2015?
- In 2015, about 24% of all ED visits for patients aged 45 and over were made by those with diabetes (Figure 1).
- The percentage of all ED visits for patients aged 45 and over made by those with diabetes increased from 2012–2015.
- In 2015, the percentage of all ED visits made by patients with diabetes was higher for patients aged 65 and over compared with patients aged 45–64 (32% for 65–74 and 27% for 75 and over compared with 20% for 45–64).
Figure 1. Percentage of all emergency department visits for patients aged 45 years and older made by those with diabetes, by age and year: United States, 2010–2015
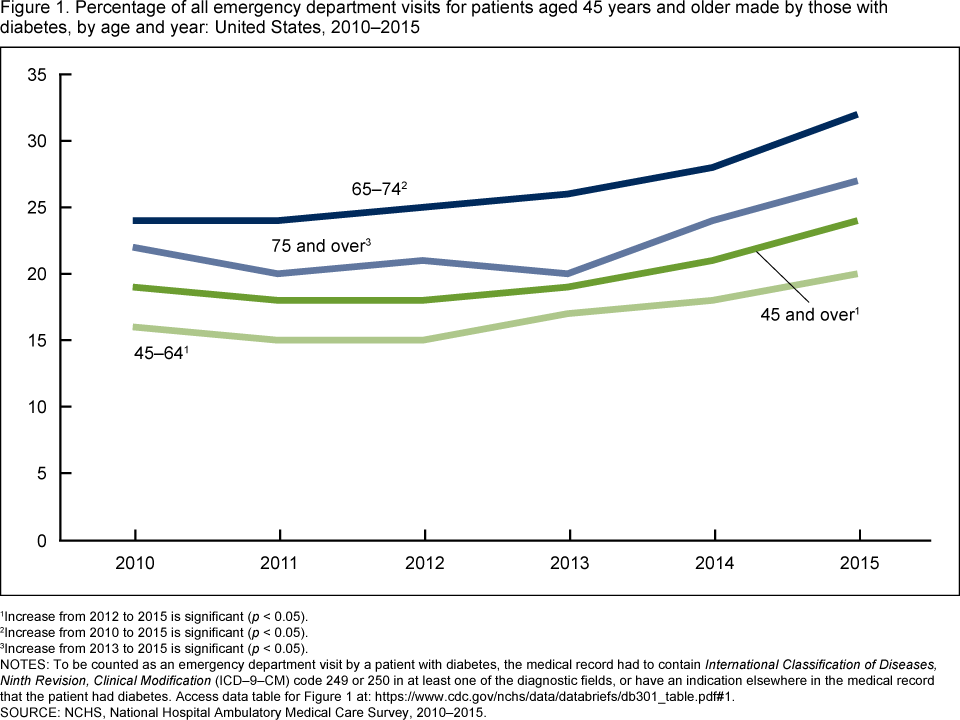
1Increase from 2012 to 2015 is significant (p < 0.05).
2Increase from 2010 to 2015 is significant (p < 0.05).
3Increase from 2013 to 2015 is significant (p < 0.05).
NOTES: To be counted as an emergency department visit by a patient with diabetes, the medical record had to contain International Classification of Diseases, Ninth Revision, Clinical Modification (ICD–9–CM) code 249 or 250 in at least one of the diagnostic fields, or have an indication elsewhere in the medical record that the patient had diabetes. Access data table for Figure 1pdf icon.
SOURCE: NCHS, National Hospital Ambulatory Medical Care Survey, 2010–2015.
Did the rate of emergency department visits by patients aged 45 and over with diabetes increase with age?
- The rate of diabetes ED visits for patients aged 45 and over increased with age (Figure 2).
- The rate ranged from 69 per 1,000 persons for those aged 45–64 to 164 per 1,000 persons for those aged 75 and over.
Figure 2. Rate of emergency department visits by patients aged 45 and over with diabetes, by age: United States, 2015
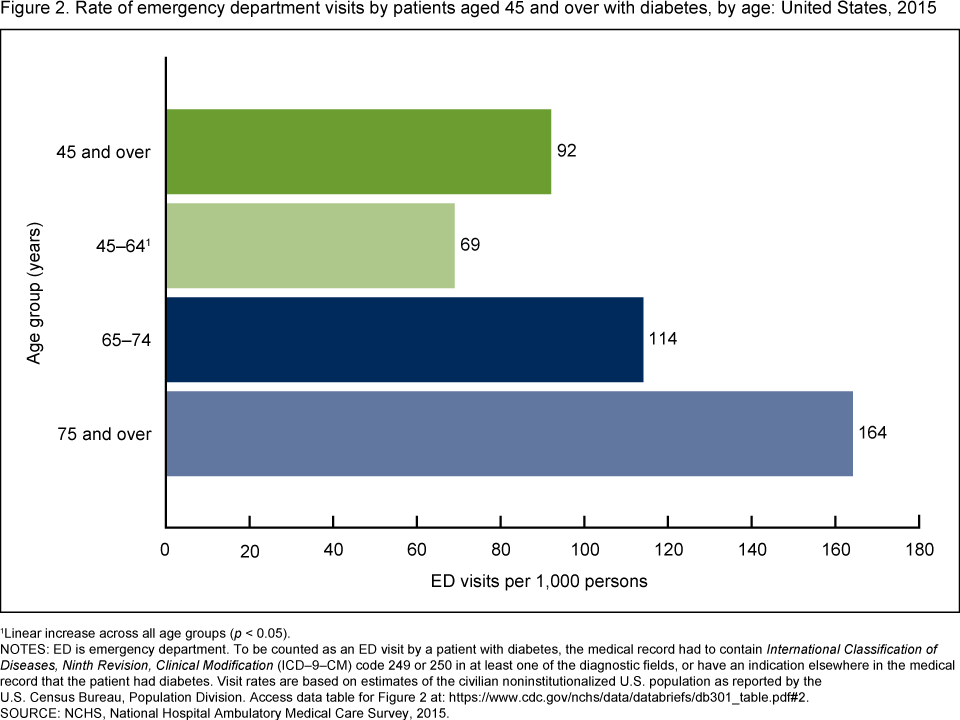
1Linear increase across all age groups (p < 0.05).
NOTES: ED is emergency department. To be counted as an ED visit by a patient with diabetes, the medical record had to contain International Classification of Diseases, Ninth Revision, Clinical Modification (ICD–9–CM) code 249 or 250 in at least one of the diagnostic fields, or have an indication elsewhere in the medical record that the patient had diabetes. Visit rates are based on estimates of the civilian noninstitutionalized U.S. population as reported by the U.S. Census Bureau, Population Division. Access data table for Figure 2pdf icon.
SOURCE: NCHS, National Hospital Ambulatory Medical Care Survey, 2015.
Did the primary expected source of payment for ED visits made by patients aged 45 and over differ for patients with and without diabetes?
- A higher percentage of ED visits for patients aged 45–64 with diabetes had Medicare as their primary expected source of payment (24%) compared to non-diabetes ED visits (14%) (Figure 3).
- A lower percentage of ED visits for patients aged 45–64 with diabetes had private insurance (32%) as their primary expected source of payment compared to non-diabetes visits (38%).
- Seventy-seven percent of ED visits made by those aged 65 and over with diabetes and 78% made by those without diabetes had Medicare as the primary expected payment source.
- Nine percent of ED visits made by those aged 65 and over had private insurance as the expected source of payment for those with and without diabetes.
Figure 3. Distribution of primary expected source of payment for emergency department visits made by those aged 45–64 and 65 and over, by diabetes status: United States, 2015
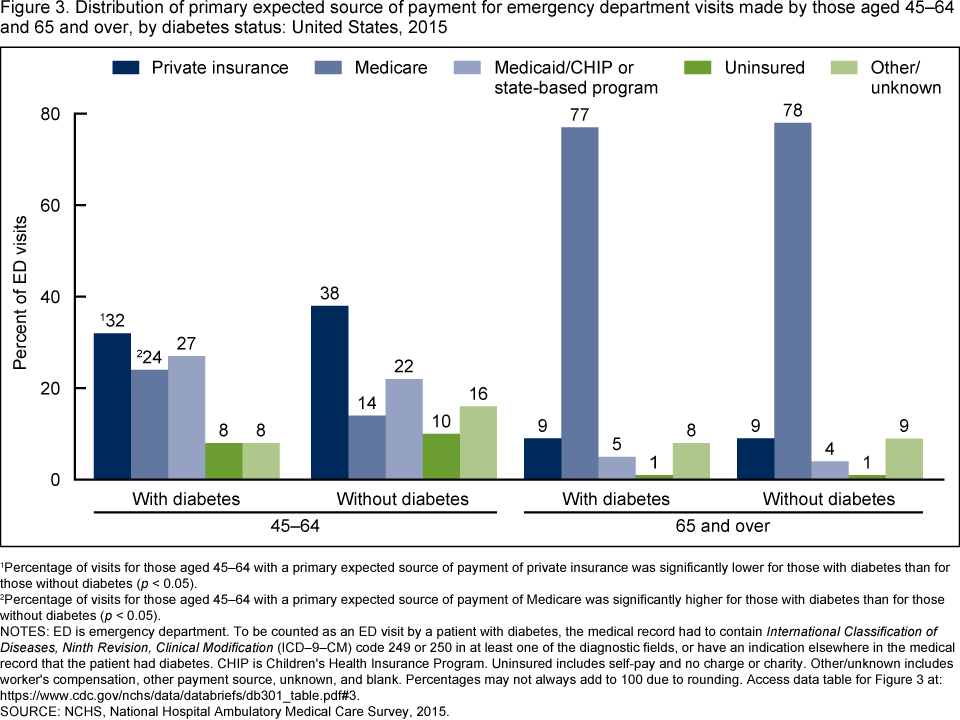
1Percentage of visits for those aged 45–64 with a primary expected source of payment of private insurance was significantly lower for those with diabetes than for those without diabetes (p < 0.05).
2Percentage of visits for those aged 45–64 with a primary expected source of payment of Medicare was significantly higher for those with diabetes than for those without diabetes (p < 0.05).
NOTES: ED is emergency department. To be counted as an ED visit by a patient with diabetes, the medical record had to contain International Classification of Diseases, Ninth Revision, Clinical Modification (ICD–9–CM) code 249 or 250 in at least one of the diagnostic fields, or have an indication elsewhere in the medical record that the patient had diabetes. CHIP is Children’s Health Insurance Program. Uninsured includes self-pay and no charge or charity. Other/unknown includes worker’s compensation, other payment source, unknown, and blank. Percentages may not always add to 100 due to rounding. Access data table for Figure 3pdf icon.
SOURCE: NCHS, National Hospital Ambulatory Medical Care Survey, 2015.
For patients aged 45–64 and 65 and over, did a higher percentage of diabetes-related ED visits end in inpatient hospital admission than for non-diabetes ED visits?
- For all patients aged 45 and over, 28% of the diabetes ED visits ended in inpatient hospital admission, which was higher than the 17% of visits by patients without diabetes (Figure 4).
- For patients aged 45–64, 22% of the diabetes ED visits ended in inpatient hospital admission, which was higher than the 12% of visits by patients without diabetes.
- For patients aged 65 and over, 34% of the diabetes ED visits ended in inpatient hospital admission, which was higher than the 26% of visits by patients without diabetes.
- For aged 65 and over, patients with and without diabetes, the percentage of ED visits that ended in inpatient hospital admission was higher than the percentage of visits for those aged 45–64.
Figure 4. Percentage of emergency department visits made by patients aged 45 and over that resulted in a hospital admission, by diabetes status: United States, 2015

1The percentage of visits for patients aged 45 and over, 45–64, and 65 and over with diabetes that ended in inpatient hospital admission was significantly higher than the percentage of visits for those in these age groups without diabetes with this discharge disposition.
2Those aged 65 and over regardless of diabetes status had a significantly higher percentage of visits ending in hospitalization than those aged 45–64.
NOTES: To be counted as an emergency department (ED) visit by a patient with diabetes, the medical record had to contain International Classification of Diseases, Ninth Revision, Clinical Modification (ICD–9–CM) code 249 or 250 in at least one of the diagnostic fields, or have an indication elsewhere in the medical record that the patient had diabetes. Hospital admission includes those ED visits where patients were admitted as an inpatient to the same hospital, and those visits after which the patient was transferred to another nonpsychiatric hospital. Access data table for Figure 4pdf icon.
SOURCE: NCHS, National Hospital Ambulatory Medical Care Survey, 2015.
Summary
This analysis of the National Hospital Ambulatory Medical Care Survey data shows that in 2015, 12 million ED visits were made by patients aged 45 and over with diabetes, accounting for around one-quarter of all ED visits by patients aged 45 and over. The diabetes ED visit rate was 92 per 1,000 persons for patients aged 45 and over, which was about 6 times higher than the diabetes ED visit rate for those under age 45 (16 per 1,000 persons). The percentage of all ED visits made by patients aged 45 and over with diabetes was highest for those aged 65–74, followed by 75 and over, and then by those aged 45–64 in all years from 2010 to 2015. The percentage of all ED visits made by patients with diabetes increased from 2010 to 2015, with the largest increases occurring from 2013–2015 in all age groups. The diabetes ED visit rate for those 75 and over was more than twice the rate for those aged 45–64. About one-quarter of the diabetes ED visits for those aged 45–64 had Medicare as the primary expected source of payment compared to 14% of visits for patients aged 45–64 without diabetes. A higher percentage of diabetes ED visits for those aged 45 and over ended in hospital admission (28%) than non-diabetes ED visits (17%).
Definitions
ED visits by patients aged 45 and over with diabetes, also referred to as diabetes ED visits: Since 2009, the National Hospital Ambulatory Medical Care Survey (NHAMCS) has asked, “Does the patient have (mark all that apply): cerebrovascular disease/history of stroke, congestive heart failure, condition requiring dialysis, HIV, diabetes, or none of the above?” This item has since changed to include additional chronic conditions. To be sure that the checkboxes are all-inclusive, during the data editing process, a consistency check is performed to be sure that any record with a visit diagnosis of any of the above chronic conditions, including diabetes, also has the checkbox marked. This report includes emergency department visits, made by patients aged 45 and over, which have documentation of diabetes (ICD–9–CM [4] diagnostic code 249 or 250) in their medical record, or which have diabetes indicated elsewhere in the patient’s medical record. Managing diabetes is the reason for some of these visits, but many other reasons, such as chest pain or an injury, are also included.
Primary expected source of payment for this visit: Private insurance: Charges paid in part or in full by a private insurer (e.g., BlueCross BlueShield), either directly to the hospital or reimbursed to the patient. Charges covered under a private insurance-sponsored prepaid plan are included.
Medicare: Charges are paid in part or in full by a Medicare plan. Includes payments made directly to the hospital as well as payments reimbursed to the patient. Charges covered under a Medicare-sponsored prepaid plan are included.
Medicaid: Charges paid in part or in full by a Medicaid plan. Includes payments made directly to the hospital or reimbursed to the patients. Charges covered under a Medicaid-sponsored prepaid plan or the Children’s Health Insurance Program (CHIP) are included.
No insurance: Includes self-pay and no charge or charity. Self-pay includes charges that are paid by the patient or patient’s family, which will not be reimbursed by a third party. Self-pay includes visits for which the patient is expected to be ultimately responsible for most of the bill, even if the patient never actually pays it. This does not include copayments or deductibles. No charge or charity is the category for visits for which no fee is charged (e.g. charity, special research, or teaching). No charge or charity does not include visits paid for as part of a total package (e.g., prepaid plan visits, postoperative visits included in a surgical fee, and pregnancy visits included in a flat fee charged for the entire pregnancy).
Other/unknown: Includes worker’s compensation, other payment source, unknown, and blank. If more than one expected source of payment was reported, the primary source was determined using the following hierarchy: Medicare, Medicaid or Children’s Health Insurance Program (CHIP), private insurance, worker’s compensation, self-pay, no charge/charity, other, and unknown.
Data source and methods
ED visit data are from the 2015 NHAMCS, a nationally representative survey of nonfederal general and short-stay hospitals that is conducted by the National Center for Health Statistics. NHAMCS uses a multistage probability design with samples of geographic primary sampling units (PSUs), hospitals within PSUs, and patient visits within EDs. In 2015, 243 hospitals reported emergency department data in NHAMCS, and data were collected on approximately 21,000 ED visits. Additional information on the methodology of NHAMCS is available online (5), as is the public-use data file (3). In addition to 2015 data, the trend data for Figure 1 were from the 2010 through 2015 NHAMCS surveys.
Data analysis was performed using the statistical packages SAS version 9.4 (SAS Institute, Cary, N.C.) and SAS-callable SUDAAN version 11.0 (RTI International, Research Triangle Park, N.C.). Differences among subgroups were evaluated using a two-tailed t test (p < 0.05). To test for linear and quadratic trends over time, the null hypothesis of nonlinear or quadratic trend was examined using the POLY option in SUDAAN. Statistical tests of trends for Figures 1 and 2 were performed using logistic regression.
About the authors
Margaret J. Hall and Alexander Schwartzman are with the National Center for Health Statistics, Division of Health Care Statistics. Pinyao Rui is with Karna, LLC.
References
- CDC. National Diabetes Statistics Report, 2017. Atlanta, GA. 2017.
- Garcia-Perez L E, Álvarez M, Dilla T, Gil-Guillén V, Orozco-Beltrán D. Adherence to therapies in patients with type 2 diabetes. Diabetes Ther 4(2):175–94. 2013.
- National Center for Health Statistics. 2015 NHAMCS micro-data set file. Hyattsville, MD. 2017.
- CDC, Centers for Medicare & Medicaid Services. International classification of diseases, ninth revision, clinical modification. 6th ed. DHHS Pub No. (PHS) 11–1260. 2011.
- National Center for Health Statistics. 2015 NHAMCS micro-data file documentationpdf icon. Hyattsville, MD. 2017.
Suggested citation
Hall MJ, Rui P, Schwartzman A. Emergency department visits by patients aged 45 and over with diabetes: United States, 2015. NCHS Data Brief, no 301. Hyattsville, MD: National Center for Health Statistics. 2018.
Copyright information
All material appearing in this report is in the public domain and may be reproduced or copied without permission; citation as to source, however, is appreciated.
National Center for Health Statistics
Charles J. Rothwell, M.S., M.B.A., Director
Jennifer H. Madans, Ph.D., Associate Director for Science
Division of Health Care Statistics
Denys T. Lau, Ph.D., Acting Director
Alexander Strashny, Ph.D., Associate Director for Science