Deaths From Unintentional Injury Among Adults Aged 65 and Over: United States, 2000–2013
- Key findings
- Unintentional injuries accounted for 85% of all injury deaths among adults aged 65 and over in the United States in 2012–2013; suicide and homicide accounted for 13% and 2%, respectively.
- The total age-adjusted unintentional injury death rate among adults aged 65 and over increased 15% from 2000 to 2013, but rates for some causes of death, including motor vehicle traffic crashes, suffocation, and fire declined during the same time period.
- Death rates for falls, motor vehicle traffic crashes, suffocation, and fire increased with age for the population aged 65 and over.
- Age-adjusted unintentional injury death rates varied by race and ethnicity among the population aged 65 and over.
- For many causes of death due to injury, the age-adjusted death rates among adults aged 65 and over were higher in nonmetropolitan areas than in metropolitan areas.
- Summary
- Definitions
- Data source and methods
- About the authors
- References
- Suggested citation
NCHS Data Brief No. 199, May 2015
PDF Versionpdf icon (712 KB)
Ellen Kramarow, Ph.D.; Li-Hui Chen, Ph.D.; Holly Hedegaard, M.D., M.S.P.H.; and Margaret Warner, Ph.D.
Key findings
Data from the National Vital Statistics System (Mortality)
- In 2012–2013, 55% of all unintentional injury deaths among adults aged 65 and over were due to falls.
- From 2000 through 2013, the age-adjusted fall injury death rate among adults aged 65 and over nearly doubled from 29.6 per 100,000 to 56.7 per 100,000.
- In 2012–2013, the death rate due to suffocation was more than 8 times higher among adults aged 85 and over (26.5 per 100,000) compared with adults aged 65–74 (3.1 per 100,000).
- Among adults aged 65 and over, the death rate due to fire was more than twice as high for non-Hispanic black adults as for non-Hispanic white and Hispanic adults.
- The death rate from motor vehicle traffic crashes among adults aged 65 and over was 1.7 times higher in nonmetropolitan areas compared with metropolitan areas.
Injury deaths place a large burden on society, and many of these deaths are preventable (1). Reducing fatal injuries is a Healthy People 2020 Leading Health Indicator, emphasizing its importance as a high-priority public health issue (2). In 2013, unintentional injuries were the eighth leading cause of death among U.S. adults aged 65 and over, resulting in nearly 46,000 deaths (3). This report describes trends in unintentional injury deaths among this age group from 2000 through 2013, highlighting differences by age, race and ethnicity, and urbanization for the five leading causes of unintentional injury death: falls, motor vehicle traffic crashes, suffocation, poisoning, and fire.
Keywords: falls, older adults, National Vital Statistics System (NVSS)
Unintentional injuries accounted for 85% of all injury deaths among adults aged 65 and over in the United States in 2012–2013; suicide and homicide accounted for 13% and 2%, respectively.
Figure 1. Percent distribution of injury deaths, by intent and cause among adults aged 65 and over: United States, 2012–2013

NOTE: Percents may not total 100% due to rounding.
SOURCE: CDC/NCHS, National Vital Statistics System, Mortality.
- More than one-half (55%) of all unintentional injury deaths among adults aged 65 and over were due to falls (Figure 1).
- Fourteen percent of unintentional injury deaths for this age group were caused by motor vehicle traffic crashes, resulting in more than 6,000 deaths per year.
- Suffocation, including deaths from positional asphyxia and choking on food or other objects, was the third leading cause of unintentional injury death among adults aged 65 and over, accounting for 8% of unintentional injury deaths.
- Ten percent of unintentional injury deaths among adults aged 65 and over were coded as “cause unspecified.”
The total age-adjusted unintentional injury death rate among adults aged 65 and over increased 15% from 2000 to 2013, but rates for some causes of death, including motor vehicle traffic crashes, suffocation, and fire declined during the same time period.
- The age-adjusted fall injury death rate among adults aged 65 and over increased from 29.6 per 100,000 in 2000 to 56.7 per 100,000 in 2013 (Figure 2).
Figure 2. Age-adjusted death rates, by cause of death among adults aged 65 and over: United States, 2000–2013
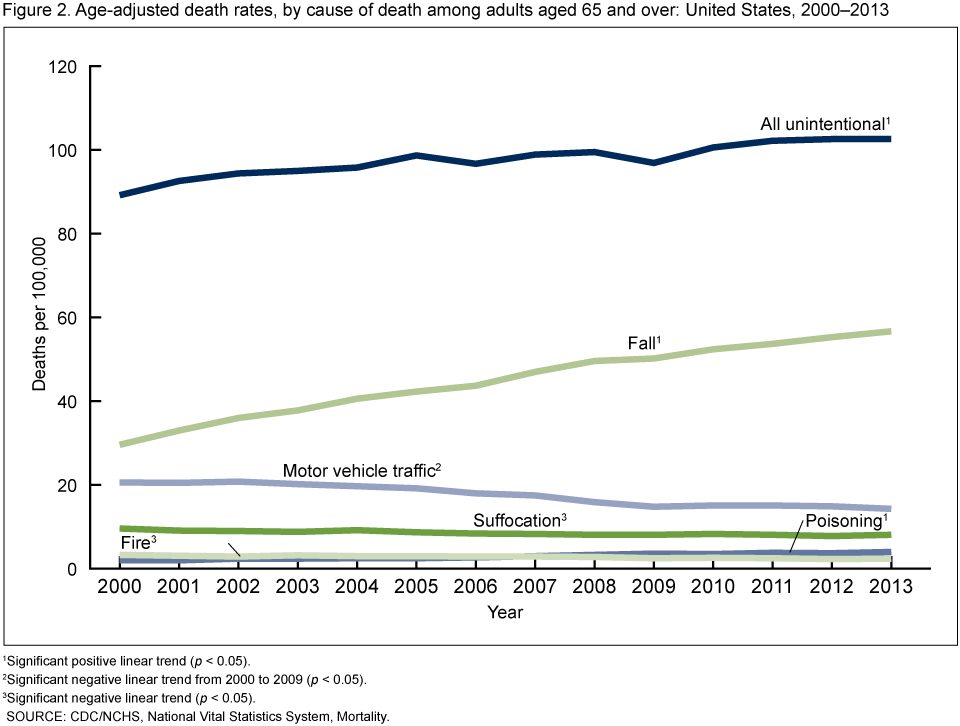
1Significant positive linear trend (p < 0.05).
2Significant negative linear trend from 2000 to 2009 (p < 0.05).
3Significant negative linear trend (p < 0.05).
SOURCE: CDC/NCHS, National Vital Statistics System, Mortality.
- The age-adjusted death rate due to motor vehicle traffic crashes was lower in 2013 than in 2000, with significant declines occurring until 2009. Since 2009, rates have remained steady at approximately 15 deaths per 100,000.
- The age-adjusted death rate for unintentional poisoning among the population aged 65 and over increased on average by 6% per year from 2000 through 2013.
- Age-adjusted death rates for suffocation and fire declined from 2000 through 2013, from 9.6 to 8.1 per 100,000 for suffocation and from 3.3 to 2.4 per 100,000 for fire.
Death rates for falls, motor vehicle traffic crashes, suffocation, and fire increased with age for the population aged 65 and over.
- In 2012–2013, the fall death rate among adults aged 85 and over (226.1 per 100,000) was nearly 4 times higher than among people aged 75–84 (59.0 per 100,000) and 16 times higher than among people aged 65–74 (14.1 per 100,000) (Figure 3).
Figure 3. Death rates, by age group and cause of death among adults aged 65 and over: United States, 2012–2013

NOTE: Death rates are significantly different for all age group comparisons for each cause of death.
SOURCE: CDC/NCHS, National Vital Statistics System, Mortality.
- The death rate due to motor vehicle traffic crashes was 1.7 times higher among adults aged 85 and over (19.9 per 100,000) compared with adults aged 65–74 (11.9 per 100,000).
- The death rate due to suffocation was more than 8 times higher among adults aged 85 and over (26.5 per 100,000) compared with adults aged 65–74 (3.1 per 100,000).
- The unintentional poisoning death rate for adults aged 75–84 (2.8 per 100,000) was lower than the rates for people aged 65–74 (4.7 per 100,000) and 85 and over (3.7 per 100,000).
- The rate of death due to fire among people aged 85 and over (3.6 per 100,000) was more than twice as high as the rate among people aged 65–74 (1.7 per 100,000).
Age-adjusted unintentional injury death rates varied by race and ethnicity among the population aged 65 and over.
- Age-adjusted fall injury death rates among those aged 65 and over were higher for non-Hispanic white persons (61.4 per 100,000) compared with non-Hispanic black persons (23.3 per 100,000) and Hispanic persons (36.2 per 100,000) (Figure 4).
Figure 4. Age-adjusted death rates, by race and ethnicity and cause of death among adults aged 65 and over: United States, 2012–2013
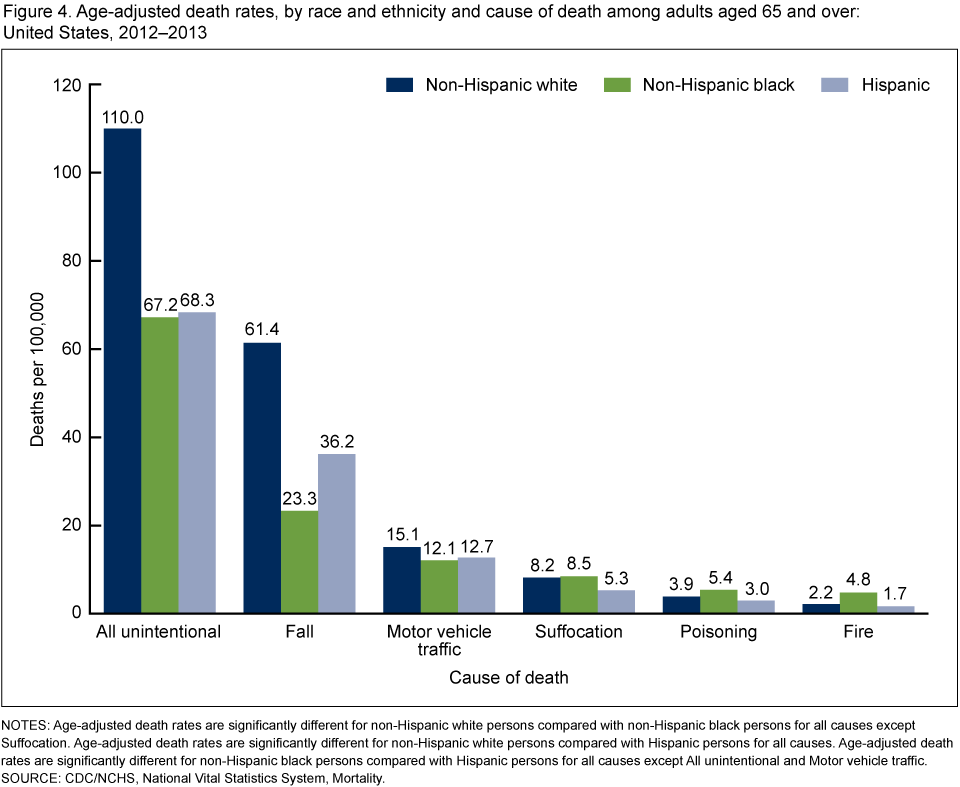
NOTES: Age-adjusted death rates are significantly different for non-Hispanic white persons compared with non-Hispanic black persons for all causes except Suffocation. Age-adjusted death rates are significantly different for non-Hispanic white persons compared with Hispanic persons for all causes. Age-adjusted death rates are significantly different for non-Hispanic black persons compared with Hispanic persons for all causes except All unintentional and Motor vehicle traffic.
SOURCE: CDC/NCHS, National Vital Statistics System, Mortality.
- The age-adjusted death rate for motor vehicle traffic crashes was higher for non-Hispanic white persons (15.1 per 100,000) compared with non-Hispanic black (12.1 per 100,000) and Hispanic persons (12.7 per 100,000).
- For adults aged 65 and over, the age-adjusted death rate for suffocation was lower among Hispanic persons (5.3 per 100,000) than among non-Hispanic black persons (8.5 per 100,000) and non-Hispanic white persons (8.2 per 100,000).
- The death rate for unintentional poisoning for non-Hispanic black persons aged 65 and over (5.4 per 100,000) was higher than the rate for non-Hispanic white (3.9 per 100,000) or Hispanic persons (3.0 per 100,000).
- Among adults aged 65 and over, the age-adjusted rate of death due to fire for non-Hispanic black persons (4.8 per 100,000) was more than twice as high as the rate among non-Hispanic white persons (2.2 per 100,000) and Hispanic persons (1.7 per 100,000).
For many causes of death due to injury, the age-adjusted death rates among adults aged 65 and over were higher in nonmetropolitan areas than in metropolitan areas.
- The age-adjusted death rate from motor vehicle traffic crashes among adults aged 65 and over was 1.7 times higher in nonmetropolitan areas (22.4 per 100,000) than in metropolitan areas (12.9 per 100,000) (Figure 5).
Figure 5. Age-adjusted death rates, by urbanization and cause of death among adults aged 65 and over: United States, 2012–2013

NOTE: Age-adjusted death rates are significantly different for metropolitan locations compared with nonmetropolitan locations for all causes except Fall and Poisoning.
SOURCE: CDC/NCHS, National Vital Statistics System, Mortality.
- The age-adjusted death rate from fire among people aged 65 and over was nearly 2 times higher in nonmetropolitan areas (3.9 per 100,000) than in metropolitan areas (2.0 per 100,000).
- The age-adjusted death rate due to suffocation was higher in nonmetropolitan areas (9.5 per 100,000) compared with metropolitan areas (7.7 per 100,000).
- Among adults aged 65 and over, the age-adjusted death rates due to falls and unintentional poisoning did not vary by metropolitan location.
Summary
During 2012–2013, 90,640 adults aged 65 and over died from unintentional injuries (3). Slightly more than one-half of these injury deaths were due to falls. Age-adjusted death rates for all unintentional injuries have been increasing since 2000, although the rates for some causes have declined. Motor vehicle traffic crashes as a cause of death among people aged 65 and over decreased, as they have for younger ages, from a rate of 20.6 deaths per 100,000 in 2000 to 14.3 per 100,000 in 2013 (3,4). Age-adjusted death rates for unintentional poisonings and falls have increased, drawing the attention of public health experts and resulting in ongoing prevention activities (5). Fatal falls among the older population may be increasing for many reasons. Some research suggests that at least a portion of this increase is due to improved reporting of falls (6).
Among adults aged 65 and over, injury death rates vary by age, race and ethnicity, and level of urbanization. Death rates for the population aged 85 and over were higher than rates among adults aged 65–84 for each of the leading causes of unintentional injury death except unintentional poisoning. The death rate for falls was higher among older non-Hispanic white persons than among older non-Hispanic black or Hispanic persons; the death rate for fire was higher among non-Hispanic black persons than among non-Hispanic white or Hispanic persons. Similar to other age groups, the motor vehicle traffic crash death rate for adults aged 65 and over was higher in nonmetropolitan areas compared with metropolitan areas (7).
Many public health initiatives are directed toward preventing injury deaths among the older population. Among its injury and violence prevention objectives, Healthy People 2020 has identified specific targets for fall and suffocation deaths among the population aged 65 and over (see Healthy People 2020 Injury and Violence Prevention Objectives 23.2 and 24.3) (2).
Definitions
Age-adjusted death rates: Age-adjusted death rates are useful when comparing different populations because they remove the potential bias that can occur when the populations being compared have different age structures. The National Center for Health Statistics (NCHS) uses the direct method of standardization. For more discussion, see Appendix II, Definitions and Methods of “Health, United States, 2013” (8).
Cause-of-death classification: Medical information from death certificates, including injury diagnoses and external causes of injury, that is classified and coded in accordance with the International Statistical Classification of Diseases and Related Health Problems, 10th Revision (ICD–10) (9). Corresponding cause-of-death categories and ICD–10 codes presented in this report are as follows:
- Homicide: U01–U02, X85–Y09, Y87.1
- Legal intervention or operation of war: Y35–Y36, Y89(.0,.1)
- Suicide: U03, X60–X84, Y87.0
- Undetermined: Y10–Y34, Y87.2, Y89.9
-
Unintentional: V01–X59, Y85–Y86
- Fall: W00–W19
- Fire: X00–X09
-
Motor vehicle traffic: [V02–V04](.1,.9), V09.2, [V12–V14](.3–.9), V19(.4–.6), [V20–
V28](.3–.9), [V29–V79](.4–.9), V80(.3–.5), V81.1, V82.1, [V83–V86](.0–.3),
V87(.0–.8), V89.2 - Poisoning: X40–X49
- Suffocation: W75–W84
- Unspecified: X59
Injury deaths: Includes deaths that are caused by forces external to the body.
Mechanism of injury: Classifies the external cause of the injury death (e.g., drowning, fall, fire, firearm, motor vehicle traffic crash, poisoning, or suffocation).
Urbanization: NCHS developed a six-level urban–rural classification scheme for the 3,143 U.S. counties and county-equivalents. Each death is associated with a category based on the county of the person’s legal residence. Metropolitan areas include counties in metro areas with 50,000 or greater population, including surrounding areas with strong economic ties to the central county (10).
Data source and methods
All data are from the 2000–2013 mortality files of the National Vital Statistics System. Trends in death rates were evaluated using the Joinpoint Regression Program (11). Text statements were tested for statistical significance using methods described elsewhere (12), and a statement that a given death rate is higher or lower than another rate indicates that the difference in the rates is statistically significant.
About the authors
Ellen Kramarow, Li-Hui Chen, and Holly Hedegaard are with CDC’s National Center for Health Statistics (NCHS), Office of Analysis and Epidemiology; Margaret Warner is with NCHS’ Division of Vital Statistics.
References
- Bergen G, Chen LH, Warner M, Fingerhut LA. Injury in the United States: 2007 Chartbook. Hyattsville, MD: National Center for Health Statistics. 2008.
- HHS. Office of Disease Prevention and Health Promotion. Healthy People 2020external icon. Washington, DC.
- NCHS. Mortality multiple cause files, 2000–2013.
- U.S. Department of Transportation. National Highway Traffic Safety Administration. 2013 Motor vehicle crashes: Overview pdf icon[PDF – 737KB]external icon. 2014.
- CDC. STEADI (Stopping Elderly Accidents, Deaths & Injuries) toolkit for health care providers.
- Stevens JA, Rudd RA. Circumstances and contributing causes of fall deaths among persons aged 65 and older: United States, 2010. J Am Geriatr Soc 62(3):470–5. 2014.
- Myers SR, Branas CC, French BC, Nance ML, Kallan MJ, Wiebe DJ, Carr BG. Safety in numbers: Are major cities the safest places in the United States? Ann Emerg Med 62(4):408–18. 2013.
- National Center for Health Statistics. Health, United States, 2013: With Special Feature on Prescription Drugs. Hyattsville, MD. 2014.
- WHO. International statistical classification of diseases and related health problems, 10th revision (ICD–10). 2nd ed. Geneva, Switzerland. 2004.
- Ingram DD, Franco SJ. 2013 NCHS urban–rural classification scheme for counties. National Center for Health Statistics. Vital Health Stat 2(166). 2014.
- National Cancer Institute. Joinpoint Regression Program (Version 3.4.3.) [computer software]. 2010.
- Murphy SL, Xu J, Kochanek KD. Deaths: Final data for 2010. National vital statistics reports; vol 61 no 4. Hyattsville, MD: National Center for Health Statistics. 2013.
Suggested citation
Kramarow E, Chen LH, Hedegaard H, Warner M. Deaths from unintentional injury among adults aged 65 and over: United States, 2000–2013. NCHS data brief, no 199. Hyattsville, MD: National Center for Health Statistics. 2015.
Copyright information
All material appearing in this report is in the public domain and may be reproduced or copied without permission; citation as to source, however, is appreciated.
National Center for Health Statistics
Charles J. Rothwell, M.S., M.B.A., Director
Nathaniel Schenker, Ph.D., Deputy Director
Jennifer H. Madans, Ph.D., Associate Director for Science
Office of Analysis and Epidemiology
Irma E. Arispe, Ph.D., Director
Division of Vital Statistics
Delton Atkinson, M.P.H., M.P.H., P.M.P., Director