Drug-poisoning Deaths Involving Heroin: United States, 2000–2013
- Key findings
- While the age-adjusted rate for drug-poisoning deaths involving opioid analgesics has leveled in recent years, the rate for deaths involving heroin has almost tripled since 2010.
- In 2013, the number of drug-poisoning deaths involving heroin was nearly four times higher for men than women.
- The rate for heroin-related drug-poisoning deaths was highest among adults aged 25–44 from 2000 through 2013.
- In 2000, non-Hispanic black persons aged 45–64 had the highest rate for drug-poisoning deaths involving heroin. In 2013, non-Hispanic white persons aged 18–44 had the highest rate.
- From 2000 through 2013, the age-adjusted rate for drug-poisoning deaths involving heroin increased for all regions of the country, with the greatest increase seen in the Midwest.
- Summary
- Data source and methods
- About the authors
- References
- Suggested citation
NCHS Data Brief No. 190, March 2015
PDF Version (718 KB)
Holly Hedegaard, M.D., M.S.P.H., Li-Hui Chen, M.S., Ph.D., and Margaret Warner, Ph.D.
Key findings
Data from the National Vital Statistics System (Mortality)
- From 2000 through 2013, the age-adjusted rate for drug-poisoning deaths involving heroin nearly quadrupled from 0.7 deaths per 100,000 in 2000 to 2.7 deaths per 100,000 in 2013. Most of the increase occurred after 2010.
- The number of drug-poisoning deaths involving heroin was nearly four times higher for men (6,525 deaths) than women (1,732 deaths) in 2013.
- In 2000, non-Hispanic black persons aged 45–64 had the highest rate for drug-poisoning deaths involving heroin (2.0 per 100,000). In 2013, non-Hispanic white persons aged 18–44 had the highest rate (7.0 per 100,000).
- From 2000 through 2013, the age-adjusted rate for drug-poisoning deaths involving heroin increased for all regions of the country, with the greatest increase seen in the Midwest.
Drug poisoning (overdose) is the number one cause of injury-related death in the United States, with 43,982 deaths occurring in 2013 (1). While much attention has been given to deaths involving opioid analgesics (2), in recent years there has been a steady increase in the number of drug-poisoning deaths involving heroin. A recent study using data from 28 states reported that the death rate for heroin overdose doubled from 2010 through 2012 (3). Using data from the National Vital Statistics System, this data brief provides a description of trends and demographics for heroin-related drug-poisoning deaths in the United States from 2000 through 2013.
Keywords: overdose, mortality, National Vital Statistics System
While the age-adjusted rate for drug-poisoning deaths involving opioid analgesics has leveled in recent years, the rate for deaths involving heroin has almost tripled since 2010.
Figure 1. Age-adjusted rates for drug-poisoning deaths, by type of drug: United States, 2000–2013

NOTES: The number of drug-poisoning deaths in 2013 was 43,982, the number of drug-poisoning deaths involving opioid analgesics was 16,235, and the number of drug-poisoning deaths involving heroin was 8,257. A small subset of 1,342 deaths involved both opioid analgesics and heroin. Deaths involving both opioid analgesics and heroin are included in both the rate of deaths involving opioid analgesics and the rate of deaths involving heroin. Access data table for Figure 1 [PDF – 86KB].
SOURCE: CDC/NCHS, National Vital Statistics System, Mortality.
From 2000 through 2013, the age-adjusted rate for drug-poisoning deaths involving opioid analgesics was higher than the rate for drug-poisoning deaths involving heroin (Figure 1). The age-adjusted rate for opioid-analgesic poisoning deaths increased at a faster pace from 2000 through 2006 (19% per year) than from 2006 through 2013 (2% per year). From 2010 through 2013, the age-adjusted rate for opioid-analgesic poisoning deaths declined slightly from 5.4 to 5.1 per 100,000. In contrast, the age-adjusted rate for drug-poisoning deaths involving heroin showed a different pattern with a slower pace of increase between 2000 and 2010 (6% per year) and a faster pace of increase from 2010 forward (37% per year). From 2010 through 2013, the age-adjusted rate for heroin-related drug-poisoning deaths nearly tripled from 1.0 per 100,000 in 2010 to 2.7 per 100,000 in 2013.
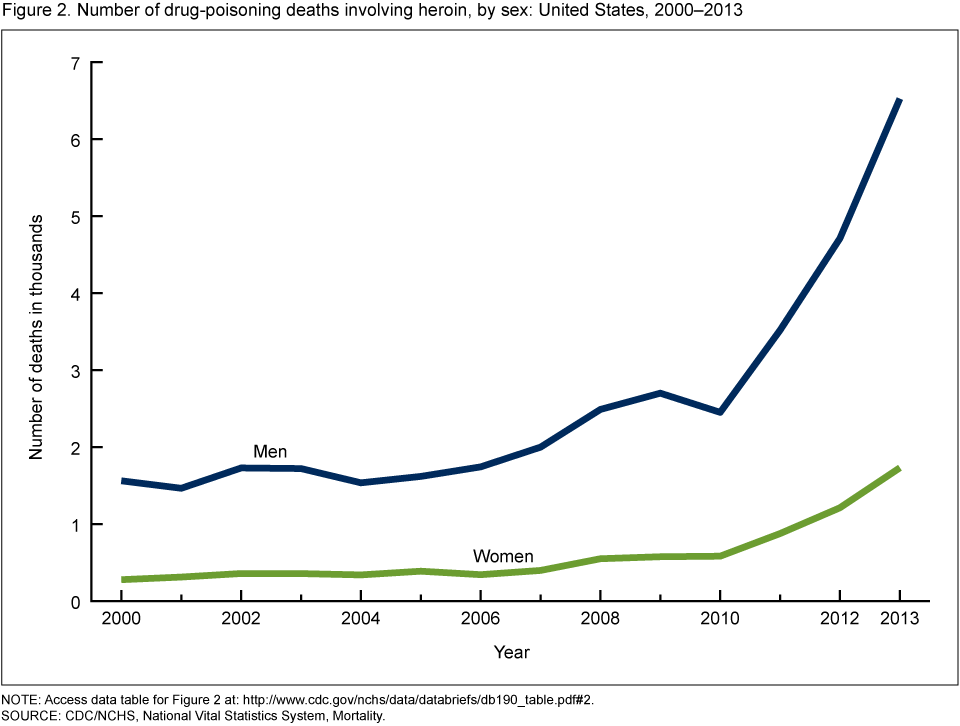
In 2013, the number of drug-poisoning deaths involving heroin was nearly four times higher for men than women.
More men than women died from drug poisoning involving heroin (Figure 2). In 2013, the number of heroin-related drug-poisoning deaths for men (6,525 deaths) was nearly four times that for women (1,732 deaths). From 2010 through 2013, the age-adjusted rate increased from 1.6 to 4.2 per 100,000 for men and from 0.4 to 1.2 per 100,000 for women.
Figure 2. Number of drug-poisoning deaths involving heroin, by sex: United States, 2000–2013
NOTE: Access data table for Figure 2 [PDF – 86KB].
SOURCE: CDC/NCHS, National Vital Statistics System, Mortality.
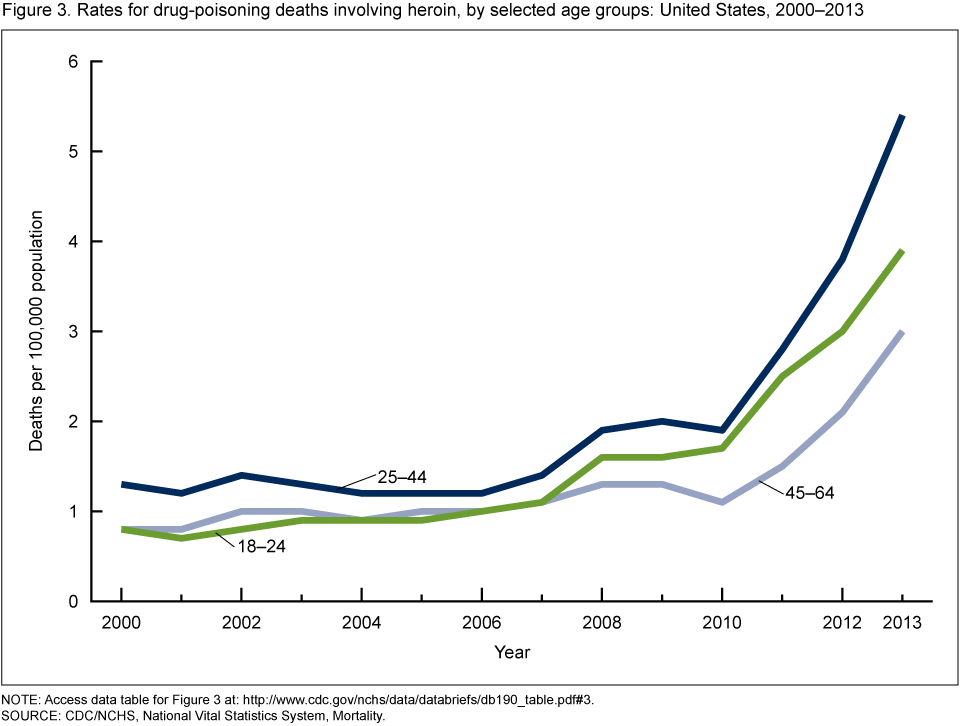
The rate for heroin-related drug-poisoning deaths was highest among adults aged 25–44 from 2000 through 2013.
Compared with adults aged 18–24 and 45–64, those aged 25–44 had the highest rate for drug-poisoning deaths involving heroin (Figure 3). From 2000 through 2010, the average annual increase in the rates was 10% for adults aged 18–24, 5% for those aged 25–44, and 4% for those aged 45–64. From 2010 through 2013, the death rate for adults aged 18–24 increased 2.3-fold from 1.7 to 3.9 per 100,000, for those aged 25–44 the rate increased 2.8-fold from 1.9 to 5.4, and for those aged 45–64 the rate increased 2.7-fold from 1.1 to 3.0.
Figure 3. Rates for drug-poisoning deaths involving heroin, by selected age groups: United States, 2000–2013
NOTE: Access data table for Figure 3 [PDF – 86KB].
SOURCE: CDC/NCHS, National Vital Statistics System, Mortality.
In 2000, non-Hispanic black persons aged 45–64 had the highest rate for drug-poisoning deaths involving heroin. In 2013, non-Hispanic white persons aged 18–44 had the highest rate.
In 2000, the highest rate for drug-poisoning deaths involving heroin was among non-Hispanic black persons aged 45–64 (2.0 per 100,000) (Figure 4). In contrast, in 2013, the rate was highest among non-Hispanic white persons aged 18–44 (7.0 per 100,000). From 2000 through 2013, rates increased for both age groups (18–44 and 45–64) and race and ethnicity groups (non-Hispanic white, non-Hispanic black, and Hispanic), with the largest increases seen among non-Hispanic white persons.
Figure 4. Rates for drug-poisoning deaths involving heroin, by selected age and race and ethnicity groups: United States, 2000 and 2013
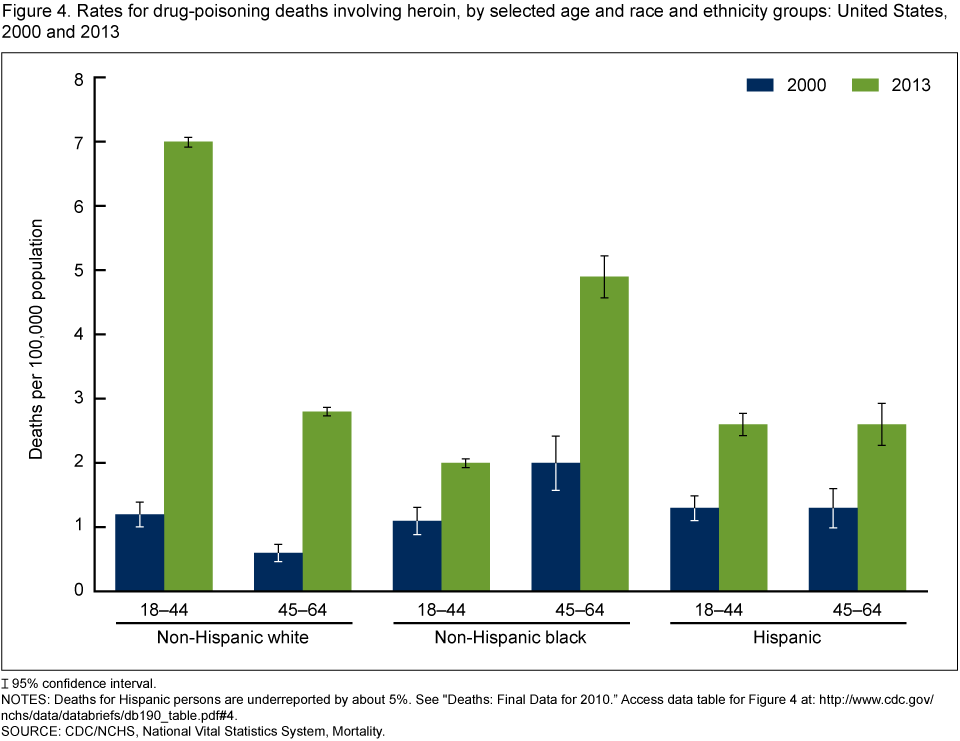
I 95% confidence interval.
NOTES: Deaths for Hispanic persons are underreported by about 5%. See “Deaths: Final Data for 2010.” Access data table for Figure 4 [PDF – 86KB].
SOURCE: CDC/NCHS, National Vital Statistics System, Mortality.
From 2000 through 2013, the age-adjusted rate for drug-poisoning deaths involving heroin increased for all regions of the country, with the greatest increase seen in the Midwest.
In 2000, age-adjusted rates for drug-poisoning deaths involving heroin were higher in the Northeast and West regions (0.9 per 100,000) (Figure 5). In contrast, in 2013, the Midwest and Northeast regions had higher rates (4.3 and 3.9 per 100,000, respectively). From 2000 through 2013, the age-adjusted rate for heroin-related drug-poisoning deaths increased nearly 11-fold in the Midwest region (from 0.4 to 4.3 per 100,000), more than 4-fold in the Northeast region (from 0.9 to 3.9), more than 3-fold in the South region (from 0.5 to 1.7), and doubled in the West region (from 0.9 to 1.8).
Figure 5. Age-adjusted rates for drug-poisoning deaths involving heroin, by census region: United States, 2000, 2007, and 2013
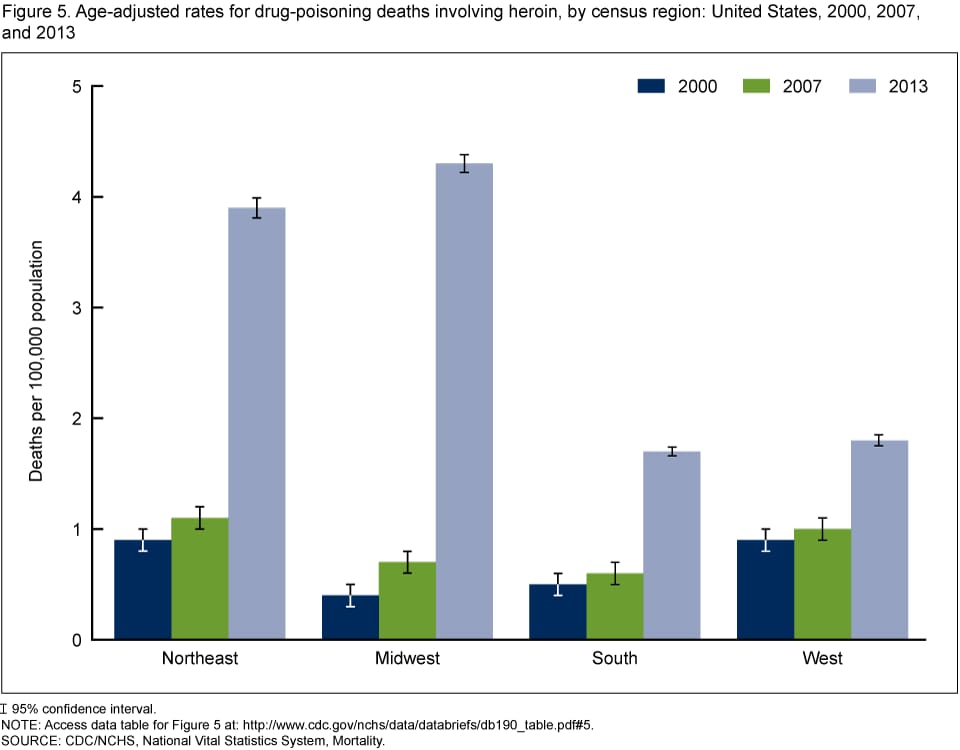
I 95% confidence interval.
NOTE: Access data table for Figure 5 [PDF – 86KB].
SOURCE: CDC/NCHS, National Vital Statistics System, Mortality.
Summary
This report provides the latest national statistics on drug overdose deaths involving heroin, highlighting the substantial increase in death rates and the populations most at risk. From 2000 through 2013, the age-adjusted rate for drug-poisoning deaths involving heroin nearly quadrupled from 0.7 per 100,000 in 2000 to 2.7 per 100,000 in 2013. During this 14-year period, the age-adjusted rate showed an average increase of 6% per year from 2000 through 2010, followed by a larger average increase of 37% per year from 2010 through 2013.
Identifying populations at high risk of heroin-related drug-poisoning death can help target prevention strategies. The number of heroin-related drug-poisoning deaths among men was nearly four times higher than among women. Since 2000, the rates for drug-poisoning death involving heroin have increased for all age and race and ethnicity groups, with adults aged 25–44 having the highest rate. Heroin-related drug-poisoning deaths increased for all regions of the country from 2000 through 2013, with the greatest increase seen in the Midwest.
Data source and methods
Estimates are based on the National Vital Statistics System multiple cause-of-death mortality files (4). Deaths were classified using the International Classification of Diseases, Tenth Revision (ICD–10). Drug-poisoning deaths were defined as having an ICD–10 underlying cause-of-death code of X40–X44 (unintentional), X60–X64 (suicide), X85 (homicide), or Y10–Y14 (undetermined intent) (5). Of the drug-poisoning deaths in 2013, 81% were unintentional, 12% were suicides, 6% were of undetermined intent, and less than 1% were homicides. Among deaths with drug poisoning as the underlying cause, the types of drugs involved are indicated by the ICD–10 multiple cause-of-death codes of T40.1 for heroin and T40.2, T40.3, or T40.4 for opioid analgesics.
Age-adjusted death rates were calculated using the direct method and the 2000 standard population (6). Data for Hispanic origin should be interpreted with caution. Studies comparing Hispanic origin on death certificates and on census surveys have shown inconsistent reporting on Hispanic ethnicity (6). Geographic regions were based on census definitions (7). Trends in death rates and number of deaths were evaluated using the Joinpoint Regression Program (8). Comparisons of rates among different groups were tested for statistical significance using methods described elsewhere (6); a statement that a given death rate is higher or lower than another rate indicates that the difference in the rates is statistically significant.
Several factors related to death investigation and reporting may affect measurement of death rates involving specific drugs. For example, toxicological tests to determine the types of drugs present may vary by jurisdiction (9). Measurement errors related to these factors are more likely to affect substance-specific death rates than the overall drug-poisoning death rate. In 2013, 22% of drug-poisoning deaths did not include information on the specific types of drugs involved. Some of these deaths could potentially involve heroin or opioid analgesics.
Metabolic breakdown of heroin into morphine in the body can make it difficult to distinguish between deaths from heroin and deaths from morphine based on the information on the death certificate. Some deaths reported to involve morphine could actually be deaths from heroin. This may result in an undercount of heroin-related deaths.
Drug-poisoning deaths may involve multiple drugs. Analysis shows that approximately 16% of the drug-poisoning deaths involving heroin also involve opioid analgesics. This percentage is relatively consistent across time, age groups, and race and ethnicity groups.
About the authors
Holly Hedegaard and Li-Hui Chen are with CDC’s National Center for Health Statistics (NCHS), Office of Analysis and Epidemiology; Margaret Warner is with NCHS Division of Vital Statistics.
References
- Chen LH, Hedegaard H, Warner M. QuickStat: Rates of death from drug poisoning and drug poisoning involving opioid analgesics—United States, 1999–2013. MMWR 64(01):32. 2015.
- Chen LH, Hedegaard H, Warner M. Drug-poisoning deaths involving opioid analgesics: United States, 1999–2011 [PDF – 724.4KB]. NCHS data brief, no 166. Hyattsville, MD: National Center for Health Statistics. 2014.
- Rudd RA, Paulozzi LJ, Bauer MJ, et al. Increases in heroin overdose deaths—28 states, 2010 to 2012. MMWR 63(39):849–54. 2014.
- Kochanek KD, Murphy SL, Xu JQ, Arias E. Mortality in the United States, 2013 [PDF – 416KB]. NCHS data brief, no 178. Hyattsville, MD: National Center for Health Statistics. 2014.
- Bergen G, Chen LH, Warner M, Fingerhut LA. Injury in the United States: 2007 Chartbook [PDF – 6.56KB]. Hyattsville, MD: National Center for Health Statistics. 2008.
- Murphy SL, Xu JQ, Kochanek KD. Deaths: Final data for 2010 [PDF – 3.03MB]. National vital statistics reports; vol 61 no 4. Hyattsville, MD: National Center for Health Statistics. 2013.
- U.S. Census Bureau. Census regions and divisions of the United States [PDF – 1.07MB].
- National Cancer Institute. Joinpoint Regression Program (Version 3.4.3.) [computer software]. 2010.
- Warner M, Paulozzi LJ, Nolte KB, Davis GG, Nelson LS. State variation in certifying manner of death and drugs involved in drug intoxication deaths. Acad Forensic Pathol 3(2):231–7. 2013.
Suggested citation
Hedegaard H, Chen LH, Warner M. Drug-poisoning deaths involving heroin: United States, 2000–2013. NCHS data brief, no 190. Hyattsville, MD: National Center for Health Statistics. 2015.
Copyright information
All material appearing in this report is in the public domain and may be reproduced or copied without permission; citation as to source, however, is appreciated.
National Center for Health Statistics
Charles J. Rothwell, M.S., M.B.A., Director
Nathaniel Schenker, Ph.D., Deputy Director
Jennifer H. Madans, Ph.D., Associate Director for Science
Office of Analysis and Epidemiology
Irma E. Arispe, Ph.D., Director