Rural Residents Who Are Hospitalized in Rural and Urban Hospitals: United States, 2010
- Key findings
- Hospitalized rural residents were more likely to receive care in a rural rather than an urban hospital.
- The age distribution of rural residents hospitalized in rural hospitals was different from the age distribution of those hospitalized in urban hospitals.
- The expected payment source for hospitalized rural residents differed depending on whether they were hospitalized in rural or urban hospitals.
- Rural residents hospitalized in urban hospitals were more likely to have at least one surgical or nonsurgical procedure than those hospitalized in rural hospitals.
- The discharge status of hospitalized rural residents differed depending on whether they were hospitalized in a rural or an urban hospital.
- Summary
- Definitions
- Data source and methods
- About the authors
- References
- Suggested citation
NCHS Data Brief No. 159, July 2014
PDF Version (551 KB)
Margaret Jean Hall, Ph.D., and Maria F. Owings, Ph.D.
Key findings
Data from the National Hospital Discharge Survey, 2010
- Sixty percent of the 6.1 million rural residents who were hospitalized in 2010 went to rural hospitals; the remaining 40% went to urban hospitals.
- Rural residents who remained in rural areas for their hospitalization were more likely to be older and on Medicare compared with those who went to urban areas.
- Almost three-quarters of rural residents who traveled to urban areas received surgical or nonsurgical procedures during their hospitalization (74%), compared with only 38% of rural residents who were hospitalized in rural hospitals.
- More than 80% of rural residents who were discharged from urban hospitals had routine discharges (81%), generally to their homes, compared with 63% of rural residents discharged from rural hospitals.
In 2010, 17% of the U.S. population lived in rural (nonmetropolitan) areas (1). Many rural areas are medically underserved due to physician (especially specialist) shortages (2-4). Rural hospitals often are small, with a low volume of services, and have difficulty remaining financially viable under the regular hospital prospective payment system (3). Special Medicare hospital payment categories have been established so that rural residents have access to hospital care without traveling to urban areas (2,5). The share of rural residents’ hospitalizations that take place in urban (metropolitan) compared with rural hospitals has been of interest for a number of years (3,6,7). Those who go to urban hospitals have been described as “bypassing” rural hospitals. This data brief compares characteristics of rural residents who stay in rural areas with those who travel to urban areas for their inpatient care.
Keywords: National Hospital Discharge Survey, inpatient hospital utilization procedures, bypass
Hospitalized rural residents were more likely to receive care in a rural rather than an urban hospital.
Figure 1. Percent distribution of hospitalized rural residents, by hospital location: United States, 2010
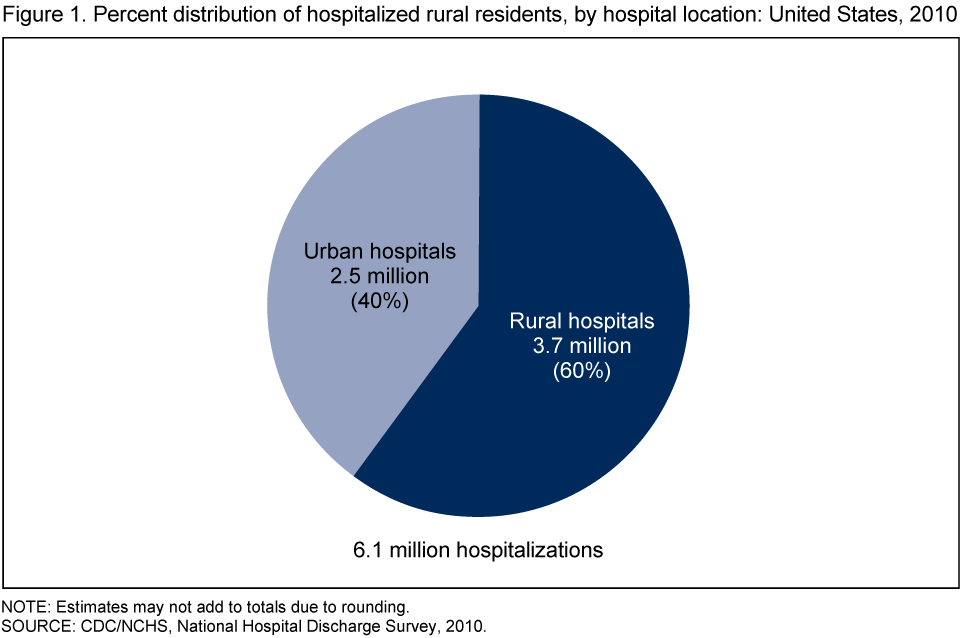
NOTE: Estimates may not add to totals due to rounding.
SOURCE: CDC/NCHS, National Hospital Discharge Survey, 2010.
- In 2010, 60% (3.7 million) of rural residents who were hospitalized were in rural hospitals, while the other 40% (2.5 million) were in urban hospitals (Figure 1).
The age distribution of rural residents hospitalized in rural hospitals was different from the age distribution of those hospitalized in urban hospitals.
- About one-half of rural residents hospitalized in rural hospitals were aged 65 and over (51%), compared with 37% of those hospitalized in urban hospitals (Figure 2).
- No significant difference was observed in the percentage of hospitalized rural residents under age 45 who were in rural hospitals compared with urban hospitals.
- Twenty-four percent of rural residents hospitalized in rural hospitals were aged 45–64 compared with 32% of those hospitalized in urban hospitals.
Figure 2. Age distribution of hospitalized rural residents, by hospital location: United States, 2010
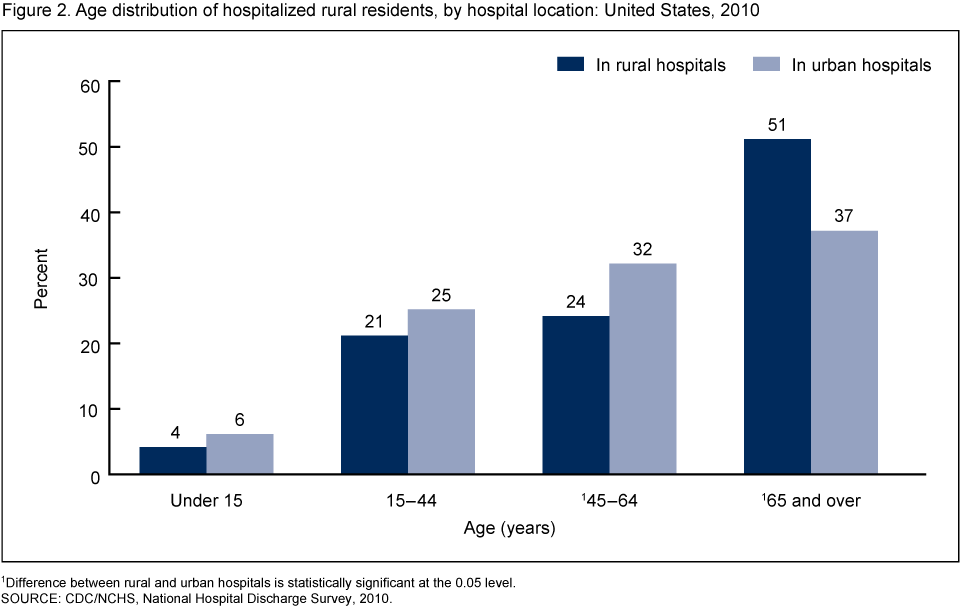
1Difference between rural and urban hospitals is statistically significant at the 0.05 level.
SOURCE: CDC/NCHS, National Hospital Discharge Survey, 2010.
The expected payment source for hospitalized rural residents differed depending on whether they were hospitalized in rural or urban hospitals.
- Reflecting the larger percentage of hospitalized rural residents aged 65 and over in rural hospitals (Figure 2), more than one-half of these patients had Medicare as their principal expected source of payment (53%), compared with 44% of those who were hospitalized in urban hospitals (Figure 3).
- Whether they were in rural or urban hospitals, similar proportions of hospitalized rural residents had Medicaid or private insurance as their principal expected payment source.
Figure 3. Percent distribution of expected source of payment for hospitalized rural residents, by hospital location: United States, 2010
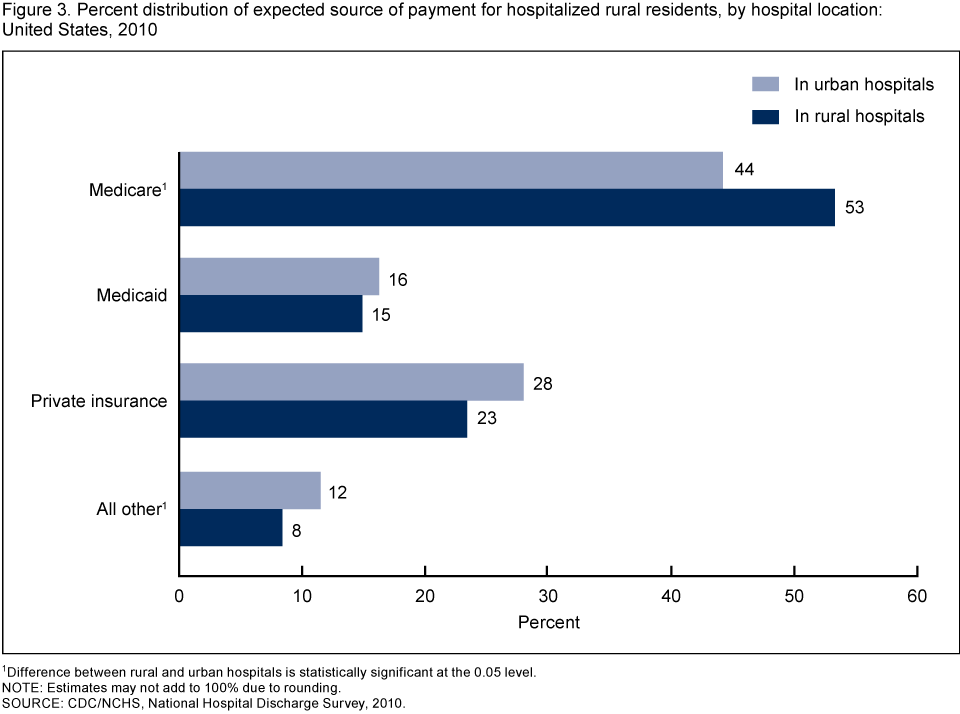
1Difference between rural and urban hospitals is statistically significant at the 0.05 level.
NOTE: Estimates may not add to 100% due to rounding.
SOURCE: CDC/NCHS, National Hospital Discharge Survey, 2010.
Rural residents hospitalized in urban hospitals were more likely to have at least one surgical or nonsurgical procedure than those hospitalized in rural hospitals.
- Seventy-four percent of hospitalized rural residents who were in urban hospitals received a surgical or nonsurgical procedure during their hospitalization, compared with only 38% of those hospitalized in rural hospitals (Figure 4).
- Rural residents hospitalized in urban hospitals were more than three times as likely to have three or more procedures as rural residents hospitalized in rural hospitals.
Figure 4. Number of procedures received by hospitalized rural residents, by hospital location: United States, 2010
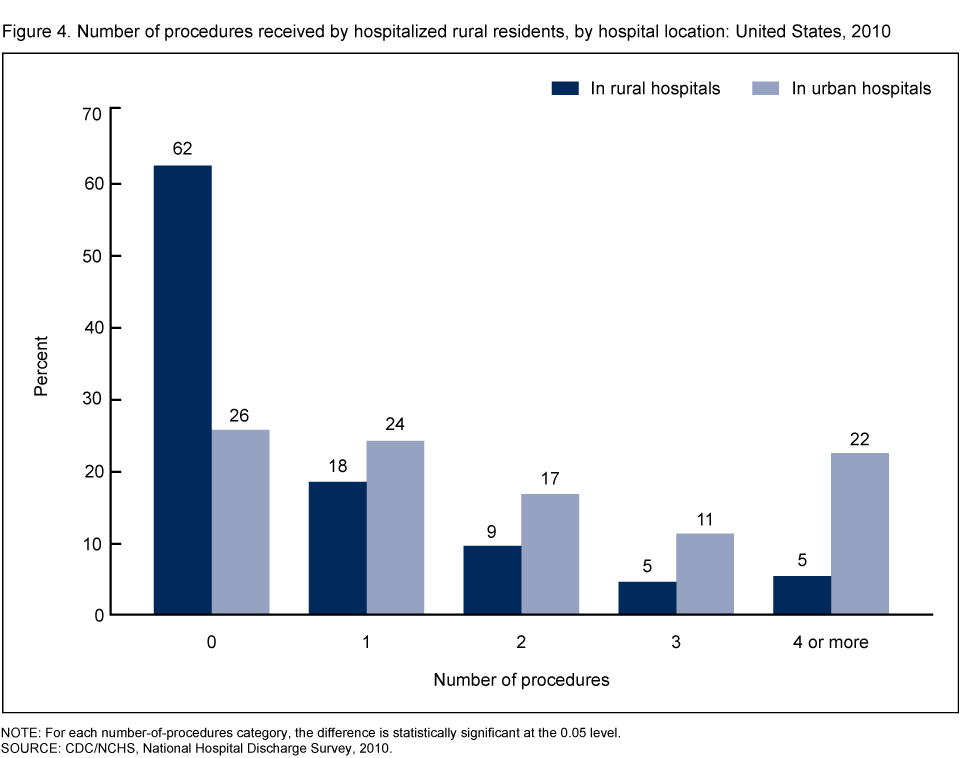
NOTE: For each number-of-procedures category, the difference is statistically significant at the 0.05 level.
SOURCE: CDC/NCHS, National Hospital Discharge Survey, 2010.
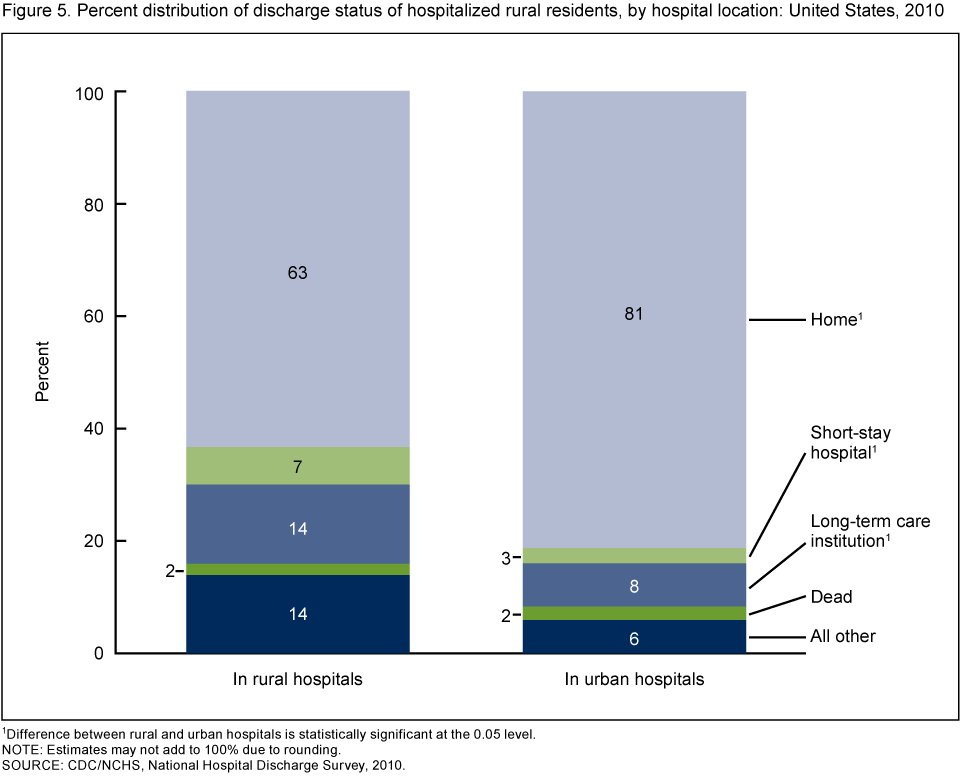
The discharge status of hospitalized rural residents differed depending on whether they were hospitalized in a rural or an urban hospital.
- Rural residents hospitalized in rural hospitals were less likely to be discharged home (63%) compared with those hospitalized in urban hospitals (81%) (Figure 5).
- Rural residents hospitalized in rural hospitals were twice as likely (7%) as those hospitalized in urban hospitals (3%) to be discharged to another short-stay hospital.
- A significantly higher proportion of rural residents who were hospitalized in rural (14%) rather than urban (8%) hospitals were discharged to a long-term care institution.
- Regardless of where rural residents were hospitalized, 2% of them died during their hospitalization.
Figure 5. Percent distribution of discharge status of hospitalized rural residents, by hospital location: United States, 2010
1Difference between rural and urban hospitals is statistically significant at the 0.05 level.
NOTE: Estimates may not add to 100% due to rounding.
SOURCE: CDC/NCHS, National Hospital Discharge Survey, 2010.
Summary
A majority of the 6.1 million hospitalizations of rural residents (60%) occurred in rural hospitals in 2010. Rural residents hospitalized in rural hospitals were more likely to be aged 65 and over and on Medicare. Prior research has shown that patients in this age group were less likely to leave rural areas for their hospitalization due, in part, to the barriers imposed by traveling to urban areas, and to their preference for remaining closer to home (7-9). The larger percentage of patients in the age group 65 and over could help explain why rural residents hospitalized in rural hospitals were more likely to be discharged to long-term care institutions following their hospitalization.
Rural residents hospitalized in urban hospitals were more likely to have surgical or nonsurgical procedures during their hospitalization. Due to economies of scale, many rural hospitals do not offer sophisticated diagnostic tests or specialized treatment, including surgery, and consequently, patients in the areas served by these hospitals are often referred to urban hospitals (8,9). The lack of these services in rural areas could explain why rural residents hospitalized in rural hospitals were more likely to be discharged to another short-stay hospital following their hospitalization. Any changes in the proportion of rural residents seeking care in rural and urban hospitals, and the factors influencing hospital choice, merit continued study.
Definitions
Urban and rural residents and hospitals: Using ZIP codes from National Hospital Discharge Survey internal files, Federal Information Processing Standards, or FIPS, county codes were determined for patients and hospitals. Counties were classified by the Office of Management and Budget (OMB) according to their metropolitan status using standards originally applied to U.S. Census 2000 data and then updated in 2005 (10,11). Counties identified by OMB as metropolitan were considered to be urban, and all other counties (nonmetropolitan) were considered to be rural. Metropolitan counties include large central cities, the fringes of large cities (suburbs), medium cities, and small cities. Nonmetropolitan counties include micropolitan statistical areas and noncore areas, and some combination of open countryside, rural towns (with populations less than 2,500), and areas with populations of 2,500–49,999 that are not part of larger labor-market areas (metropolitan areas) (12).
A number of other ways of defining rural and urban areas are used, but according to the U.S. Department of Agriculture Economic Research Service (12), the above method is used to determine eligibility for a range of public programs and by researchers and others who analyze conditions in rural America. While the urban and rural categories reported here are very broad using this definition, analysis of more refined categories would not be supported by the sample size in this national survey. Research by analysts of the Centers for Disease Control and Prevention’s (CDC) National Center for Health Statistics (NCHS) has confirmed that these categories are meaningful for analyzing health data (13).
Insurance coverage: Patients were considered covered by Medicare, Medicaid, or private insurance based on the principal expected source of payment noted in their medical record.
Data source and methods
Data are from the National Hospital Discharge Survey (NHDS), conducted annually from 1965 through 2010 by CDC/NCHS, Division of Health Care Statistics. NHDS is a national probability sample survey of discharges from nonfederal, noninstitutional short-stay hospitals and general hospitals in the United States. Survey data on hospital discharges were obtained from hospitals’ administrative data. Note that persons having multiple hospitalizations during the survey year may be counted more than once in NHDS.
Because of the complex multistage design of NHDS, the survey data must be inflated or weighted to produce national estimates. Estimates of inpatient care presented in this report exclude newborns. More details about the design of NHDS have been published elsewhere (14).
Differences among subgroups were evaluated using unrounded numbers with two-tailed t tests, using a p value of 0.05 as the level of significance. Percentages were computed using unrounded numbers, so the results may differ from what would be obtained using the rounded numbers in the text and figures.
Data analyses were performed using the statistical packages SAS version 9.3 (SAS Institute, Cary, N.C.), and SUDAAN version 11.0 (RTI International, Research Triangle Park, N.C.).
About the authors
Margaret Jean Hall and Maria F. Owings are with CDC/NCHS, Division of Health Care Statistics.
References
- Health Resources and Services Administration, Department of Health and Human Services. Area Resource File (ARF). 2012.
- Moscovice I, Stensland J. Rural hospitals: Trends, challenges, and a future research and policy analysis agenda. J Rural Health 18(Suppl):197–210. 2002.
- Escarce JJ, Kapur K. Do patients bypass rural hospitals? Determinants of inpatient hospital choice in rural California. J Health Care Poor Underserved 20(3):625–44. 2009.
- Medicare Payment Advisory Commission. Report to the Congress: Medicare and the health care delivery system. Ch 5: Serving rural Medicare beneficiaries [PDF – 706KB]. Washington, DC. June 2012.
- Rosko M, Mutter RL. Inefficiency differences between critical access hospitals and prospectively paid rural hospitals. J Health Polit Policy Law 35(1):95–126. 2010.
- Liu JJ, Bellamy GR, McCormick M. Patient bypass behavior and critical access hospitals: Implications for patient retention. J Rural Health 23(1):17–24. 2007.
- Hall MJ, Marsteller J, Owings M. Factors influencing rural residents’ utilization of urban hospitals [PDF – 191KB]. National health statistics reports; no 31. Hyattsville, MD: National Center for Health Statistics. 2010.
- Tai Wan-Tzu C, Porell FW, Adams EK. Hospital choice of rural Medicare beneficiaries: Patient, hospital attributes, and the patient–physician relationship. Health Serv Res 39(6 Pt 1):1903–22. 2004.
- Radcliff TA, Brasure M, Moscovice IS, Stensland JT. Understanding rural hospital bypass behavior. J Rural Health 19(3):252–9. 2003.
- Office of Management and Budget. Standards for defining metropolitan and micropolitan statistical areas; notice [PDF – 246.7KB]. Fed Regist 65(249): 82227–38. December 27, 2000.
- Office of Management and Budget. Update of statistical area definitions and guidance on their uses [PDF – 976.91KB]. OMB bulletin no 06–01. Washington, DC. 2005.
- Economic Research Service, U.S. Department of Agriculture. Rural classifications: Overview. Updated May 10, 2013.
- Ingram DD, Franco SJ. NCHS urban–rural classification scheme for counties [PDF – 1.25MB]. National Center for Health Statistics. Vital Health Stat 2(154). 2012.
- Hall MJ, DeFrances CJ, Williams SN, et al. National Hospital Discharge Survey: 2007 summary [PDF – 403KB]. National health statistics reports; no 29. Hyattsville, MD: National Center for Health Statistics. 2010.
Suggested citation
Hall MJ, Owing MF. Rural residents who are hospitalized in rural and urban hospitals: United States, 2010. NCHS data brief, no 159. Hyattsville, MD: National Center for Health Statistics. 2014.
Copyright information
All material appearing in this report is in the public domain and may be reproduced or copied without permission; citation as to source, however, is appreciated.
National Center for Health Statistics
Charles J. Rothwell, M.S., M.B.A., Director
Jennifer H. Madans, Ph.D., Associate Director for Science
Division of Health Care Statistics
Clarice Brown., M.S., Director