Recent Declines in Infant Mortality in the United States, 2005–2011
- Key findings
- U.S. infant, neonatal, and postneonatal mortality rates declined from 2005 through 2011
- From 2005 through 2011, the U.S. infant mortality rate declined most rapidly for non-Hispanic black women.
- The infant mortality rate declined for four of the five leading causes of infant death from 2005 through 2011.
- From 2005 through 2010, infant mortality declined most rapidly for selected Southern states.
- In 2010, the U.S. infant mortality rate was highest among selected states in the South and Midwest regions.
- Summary
- Definitions
- Data source and methods
- About the authors
- References
- Suggested citation
Number 120, April 2013
PDF Versionpdf icon (770 KB)
Marian F. MacDorman, Ph.D.; Donna L. Hoyert, Ph.D.; and T.J. Mathews, M.S.
Key findings
- Following a plateau from 2000 through 2005, the U.S. infant mortality rate declined 12% from 2005 through 2011. Declines for neonatal and postneonatal mortality were similar.
- From 2005 through 2011, infant mortality declined 16% for non-Hispanic black women and 12% for non-Hispanic white women.
- Infant mortality declined for four of the five leading causes of death during the 2005–2011 period.
- Infant mortality rates declined most rapidly among some, but not all, Southern states from 2005 through 2010. Despite these declines, states in the South still had among the highest rates in 2010. Rates were also high in 2010 in some states in the Midwest.
Infant mortality is an important indicator of the health of a nation (1,2). This report describes the recent decline in the U.S. infant mortality rate from 2005 through 2011. Changes in infant mortality rates over time are examined by age at death, maternal race and ethnicity, cause of death, and state. The linked birth/infant death data set (linked file) is generally the preferred source for infant mortality rates by race and ethnicity (3,4). This is particularly important for racial and ethnic groups other than non-Hispanic white, non-Hispanic black, and Hispanic. For these three groups, rates calculated from the mortality and linked files have been very similar for many years, and trends are unlikely to differ (3–5). Thus, data from the mortality file are used for this analysis because of their greater timeliness (3,6). Data for 2011 are preliminary (6). Because preliminary data are not available by state, data for the 2005–2010 period were used for the geographic analysis.
Keywords: infant death, trends, geographic differences, National Vital Statistics System
U.S. infant, neonatal, and postneonatal mortality rates declined from 2005 through 2011.
Figure 1. Infant, neonatal, and postneonatal mortality rates: United States, 2000 and 2005–2011
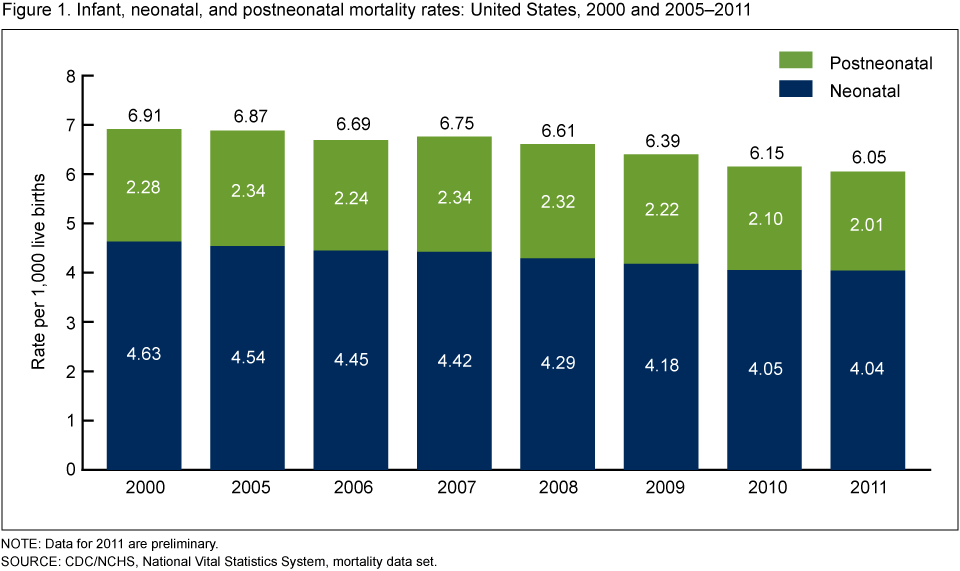
NOTE: Data for 2011 are preliminary.
SOURCE: CDC/NCHS, National Vital Statistics System, mortality data set.
After significant declines throughout the 20th century, the U.S. infant mortality rate plateaued from 2000 through 2005 (7). In 2005, the infant mortality rate was 6.87 infant deaths per 1,000 live births, not significantly different from the rate of 6.91 in 2000 (Figure 1).
Subsequently, the U.S. infant mortality rate declined significantly from 2005 to 2006, did not change significantly from 2006 to 2007, and then declined significantly each year from 2007 through 2010.
In 2011, the U.S. infant mortality rate was 6.05 infant deaths per 1,000 live births (based on preliminary data), 12% lower than the rate of 6.87 in 2005, but not significantly lower than 6.15 in 2010.
From 2005 through 2011, the neonatal mortality rate (deaths under age 28 days per 1,000 live births) declined 11%, and the postneonatal mortality rate (deaths at ages 28 days to under 1 year per 1,000 live births) declined 14%.
From 2005 through 2011, the U.S. infant mortality rate declined most rapidly for non-Hispanic black women.
The U.S. infant mortality rate declined 12% for both the total population and non-Hispanic white women from 2005 through 2011 (Figure 2).
The infant mortality rate declined the most for non-Hispanic black women (16%), and the least for Hispanic women (9%).
Historically, infant mortality rates for non-Hispanic black women have been more than twice those for non-Hispanic white women, while rates for Hispanic women have been similar to those for non-Hispanic white women (3).
Figure 2. Percent change in infant mortality rates, by race and ethnicity: United States, 2005–2011

NOTE: Data for 2011 are preliminary.
SOURCE: CDC/NCHS, National Vital Statistics System, mortality data set.
The infant mortality rate declined for four of the five leading causes of infant death from 2005 through 2011.
The leading cause of infant death in 2011 was congenital malformations, followed by short gestation/low birthweight, Sudden infant death syndrome (SIDS), maternal complications, and unintentional injuries (Figure 3). Together, these five leading causes accounted for 56% of all infant deaths in the United States in 2011 (6).
During 2005–2011, the infant mortality rate declined 6% for congenital malformations.
The infant mortality rate declined 9% for short gestation/low birthweight and 7% for maternal complications, both causes that occur primarily among preterm infants (8).
The SIDS rate declined 20% from 2005 through 2011, although this decline may be due in part to changes in the way SIDS is diagnosed and reported (9). The rate for unintentional injuries did not change significantly from 2005 to 2011.
Figure 3. Infant mortality rates for the five leading causes of infant death in 2011: United States, 2005 and 2011

NOTE: Data for 2011 are preliminary. SIDS is Sudden infant death syndrome.
SOURCE: CDC/NCHS, National Vital Statistics System, mortality data set.
From 2005 through 2010, infant mortality declined most rapidly for selected Southern states.
Sixteen states and the District of Columbia had statistically significant declines in their infant mortality rates from 2005 through 2010 (Figure 4).
Four states (Georgia, Louisiana, North Carolina, and South Carolina) and the District of Columbia had a decline of 20% or more in their infant mortality rate from 2005 through 2010. These areas have had persistently high infant mortality rates for many years (1,2).
Several other Midwestern and Southern states with higher-than-average infant mortality rates (1,6) also experienced significant declines: Florida, Illinois, Kansas, Michigan, Mississippi, Missouri, Tennessee, and Texas. States with the largest declines tended to be states with the highest rates.
No states had a statistically significant increase in infant mortality during this period.
Figure 4. Decline in infant mortality rates, by state: United States, 2005–2010

NOTE: Access data table for Figure 4 pdf icon[PDF – 165 KB].
SOURCE: CDC/NCHS, National Vital Statistics System, mortality data set.
In 2010, the U.S. infant mortality rate was highest among selected states in the South and Midwest regions.
In 2010, 13 states and the District of Columbia had infant mortality rates of 7.00–7.99, and two additional states (Mississippi and Alabama) had infant mortality rates of 8.00 or higher. In contrast, 12 states had infant mortality rates below 5.00 (Figure 5).
Although infant mortality rates declined most rapidly among selected Southern states, selected states in the South and Midwest regions still had the highest infant mortality rates in 2010. Pennsylvania and Rhode Island also had high infant mortality rates (7.00 or above) in 2010.
Differences by state reflect, in part, differences in the population composition of states by race and ethnicity.
Figure 5. Infant mortality rates, by state: United States, 2010

NOTE: Access data table for Figure 5 pdf icon[PDF – 165 KB].
SOURCE: CDC/NCHS, National Vital Statistics System, mortality data set.
Summary
After a plateau from 2000 through 2005, the U.S. infant mortality rate declined by 12% to a rate of 6.05 in 2011. Provisional infant mortality counts for the first half of 2012 suggest a continued downward trend (10). Infant mortality declined from 2005 through 2011 for all major racial and ethnic groups, with the most rapid decline among non-Hispanic black women. Among leading causes of death, infant mortality declined for four of the five leading causes. Infant mortality rates declined most rapidly from 2005 through 2010 for selected Southern states; still, rates in 2010 remained higher in the South and Midwest than in other regions.
In 2008, the United States ranked 27th in infant mortality rate among Organization for Economic Cooperation and Development countries (11), and a previous report linked the United States’ relatively unfavorable infant mortality ranking to its higher percentage of preterm births (12). Despite the recent infant mortality decline, comparing the 2011 U.S. infant mortality rate with the 2008 international rankings would still have the United States ranked 27th.
Definitions
Infant death: Death of an infant before his or her first birthday.
Infant mortality rate: Number of infant deaths per 1,000 live births.
Neonatal mortality rate: Number of deaths before age 28 days per 1,000 live births.
Postneonatal mortality rate: Number of deaths from age 28 days to under 1 year per 1,000 live births.
Preterm birth: Birth before 37 completed weeks of gestation.
Data source and methods
Data presented in this report were based on information from death certificates filed in state vital statistics offices, and subsequently compiled into national data by the National Center for Health Statistics. Data for 2011 are preliminary (6). Causes of death are classified according to the 10th revision of the International Statistical Classification of Diseases and Related Health Problems (13). Causes of death are sorted into rank order according to the number of deaths, beginning with the largest number; see the Technical Notes section of National Vital Statistics Reports on annual final deaths data for more detail (5). Text statements were tested for statistical significance using methods described elsewhere (3), and a statement that a given infant mortality rate is higher or lower than another rate indicates that differences in the rates are statistically significant.
About the authors
Marian F. MacDorman, Donna L. Hoyert, and T.J. Mathews are with the Centers for Disease Control and Prevention’s National Center for Health Statistics, Division of Vital Statistics.
References
- Singh GK, van Dyck PC. Infant mortality in the United States, 1935–2007: Over seven decades of progress and disparities. Rockville, MD: U.S. Department of Health and Human Services, Health Resources and Services Administration, Maternal and Child Health Bureau. 2010.
- Association of Maternal & Child Health Programs. Celebrating the legacy, shaping the future: 75 years of state and federal partnership to improve maternal and child health. Washington, DC. 2010.
- Mathews TJ, MacDorman MF. Infant mortality statistics from the 2009 period linked birth/infant death data set. National vital statistics reports; vol 61 no 8. Hyattsville, MD: National Center for Health Statistics. 2013.
- Rosenberg HM, Maurer JD, Sorlie PD, et al. Quality of death rates by race and Hispanic origin: A summary of current research, 1999. National Center for Health Statistics. Vital Health Stat 2(128). 1999.
- Kochanek KD, Xu JQ, Murphy SL, et al. Deaths: Final data for 2009. National vital statistics reports; vol 60 no 3. Hyattsville, MD: National Center for Health Statistics. 2011.
- Hoyert DL, Xu JQ. Deaths: Preliminary data for 2011. National vital statistics reports; vol 61 no 6. Hyattsville, MD: National Center for Health Statistics. 2012.
- MacDorman MF, Mathews TJ. Recent trends in infant mortality in the United States. NCHS data brief, no 9. Hyattsville, MD: National Center for Health Statistics. 2008.
- Callaghan WM, MacDorman MF, Rasmussen SA, Qin C, Lackritz EM. The contribution of preterm birth to infant mortality rates in the United States. Pediatrics 118(4):1566–73. 2006.
- Malloy MH, MacDorman M. Changes in the classification of sudden unexpected infant deaths: United States, 1992–2001. Pediatrics 115(5):1247–53. 2005.
- National Center for Health Statistics. Provisional monthly and 12-month ending number of live births, deaths, and infant deaths and rates: United States, January 2011–June 2012 pdf icon[PDF – 20 KB]. Hyattsville, MD: National Center for Health Statistics. 2012.
- National Center for Health Statistics. Health, United States, 2011 with special feature on socioeconomic status and health. Hyattsville, MD. 2012.
- MacDorman MF, Mathews TJ. Behind international rankings of infant mortality: How the United States compares with Europe. NCHS data brief, no 23. Hyattsville, MD: National Center for Health Statistics. 2009.
- World Health Organization. International statistical classification of diseases and related health problems, tenth revision. 2008 ed. Geneva, Switzerland. 2009.
Suggested citation
MacDorman MF, Hoyert DL, Mathews TJ. Recent declines in infant mortality in the United States, 2005–2011. NCHS data brief, no 120. Hyattsville, MD: National Center for Health Statistics. 2013.
Copyright information
All material appearing in this report is in the public domain and may be reproduced or copied without permission; citation as to source, however, is appreciated.
National Center for Health Statistics
Charles J. Rothwell, M.S., Acting Director
Jennifer H. Madans, Ph.D., Associate Director for Science
Division of Vital Statistics
Delton Atkinson, M.P.H., M.P.H., P.M.P., Acting Director