HIV Infection in the United States Household Population Aged 18-49 Years: Results from 1999-2006
- Highlights
- Importance
- Findings
- What is the prevalence of HIV infection among U.S. adults?
- Is Herpes simplex-virus type 2 (HSV-2) infection associated with HIV infection?
- How does the immune function of HIV-positive individuals compare with HIV-negative individuals?
- Summary
- Definitions
- Data source
- Acknowledgments
- Suggested citation
- References
- Appendix
NCHS Data Brief No. 4, January 2008
PDF Versionpdf icon (629 KB)
by Geraldine McQuillan, Ph.D., and Deanna Kruszon-Moran, M.S., Division of Health and Nutrition Examination Surveys
Highlights
Data from the National Health and Nutrition Examination Surveys (NHANES)
- The prevalence of HIV infection among adults aged 18-49 years residing in households in the United States was 0.47% for the period 1999-2006.
- Men were more likely to be HIV positive than women. Race/ethnic disparities in HIV infection were also seen. Non-Hispanic blacks were more likely to be HIV positive than all other race/ethnic groups.
- Infection with HSV-2 was significantly associated with HIV infection among the total population aged 18-49 years and especially so among the non-Hispanic black population.
- In 1999-2006, nearly one-quarter of HIV-positive individuals but only 1% of the HIV-negative individuals aged 18-49 years had low CD4 counts (a marker of decreased immune function). Approximately one-third of HIV-positive persons had healthy immune systems as compared with 90% among those HIV negative.
Importance
Measurement of HIV prevalence in a nationally representative sample of the United States population provides an understanding of the background level of infection in the general household population aged 18-49 years as well as in demographic subgroups. This information can also be used to monitor trends in infection in the household population over time. Other public health surveillance systems address the impact of HIV infection among high risk groups including the homeless and prisoners that are not included in surveys of the general household population (1,2). The combination of information from these surveillance systems with estimates from surveys of the general household population provides a more complete picture of the HIV/AIDS epidemic in the United States.
Herpes simplex-virus type 2 (HSV-2) infection is associated with HIV infection; some studies have shown that HSV-2 infection doubles the risk of HIV acquisition (3-5). Estimates of the prevalence of both HSV-2 and HIV infection can provide further understanding of the risk of HIV infection in higher risk subgroups of the general household population.
CD4 counts (also known as T-helper cells) provide a measure of a person’s immune function. Among HIV-infected individuals, measurement of CD4 counts is often used to demonstrate how well anti-HIV drugs are working. Estimates of this measure in the general population can provide a picture of health among HIV-infected individuals.
Keywords: HIV, CD4, seroprevalence, trends
Findings
What is the prevalence of HIV infection among U.S. adults?
- In 1999-2006, the prevalence of HIV infection among adults aged 18-49 years in the civilian noninstitutionalized household population of the United States was 0.47%.
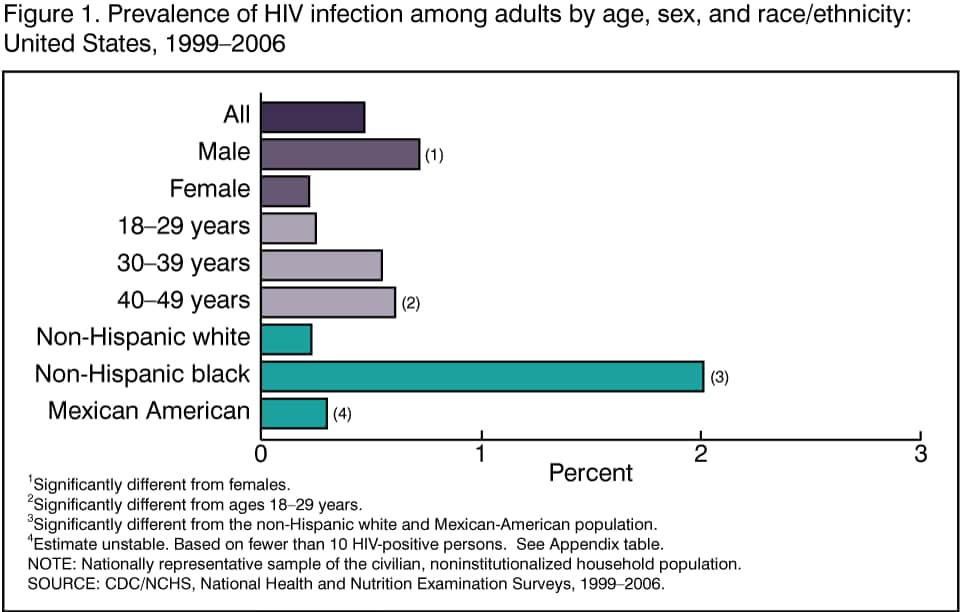 image icon
The prevalence among men was 0.72% and was significantly higher than the prevalence in women 0.22%.
Adults aged 40-49 years were more likely to be HIV positive compared with those aged 18-29 years. Approximately 0.61% of adults aged 40-49 years were HIV positive, compared with 0.55% of 30-39 year-olds and 0.25% of 18-29 year-olds.
- In 1999-2006, the non-Hispanic black population had an increased prevalence of HIV infection compared with other population subgroups.
The prevalence of HIV infection among the non-Hispanic black population was 2.01%, which was significantly higher than among the non-Hispanic white population (0.23%) and the Mexican-American population (0.30%).
Among the non-Hispanic black population, the prevalence of HIV infection was higher among men (2.64%) than among women (1.49%). Is herpes simplex-virus type 2 (HSV-2) infection associated with HIV infection?
Is Herpes simplex-virus type 2 (HSV-2) infection associated with HIV infection?
- HIV status was associated with HSV-2 infection, especially among the non-Hispanic black population.
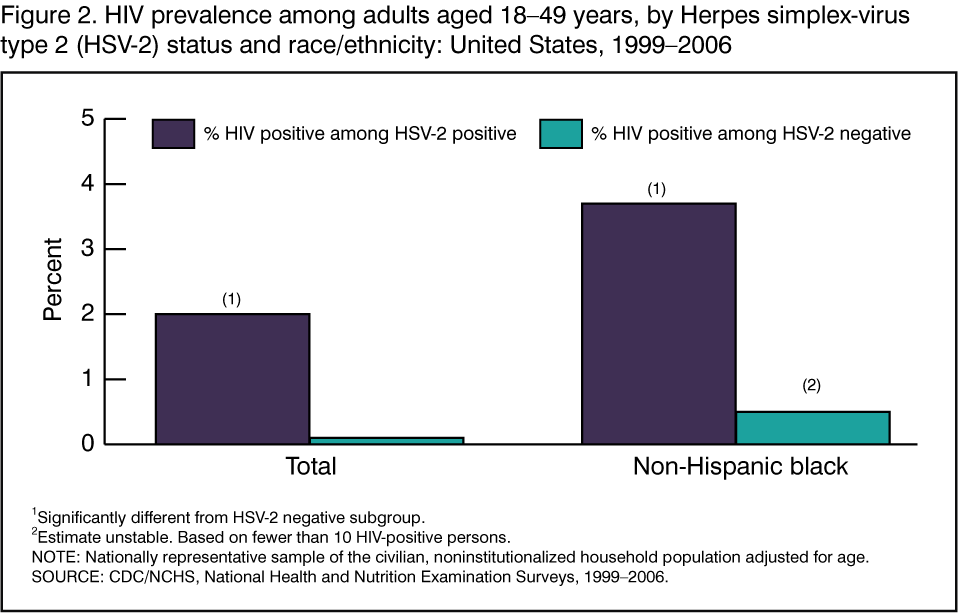 image icon
HSV-2 infection among persons aged 18-49 years was much higher among non-Hispanic blacks (46.6%) as compared with all other race/ethnic groups combined (15.3%) (data not shown).
HIV prevalence was higher among all persons aged 18-49 years who were infected with HSV-2 compared with those who were not infected (1.99% and 0.13%, respectively).
The higher risk of HIV infection among those HSV-2 positive was especially true for non-Hispanic blacks, where the HIV prevalence was 3.69% among HSV-2 positive non-Hispanic blacks.
How does the immune function of HIV-positive individuals compare with HIV-negative individuals?
- The CD4 count (also known as T-helper cells) is a measure of a person’s immune status. The immune function among HIV-infected individuals is often different from HIV-negative individuals.
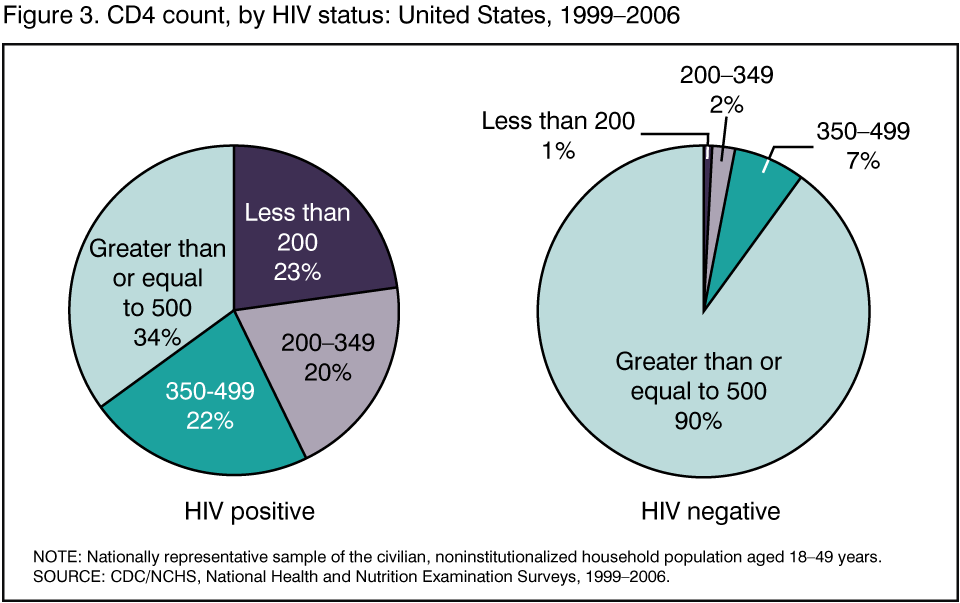 image icon
In 1999-2006, the majority (90%) of HIV-negative individuals had CD4 counts within the normal range (CD4 counts greater than or equal to 500 cells/mm3).
As expected, many more HIV-positive persons had lower CD4 counts (counts less than 200 cells/mm3 or between 200 and 349 cells/mm3) (43% combined) as compared with HIV-negative persons (3% combined).
In 1999-2006, 23% of HIV-positive individuals had depressed immune function (CD4 counts less than 200 cells/mm3) and only 34.4% of HIV-positive individuals had healthy immune systems (CD4 counts greater than or equal to 500 cells/mm3).
Summary
In 1999-2006, the prevalence of HIV infection among U.S. adults aged 18-49 years residing in households was 0.47%. In addition, race/ethnic and gender disparities were present. HIV infection was higher among non-Hispanic blacks compared with other race/ethnic groups and higher among men than women.
HIV infection was significantly associated with HSV-2 infection. The association was especially strong among non-Hispanic blacks where infection with HSV-2 is significantly higher than in all other race/ethnic groups.
Low CD4 counts (less than 200 cells/mm3), a marker for depressed immune function, were much more frequent among those who were HIV positive than those HIV negative. Conversely, higher CD4 counts (greater than or equal to 500 cells/mm3) indicative of normal immune function, were much lower among individuals HIV positive as compared with those HIV negative.
Since the HIV/AIDS epidemic was first recognized in 1981, the Centers for Disease Control and Prevention (CDC), in coordination with all states and U.S. dependent areas has conducted AIDS surveillance. As part of the national surveillance program to monitor the HIV/AIDS epidemic, CDC’s NHANES survey data provide prevalence estimates from the general household population aged 18-49 years. Information on risk factors for HIV infection, such as sexual activity and intravenous drug use, were not addressed in this analysis, but are collected as part of the NHANES survey.
Definitions
HIV positivity: Presence of antibody to human immunodeficiency virus (HIV) in blood or urine (6).
CD4 counts: Enumeration of CD4 T-lymphocytes (also called T-helper cells, a measure of immune function) in blood (7). Counts greater than or equal to 500 cells/mm3 represents a healthy immune system. Counts less than 200 cells/mm3 represent adults with depressed immune function (6).
HSV-2 positivity: Presence of antibody to Herpes simplex virus type-2 (HSV-2) in blood (6,8-10).
Race/ethnicity: Race/ethnicity was based on self-report and categorized as non-Hispanic white, non-Hispanic black, and Mexican American. Persons not fitting into these categories were classified as “other” and included in the total population estimates.
Data source
National Health and Nutrition Examination Surveys (NHANES) data were used for these analyses. NHANES is a cross-sectional survey designed to monitor the health and nutritional status of the civilian, noninstitutionalized U.S. population (11). The survey consists of interviews conducted in participants’ homes, standardized physical examinations conducted in specially outfitted mobile examination centers, and laboratory tests utilizing blood and urine specimens provided by participants during the physical examination.
The NHANES sample is selected through a complex, multistage design that includes selection of primary sampling units (counties), household segments within the counties, and finally sample persons from selected households. The sample design includes oversampling in order to obtain reliable estimates of health and nutritional measures for population subgroups. In 1999-2006, African Americans, Mexican Americans, persons with low income, persons 12-19 years of age, and persons 60 years and older were oversampled. In 1999, NHANES became a continuous survey, fielded on an ongoing basis. Each year of data collection is based on a representative sample covering all ages of the civilian, noninstitutionalized population. Public-use data files are released in 2-year cycles.
Sample weights, which account for the differential probabilities of selection, nonresponse and noncoverage, are incorporated into the estimation process (12). The standard errors of the percentages were estimated using Taylor Series Linearization in SUDAAN, a method that incorporates the sample weights and sample design (13). Ninety-five percent confidence intervals were estimated by using the logit transformation (14).
HIV antibody positive status was measured in examined sample persons aged 18-49 years. To examine possible predictors of HIV positivity, differences in prevalence were evaluated by examining P-values calculated using a univariate t-statistic obtained from a general linear contrast procedure in SUDAAN. All differences reported are statistically significant (p < 0.05) unless otherwise indicated. When comparing race/ethnic groups, using linear contrasts and when examining the association of HSV-2 with HIV status among race/ethnic groups, estimates were age adjusted to the 2000 U.S. standard census population using three age groups, 18-29, 30-39, and 40-49 years. This adjustment enabled us to compare prevalence estimates between subgroups that differ with respect to their age distributions (15).
All data analyses were performed using the statistical packages SAS version 9.1 (SAS Institute, Cary, N.C.) and SUDAAN version 9.0 (Research Triangle Institute, Research Triangle Park, N.C.) (13).
The relative standard error (RSE), defined as the estimate divided by its standard error, is an indicator for statistical reliability. Most estimates in this study are of small magnitude relative to their standard errors (i.e., the RSE are large). All estimates whose RSE was greater than a cut point of 40% are designated with a footnote to indicate that the estimate is statistically unreliable. In addition, estimates based on fewer than 10 positive persons are also designated with a footnote to indicate statistical unreliability (16).
Acknowledgments
The data files for this report were prepared in the Division of Health and Nutrition Examination Surveys, Informatics Branch. This report was edited by Demarius V. Miller, CDC/CCHIS/NCHM/Division of Creative Services, Writer-Editor Services Branch; layout, graphic production, and Internet preparation by Zorica Tomic-Whalen, CDC/CCHIS/NCHM/Division of Creative Services, NOVA contractor; and Internet preparation and Internet posting by Christine Brown, Office of Information Services, Information Design and Publishing Staff. Printing management by Patty Wilson, CDC/MASO.
Suggested citation
McQuillan GM, Kruszon-Moran D. HIV infection in the United States household population aged 18-49 years: Results from 1999-2006. NCHS data brief no 4. Hyattsville, MD: National Center for Health Statistics. 2008.
References
- Allen DM, Lehman JS, Green TA, et al. HIV infection among homeless adults and runaway youth, United States, 1989-1992. AIDS 1994; 81:1593-8.
- Maruschak LM. HIV in Prisons, 2001. Bureau of Justice Statistics, report number NCJ 202293. January 2004.
- McQuillan GM, Kruszon-Moran D, Kottiri BJ, et al. Prevalence of HIV in the U.S. Household Population: The National Health and Nutrition Examination Surveys, 1988-2002. J Acquir Immune Defic Syndr 2006; 41:651-656.
- McQuillan GM, Khare M, Karon JM, et al. Update on the seroepidemiology of human immunodeficiency virus in the United States household population: NHANES III, 1988-1994. J AIDS 1997; 14:355-60.
- Wald A, Link K. Risk of human immunodeficiency virus infection in herpes simples virus type 2 persons: a meta-analysis. J Infect Dis. 2002;185:45-52.
- National Center for Health Statistics. Available from: NHANES Lab Methods 2003-2004.
- Fiebig EW, Johnson DK, Hirschkorn DF, Knape CC, et al. Lymphocyte subset analysis on frozen whole blood. Cytometry 29:340-50. 1997.
- Xu F, Sternberg MR, Kotirri BJ, et al. Trends in Herpes simples virus type 1 and 2 seroprevalence in the United States. JAMA. 2006;296:964-73.
- Lee FK, Coleman RM, Pereira L, Griffin C, Reid E, Nahmias A. Detection of herpes simplex virus type-2-specific antibody with glycoprotein G. J Clin Microbiol 1985; 22:641-44.
- Fleming DT, McQuillan GM, Johnson RE, et al. Herpes simplex virus type 2 in the United States, 1976-1994. N Engl J Med. 1997;337:1105-11.
- National Center for Health Statistics. NHANES 1999-2006. Available from: NHANES Questionnaires, Datasets, and Related Documentation.
- Mohadjer L, Montaquila J, Waksberg J. National Health and Nurtition Examination Survey III: Weighting and examination methodology. Prepared for National Center for Health Statistics, Hyattsville, MD. Westat Inc, February 1996.
- Shah BV, Barnwell BG, Bieler GS, LaVange LM. SUDAAN Users Manual release7.0. Research Triangle Park, NC: Research Triangle Institute, 1996.
- Wolter K. Introduction to Variance Estimation. New York, New York, Springer-Verlag Inc 1985.
- Kahn HA, Sempos CT. Statistical Methods in Epidemiology. New York, NY: Oxford University Press Inc; 1989.
- National Center for Health Statistics. NHANES 1999-2002. Available from: NHANES Analytic Guidelines pdf icon[PDF – 28 KB].
Appendix
Prevalence of HIV infection from NHANES 1999-2006
| N | Number positive | Percent positive | 95% CI | RSE | |
|---|---|---|---|---|---|
| Total1 | 11928 | 67 | 0.47 | 0.34-0.64 | 15 |
Prevalence of HIV infection from NHANES 1999-2006, by gender
| Gender | N | Number positive | Percent positive | 95% CI | RSE |
|---|---|---|---|---|---|
| Males | 5529 | 47 | 0.72a | 0.49-1.06 | 19 |
| Male, Non-Hispanic black | 1327 | 29 | 2.64b | 1.88-3.70 | 17 |
| Male, All other race/ethnic groups2 | 4202 | 18 | 0.48b | 0.26-0.86 | 29 |
| Females | 6399 | 20 | 0.22a | 0.14-0.36 | 23 |
| Female, Non-Hispanic black | 1478 | 17 | 1.49c | 0.91-2.43 | 24 |
| Female, All other race/ethnic groups2 | 4921 | 3 | 0.03c,3 | 0.01-0.13 | 67 |
Prevalence of HIV infection from NHANES 1999-2006, by age
| Age1 | N | Number positive | Percent positive | 95% CI | RSE |
|---|---|---|---|---|---|
| 18-29 | 5696 | 15 | 0.25d | 0.13-0.48 | 32 |
| 30-39 | 3147 | 23 | 0.55 | 0.32-0.94 | 27 |
| 40-49 | 3085 | 29 | 0.61d | 0.38-0.98 | 23 |
Prevalence of HIV infection from NHANES 1999-2006, by race/ethnicity
| Race/Ethnicity | N | Number positive | Percent positive | 95% CI | RSE |
|---|---|---|---|---|---|
| Non-Hispanic white | 4838 | 10 | 0.23e | 0.11-0.48 | 39 |
| Non-Hispanic black | 2805 | 46 | 2.01e,f | 1.50-2.69 | 14 |
| Mexican American | 3228 | 7 | 0.30f,3 | 0.13-0.69 | 40 |
1 Totals differ from the sum for the non-Hispanic white, non-Hispanic black, and Mexican-American populations because those in the “other” race/ethnic category are included in the totals.
2 Includes non-Hispanic white, Mexican American, and “other'” race/ethnicity.
3 RSE greater than 40 or number of positive cases less than 10.
a p<0.05 for difference between gender.
b p<0.05 for difference between non-Hispanic black males and males in “All other race/ethnic groups.”
c p<0.05 for difference between non-Hispanic black females and females in “All other race/ethnic groups.”
d p<0.05 for difference between ages 18-29 and 40-49 years.
e p<0.05 for difference between the non-Hispanic black and non-Hispanic white populations.
f p<0.05 for difference between the non-Hispanic black and Mexican-American populations.
NOTES: CI is confidence interval. RSE is relative standard error.