Increases in Methadone-Related Deaths: 1999-2004
by Lois A. Fingerhut, Office of Analysis and Epidemiology
An updated report is available: Increases in Poisoning and Methadone-Related Deaths: United States, 1999-2005
Introduction
Poisoning deaths include those resulting from accidental overdoses of a drug, being given the wrong drug, taking the wrong drug in error, or taking a drug inadvertently. Poisoning also includes deaths that are unintentional, intentional, or of undetermined intent from ingestion of other solid or liquid substances, or exposure to or inhalation of gases or vapors (1). Such deaths can be defined either by their International Classification of Diseases and Related Health Problems (ICD)-10th revision external cause of injury codes or by their ICD-10 diagnosis codes. The external cause codes have two dimensions that indicate: 1) the broad categories of substances involved such as drugs, alcohol, or other solid or liquid biological substances, gases or vapors, or other substances such as pesticides or unspecified chemicals; and 2) the intentionality of the death, reflecting whether the death was certified as unintentional, a suicide, homicide or legal intervention, or of undetermined intent. The ICD-10 external cause codes used to define poisoning as an underlying cause of death include X40-X49, X60-X69, X85-X90, Y10-Y19, Y35.2 or *U01(.6-.7). These are the codes that have been adopted internationally to define poisoning in the external cause of injury matrix for ICD-10.
Poisoning diagnosis codes are used in conjunction with external cause codes to identify the specific substance(s) or agent(s) responsible. A poisoning death can have one or multiple substances listed on the death certificate; the ICD-10 codes range from T36.0-T65.9. While these codes help to describe a poisoning-related underlying cause, they are not used for underlying cause of death coding (2). Rather, the corresponding external cause code will be designated as the underlying cause.
Methadone is classified separately from other opiates and related narcotics in ICD-10, which has been in use in the United States since 1999, but was not classified separately in ICD-9. Vital statistics data from the period 1999-2004, therefore, provide the first opportunity to examine a 6-year trend in methadone-related deaths in this country. The ICD-10 code for methadone is T40.3. This drug is listed within the overall category, ICD-10 T40, for “Poisoning by narcotics and psychodysleptics (hallucinogens).”
Since 1999, between 73 and 79 percent of poisoning deaths mentioning methadone have been classified as unintentional (3,202 such deaths in 2004), with an additional 11-13 percent being of undetermined intent, 5-7 percent as suicides, less than 1 percent as homicides, and about 1 percent were injuries other than poisoning. Over this same period, only 4-6 percent of deaths where methadone was mentioned were not coded as injury deaths (Table 1 [PDF – 26 KB]).
Trends
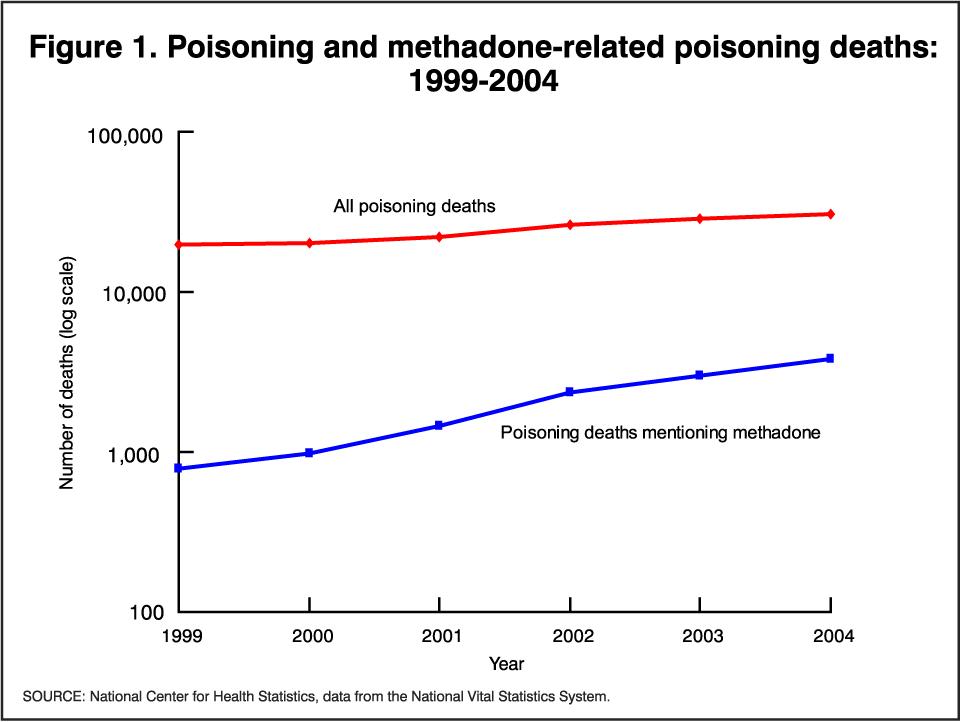
The number of all poisoning deaths increased 54 percent to 30,308 over the 1999-2004 period, while the number of poisoning deaths mentioning methadone increased 390 percent to 3,849 (Figure 1). Poisoning deaths mentioning methadone increased from 4 percent of all poisoning deaths to 13 percent of all poisoning deaths. Most recently, all poisoning deaths increased 6 percent from 2003-04, while those mentioning methadone increased 29 percent.
Of all narcotics (ICD-10 T40.0-T40.9) mentioned in poisoning deaths, methadone had the largest relative increases. The absolute number of poisoning deaths mentioning methadone was less, however, than the number of deaths mentioning cocaine (ICD-10 T40.5) or other opioids (T40.2). Other opioids include pain relief drugs such as oxycodone and hydrocodone among others (Table 2 [PDF – 26 KB]). The relative increase in methadone-related poisoning deaths from 1999 to 2004 was greater than for any individual substance in the T36-T65 range of codes (data available upon request).
Age
Age specific rates of methadone death are higher for persons age 35-44 and 45-54 years than for those younger or older. This pattern has been true for most of the 1999-2004 period (Figure 2). Admittedly, the rates are quite low relative to all poisoning, but the patterns are similar in that the rates are high for those in middle-age groups. Among those age 55-64 years, the rate in 2004 was seven times the rate in 1999; for those in each of the 10-year age groups covering the span 25-54 years, the rates in 2004 were 3-5 times the rates in 1999. The largest increase, however, is noted for young persons 15-24 years; the rate in 2004 was 11 times that in 1999.
Table 3 [PDF – 26 KB] shows data for all deaths for which the underlying cause was unintentional poisoning with a mention of methadone. The number of these deaths increased 414 percent to 3,202 over the 1999-2004 period; that is, the number of deaths in 2004 was five times the number in 1999. State specific comparisons should be interpreted with caution as many of the State-specific data are based on very small numbers. Therefore rather than provide a state-by-state ranking, Table 2 [PDF – 26 KB] subdivides the states into groups based on ratio ranges (ratio of deaths in 2004 to those in 1999) and then orders the states within the groups alphabetically.
Following are examples of 1999-2004 ratios in states with “large” numbers of methadone–related deaths (greater than 50 for at least 3 of the 6 years): West Virginia (25:1), Kentucky (15:1), Florida and Oregon (14:1), North Carolina and Texas (7:1), Virginia (6:1) and Washington (5:1). New York showed no overall change during the 6 years (1:1).
References
- World Health Organization. International Statistical Classification of Diseases and Related Health Problems (Tenth revision), volume 1. Geneva, World Health Organization. 1992.
- Miniño AM, Anderson RN, Fingerhut LA, Boudreault MA, Warner M. Deaths: Injuries, 2002. National vital statistics reports; vol 54 no 10. Hyattsville, Maryland: National Center for Health Statistics. 2006.
Figures
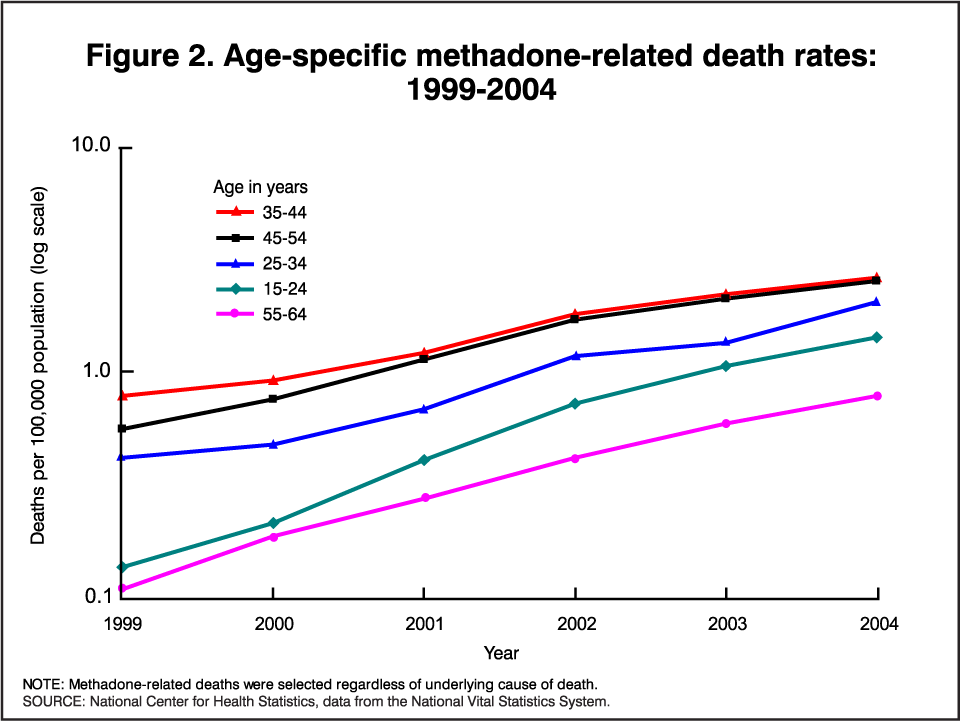
Age-specific rates for 2002 in Figure 2 have been corrected.