STD Multimedia Resources

The high-resolution, public domain visuals below are available for use in your publication. This page will be updated as new media resources become available.
Commonly Requested Multimedia
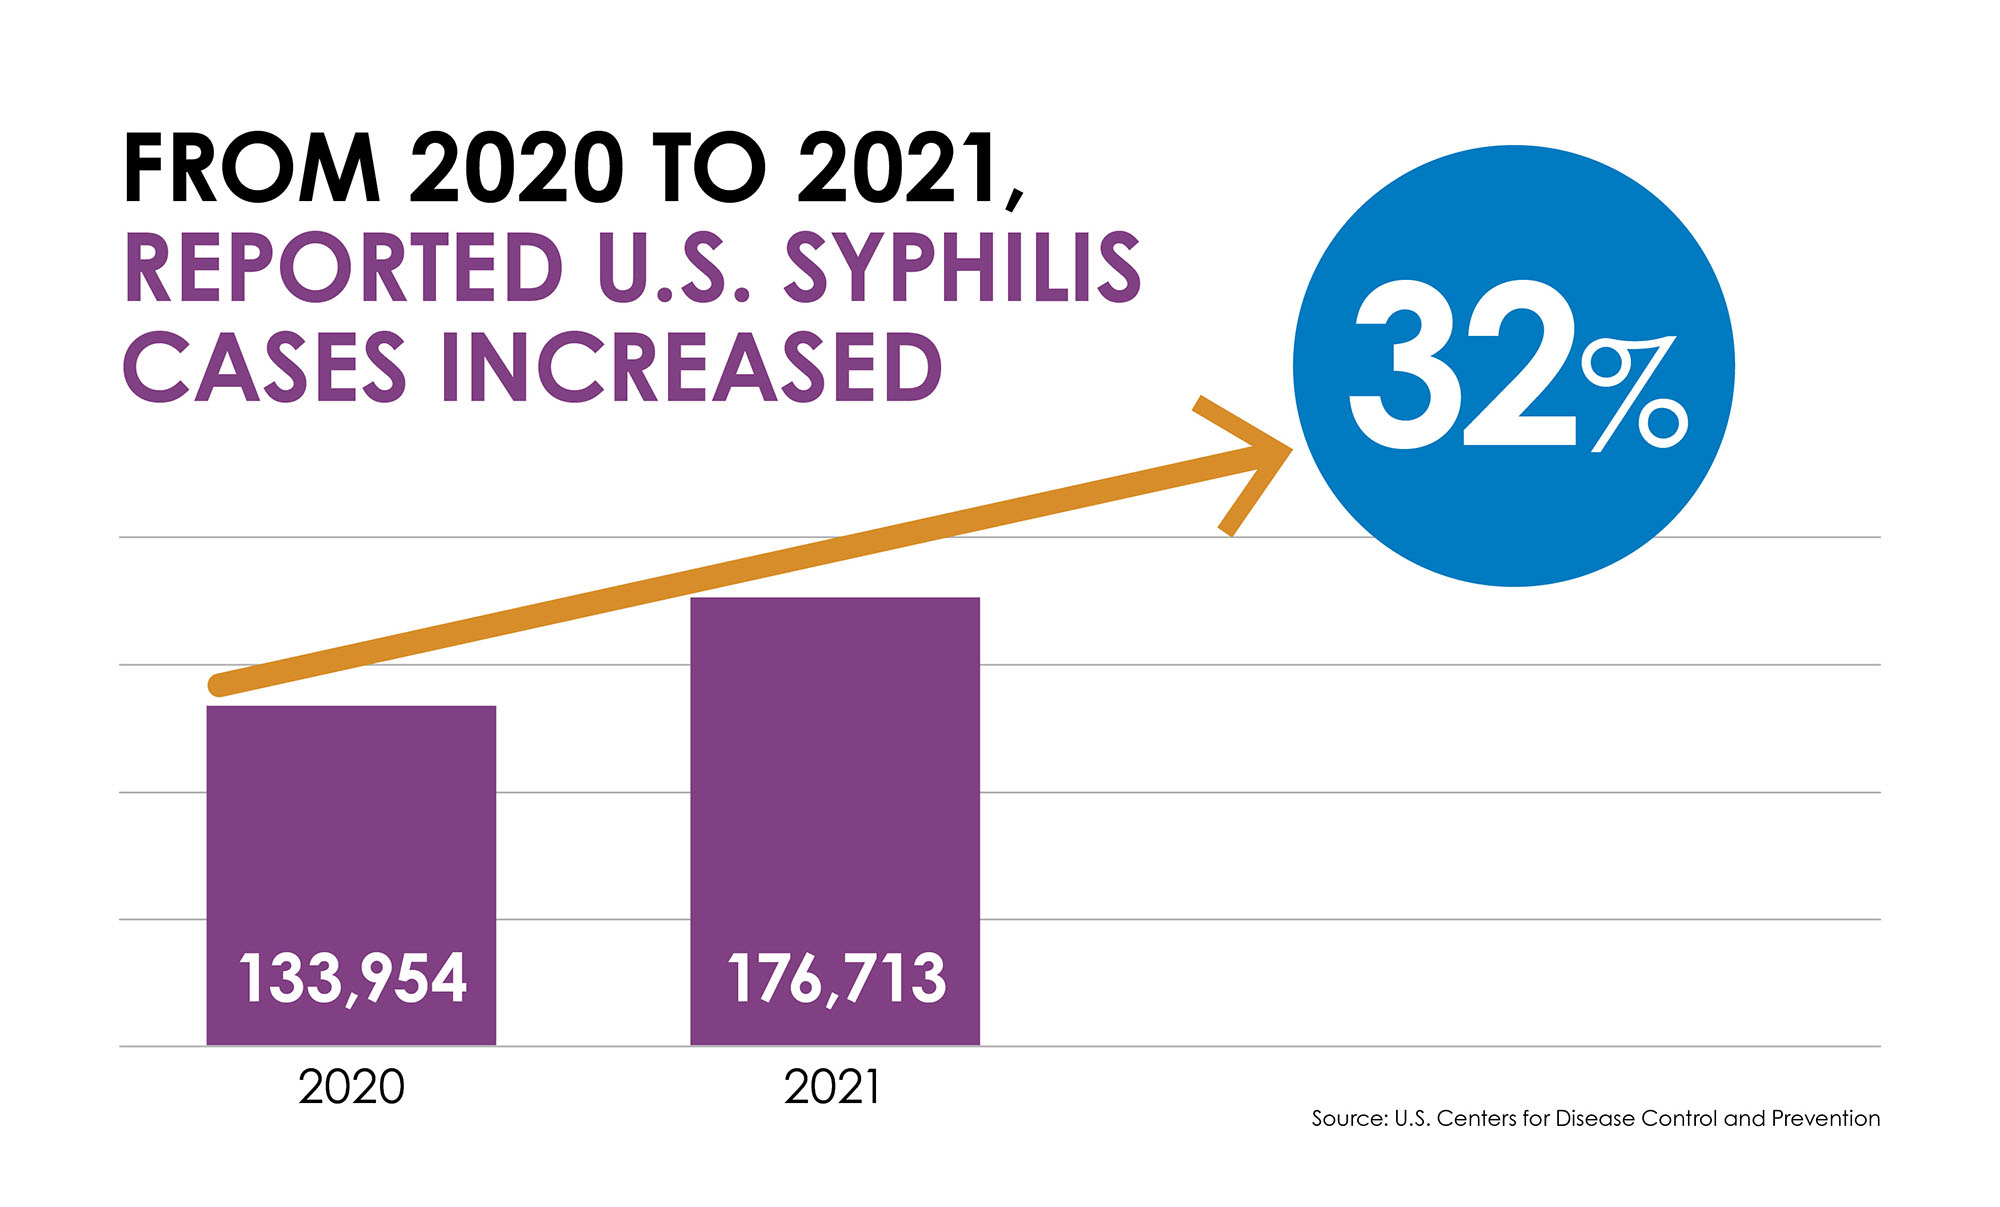
A bar chart showing a 32% increase in reported syphilis between 2020 and 2021, from 133,954 to 176,713

Reported Syphilis Cases in the U.S., 2020-2021

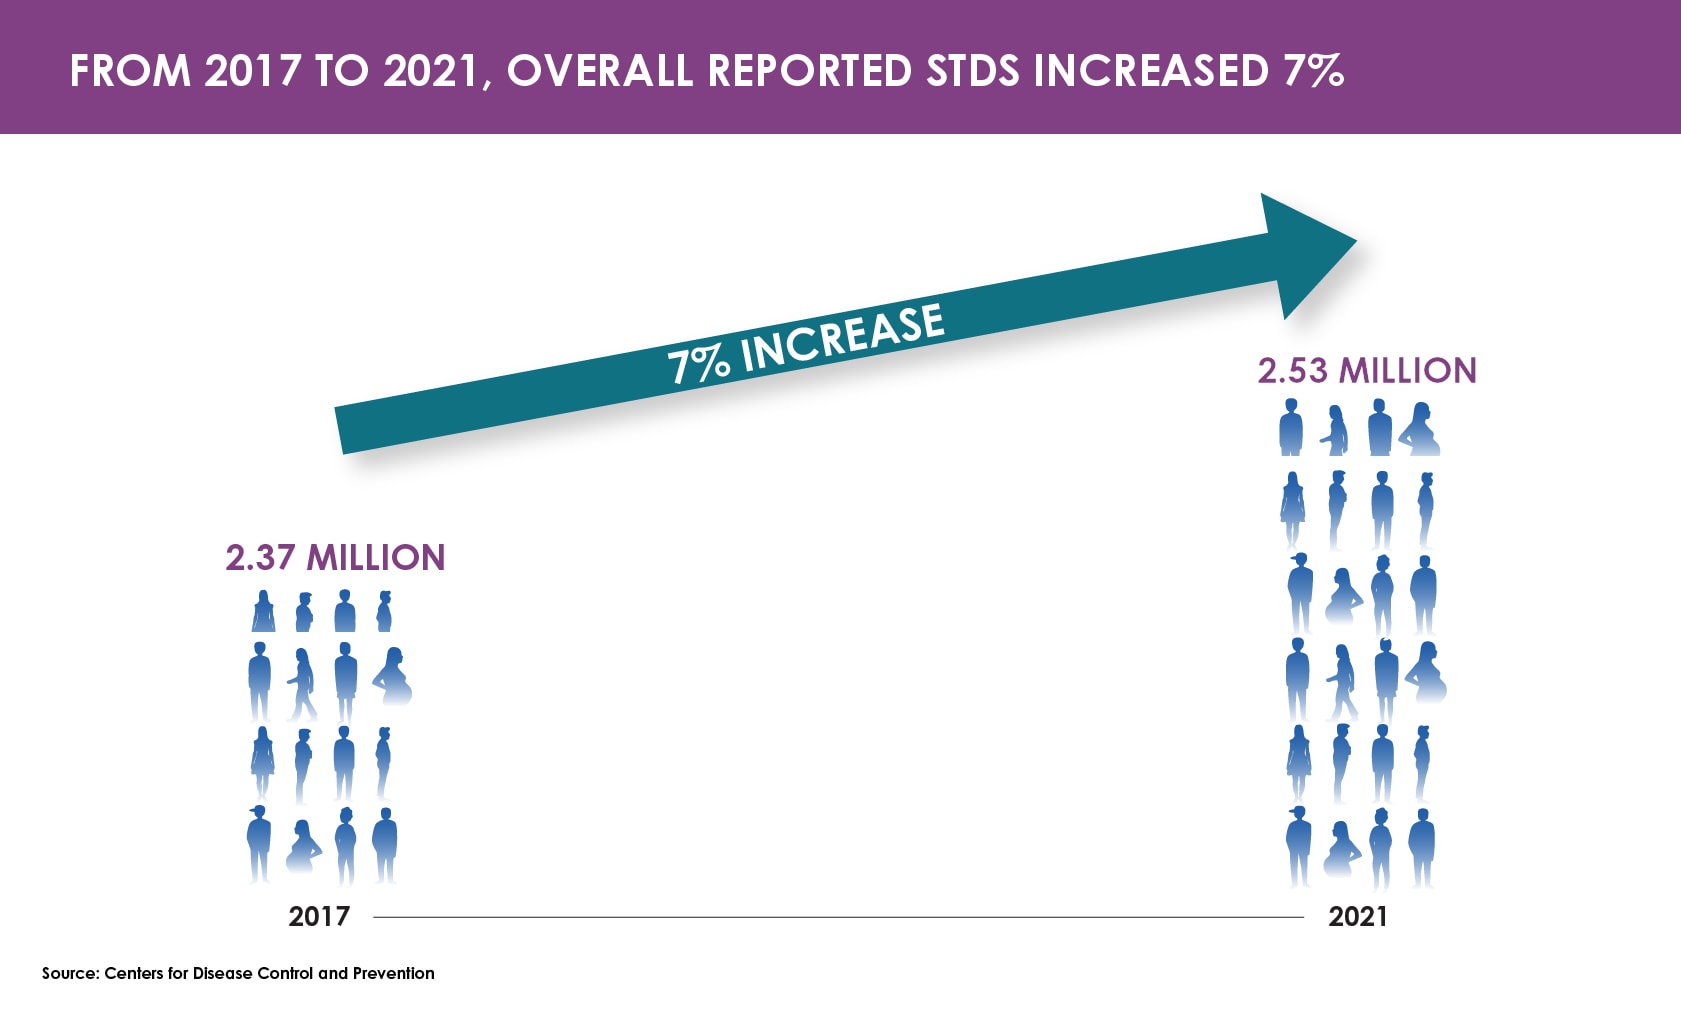
A bar chart showing a 7% increase in reported STDs between 2017 and 2021, from 2.37 million to 2.53 million.

Overall Reported STDs, 2017-2021

The graphic shows there were nearly 68 million infections in 2018 (prevalence), and that 1 in 5 people in the U.S. have an STI.

STIs in 2018 (Prevalence)

Illustration of syphilis bacteria

Illustration of syphilis bacteria

Illustration of Neisseria gonorrhoeae

Illustration of Neisseria gonorrhoeae

Illustration of Chlamydia trachomatis bacteria

Illustration of Chlamydia trachomatis bacteria

Some Groups More Likely to Be Affected by STDs (2021 data)
Young People
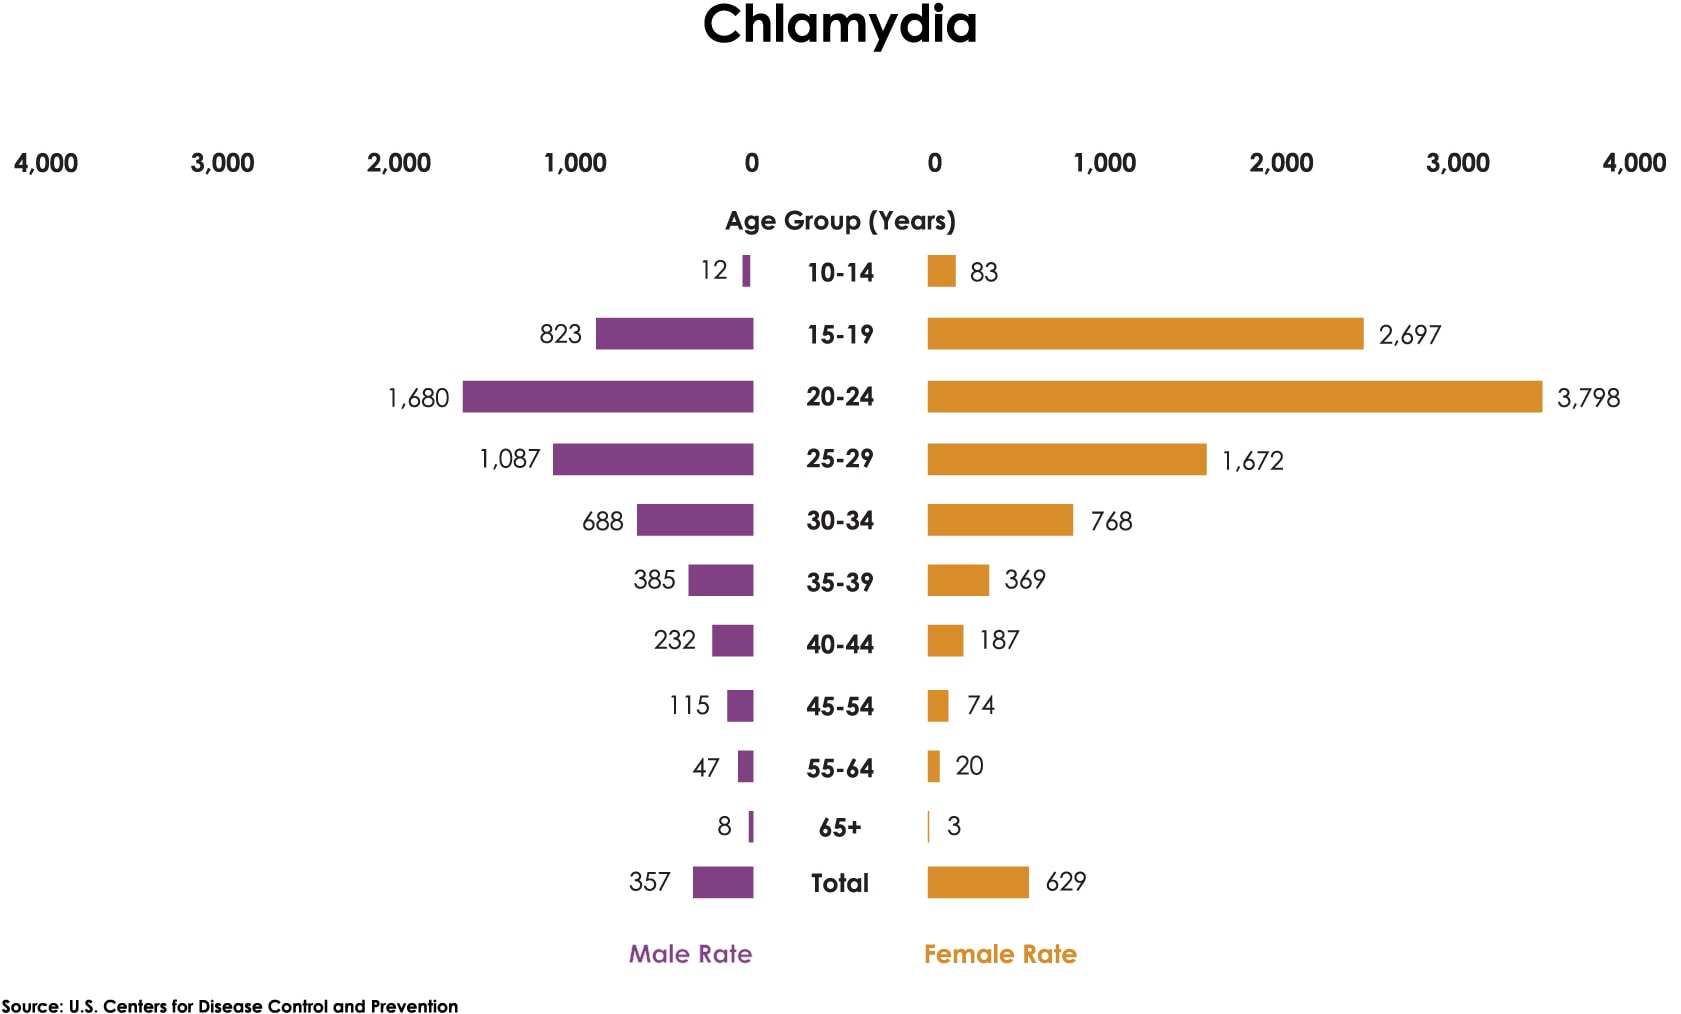
A paired horizontal bar chart showing 2021 rates of chlamydia by age and sex, with the highest rate among females ages 20-24, followed by females ages 15-19.[JPG - 168 KB]

Chlamydia

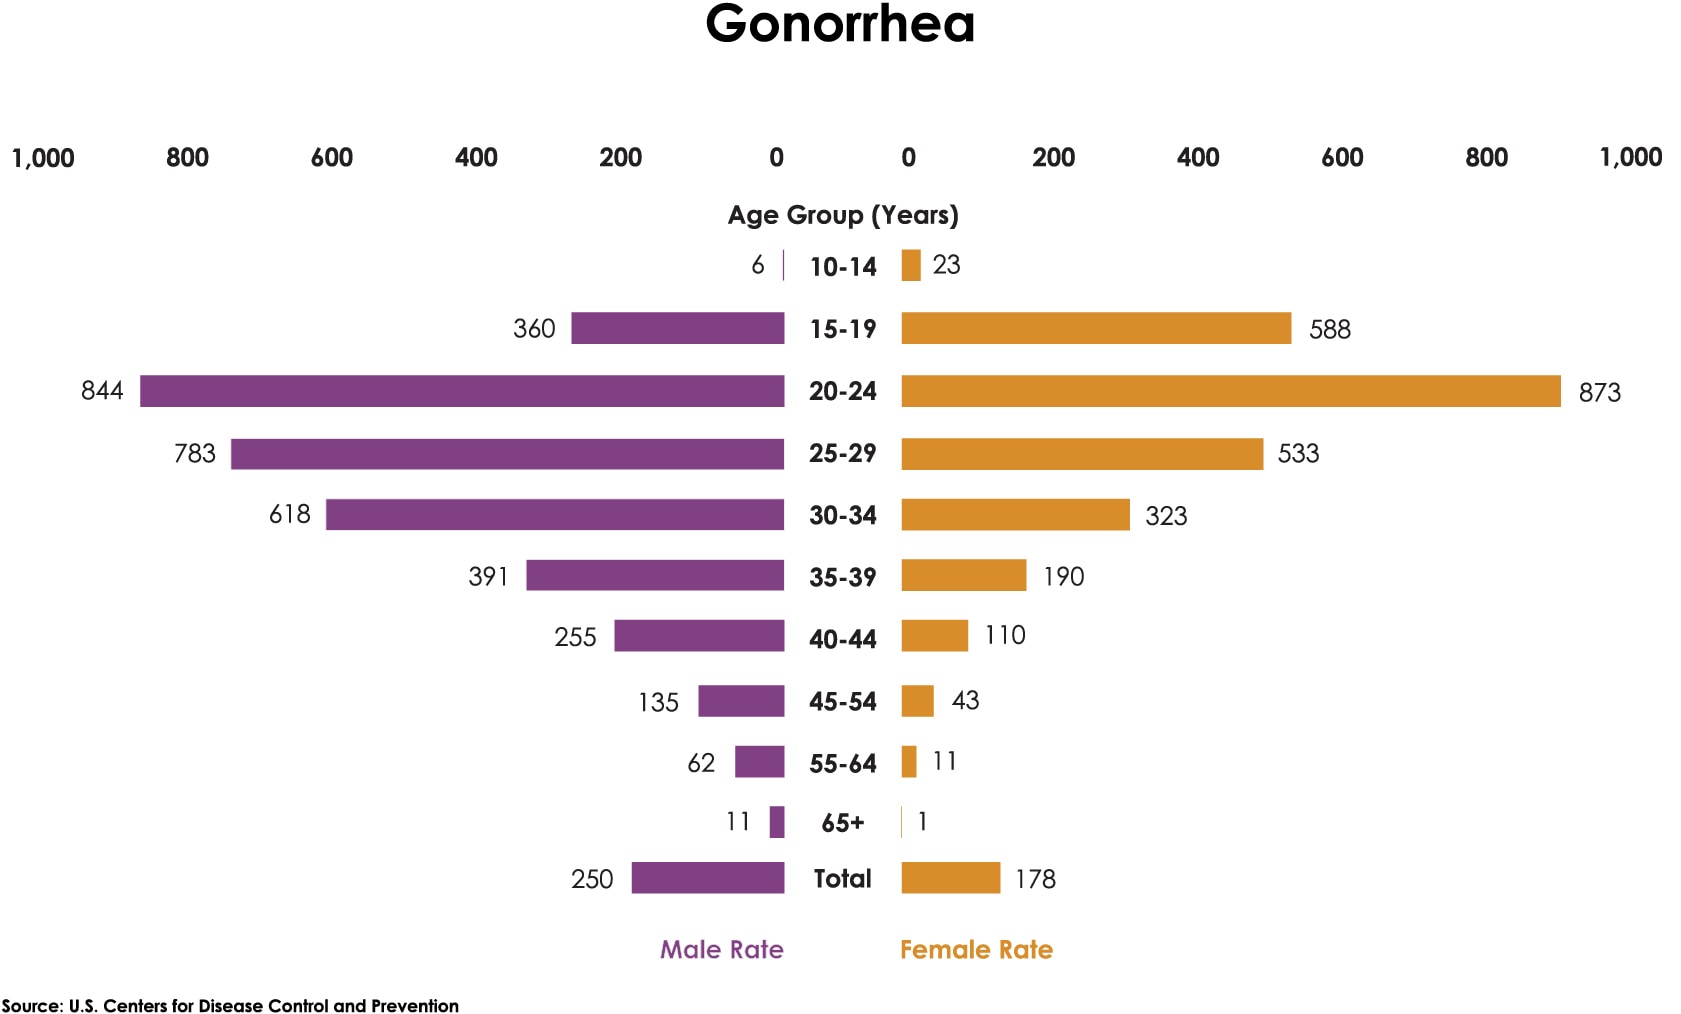
A paired horizontal bar chart showing 2021 rates of gonorrhea by age and sex, with the highest rate among females ages 20-24, followed by males of the same age.[JPG - 176 KB]

Gonorrhea

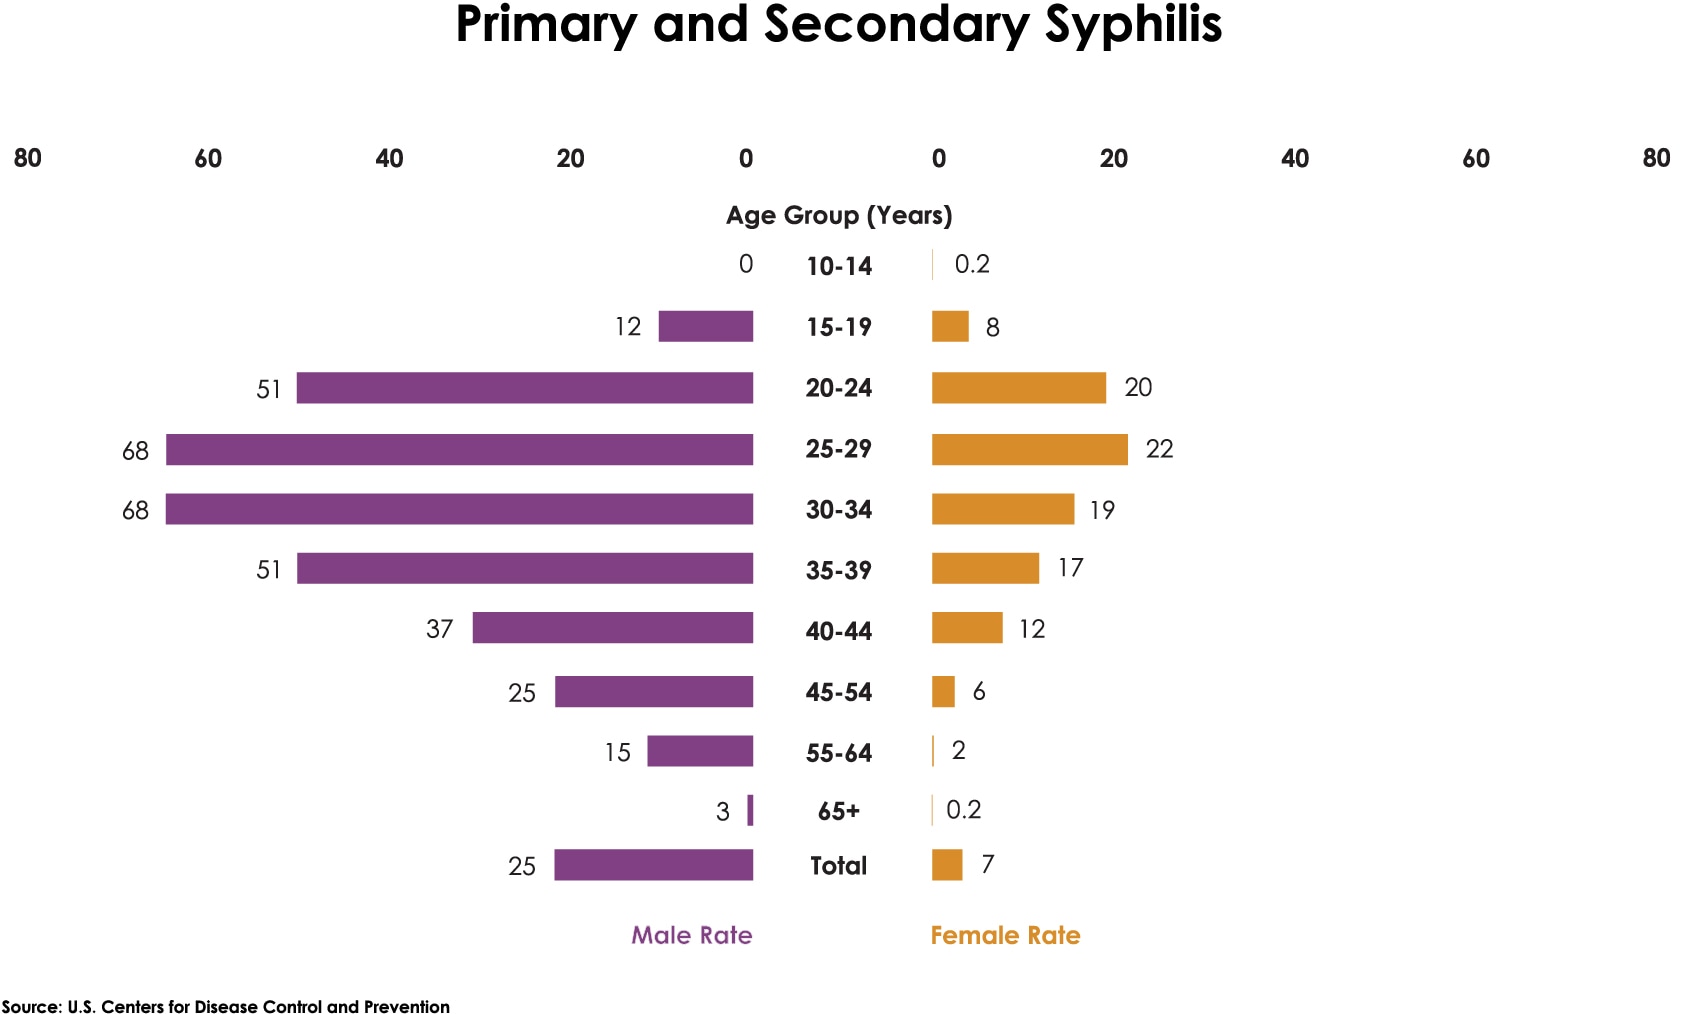
A paired horizontal bar chart showing 2021 rates of primary and secondary syphilis by age and sex, with the highest rates among males ages 25-29 and 30-34.[JPG - 170 KB]

Primary and secondary syphilis

People from Racial and Ethnic Minority Groups
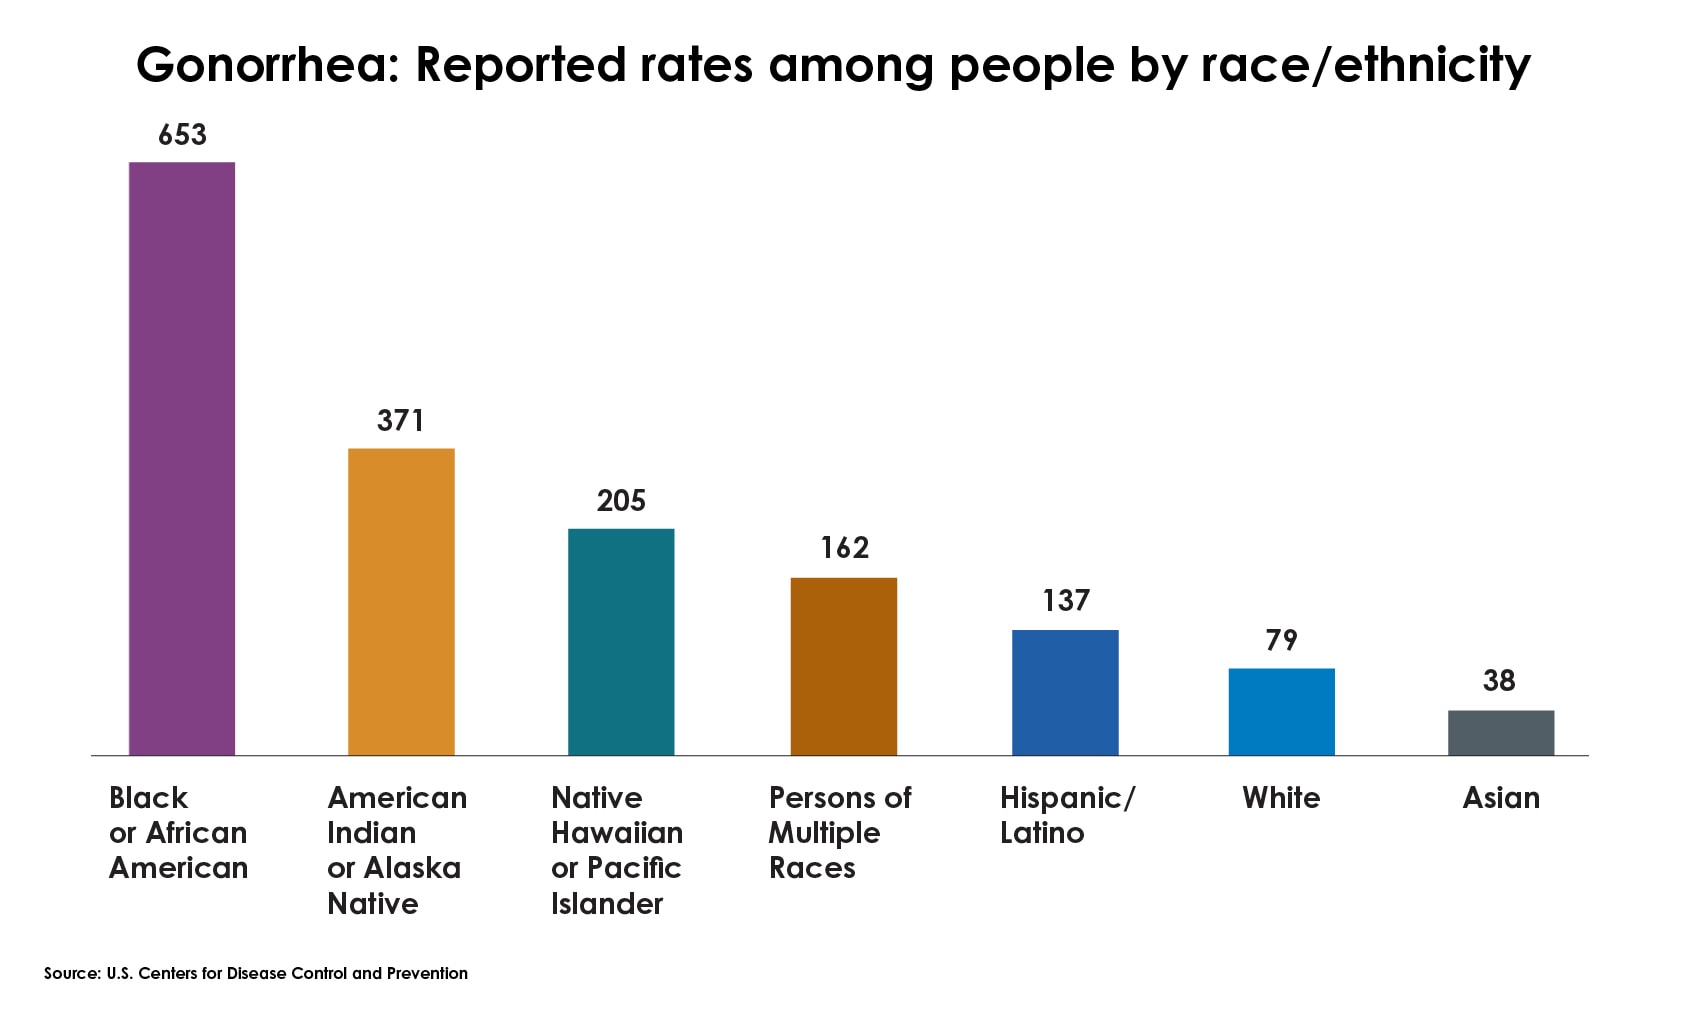
A bar chart showing 2021 gonorrhea rates by race and ethnicity were highest among people who are Black or African American, followed by people who are American Indian or Alaskan Native

Gonorrhea

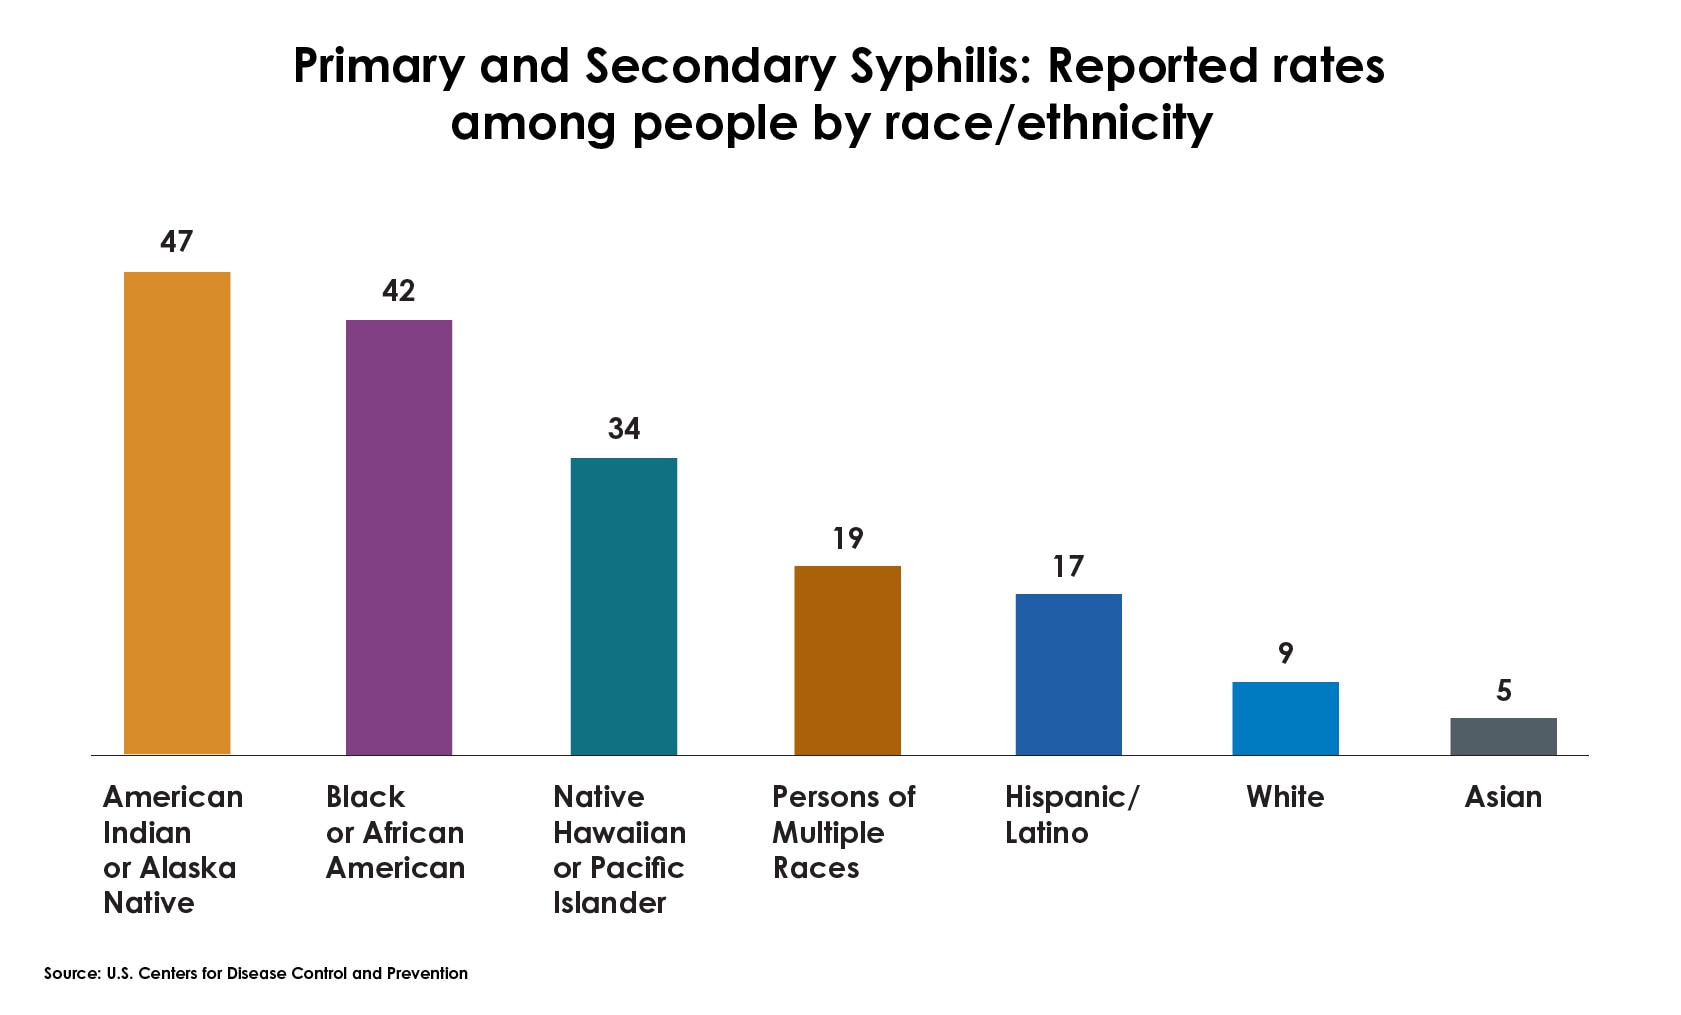
A bar chart showing 2021 primary and secondary syphilis rates by race and ethnicity were highest among people who are American Indian or Alaskan Native, followed by people who are Black or African American

Primary and secondary syphilis

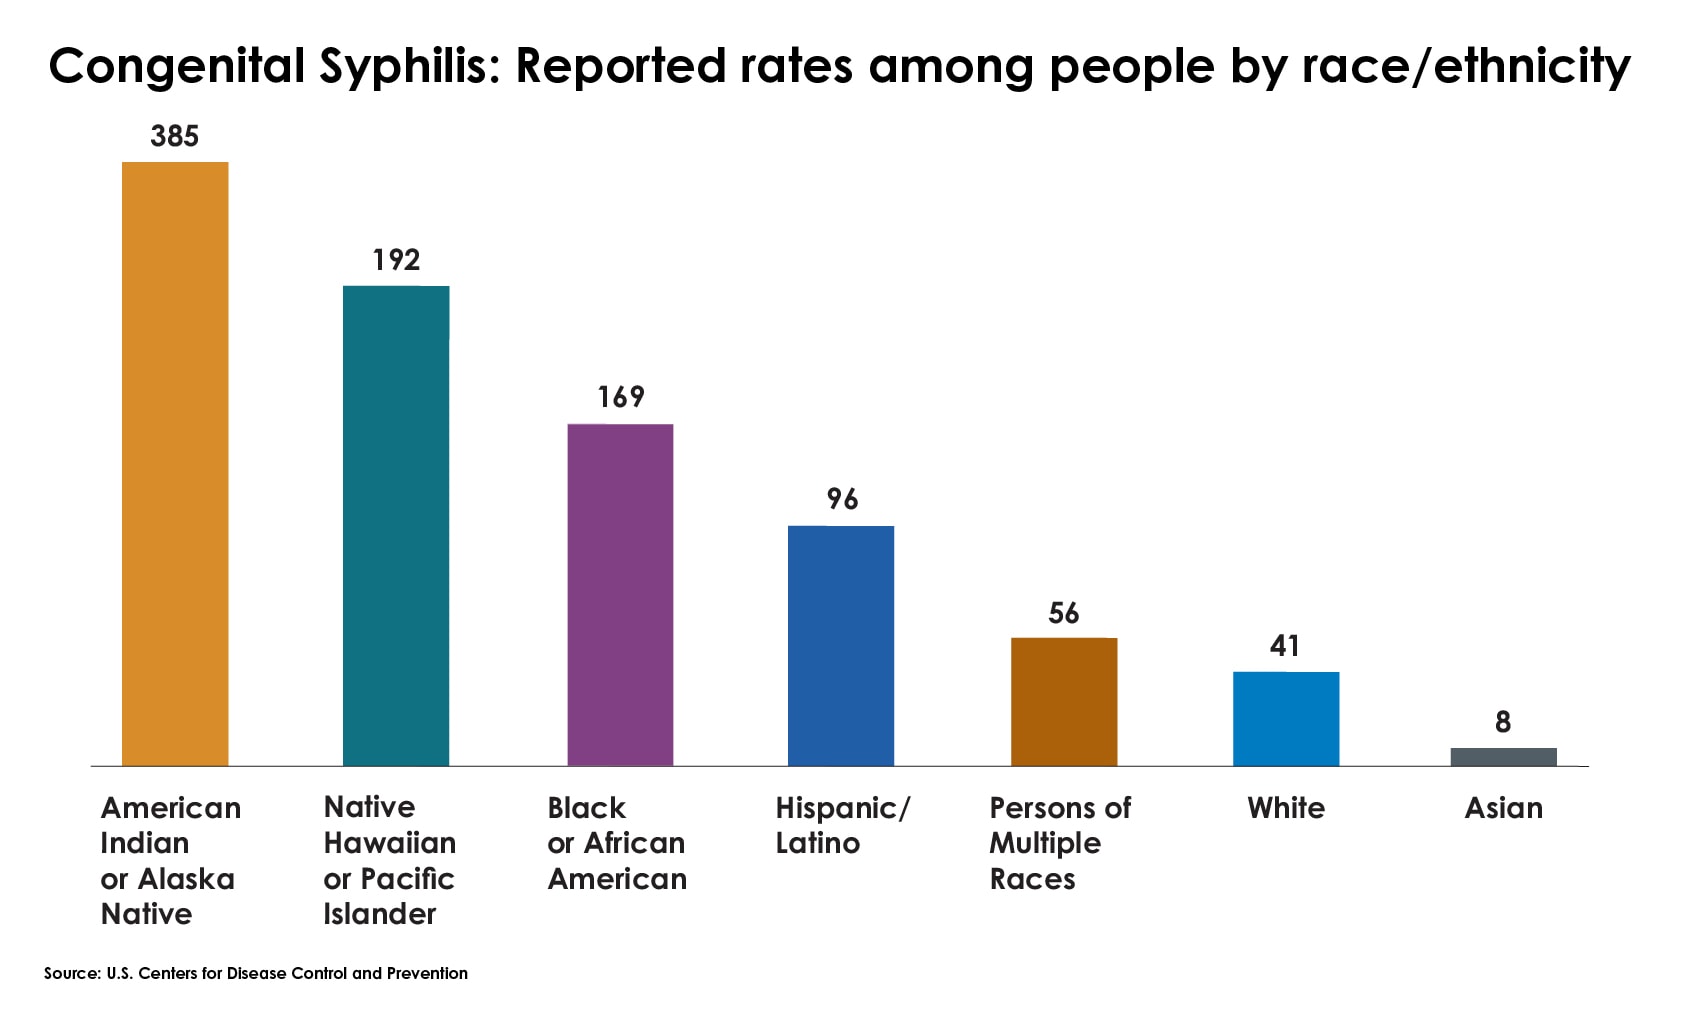
A bar chart showing 2021 rates of congenital syphilis were highest among people who are  American Indian or Alaskan Native, followed by people who are Native Hawaiian or Pacific Islander.

Congenital syphilis

Gay and bisexual men also experienced disproportionate rates of some STDs in 2021
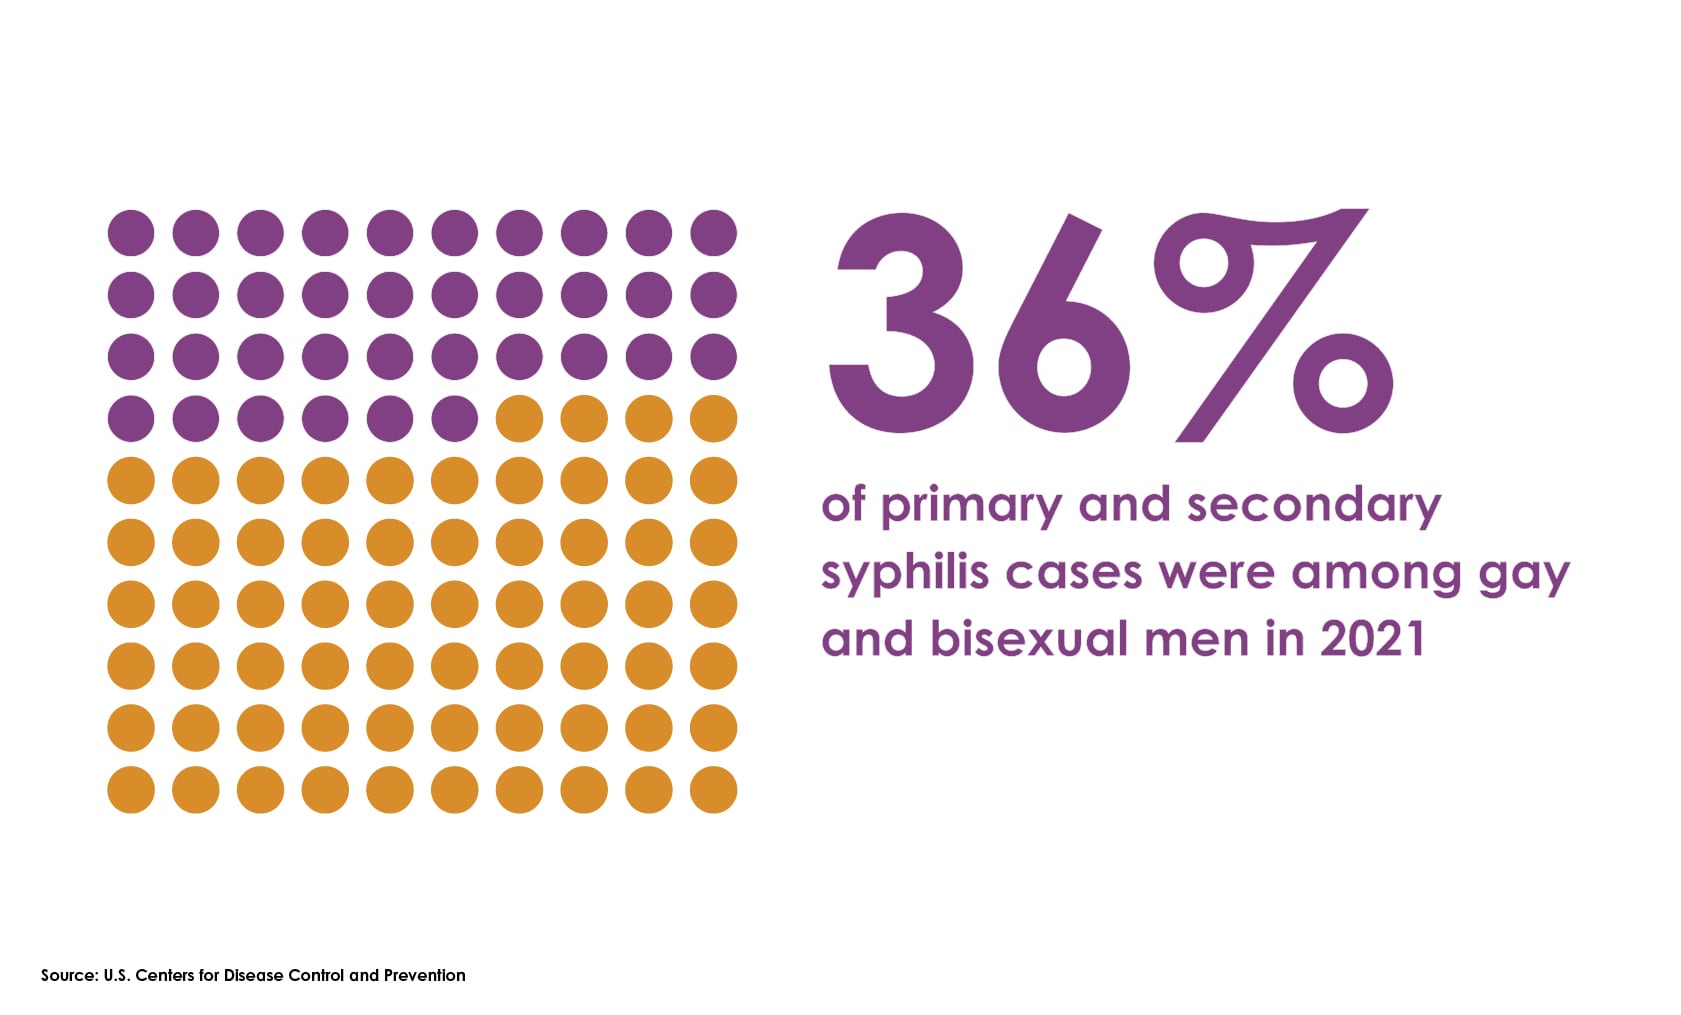
A waffle chart showing that in 2021, 36% of primary and secondary syphilis cases were among gay and bisexual men.[JPG - 168 KB]

36% of primary and secondary syphilis

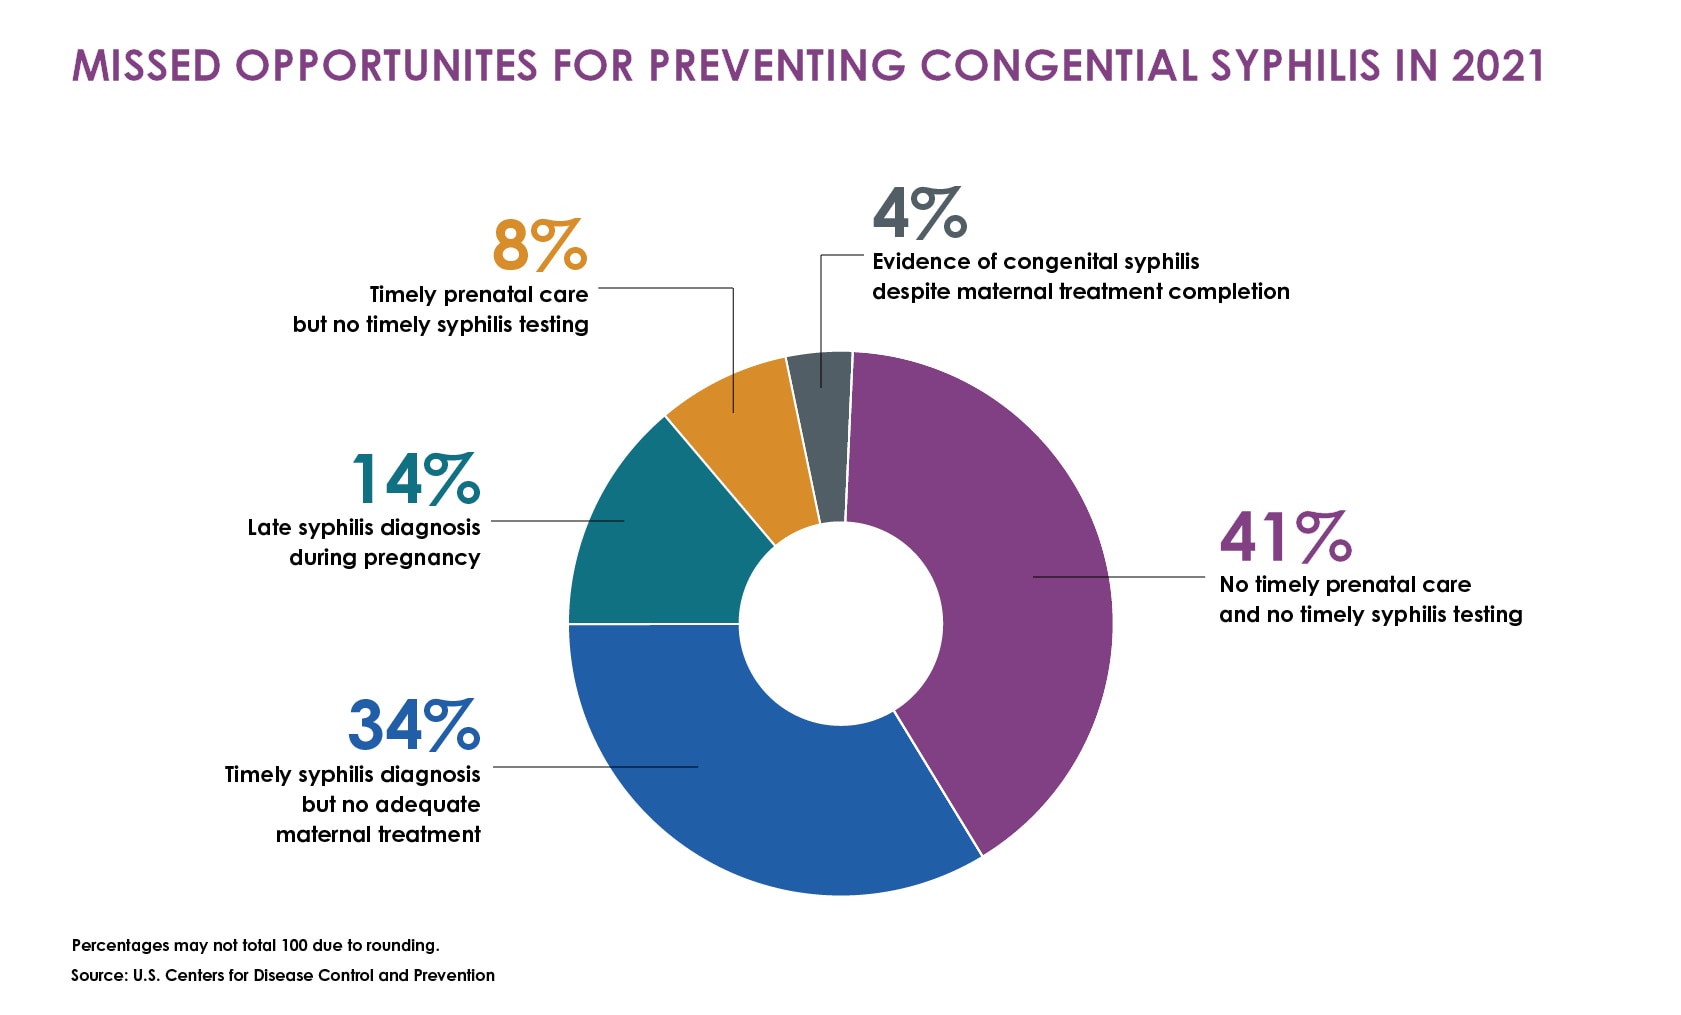
A doughnut chart showing missed opportunities for preventing congenital syphilis in 2021, with “no timely prenatal care” and “timely syphilis diagnosis but no adequate treatment” accounting for 41% and 34% of cases, respectively.

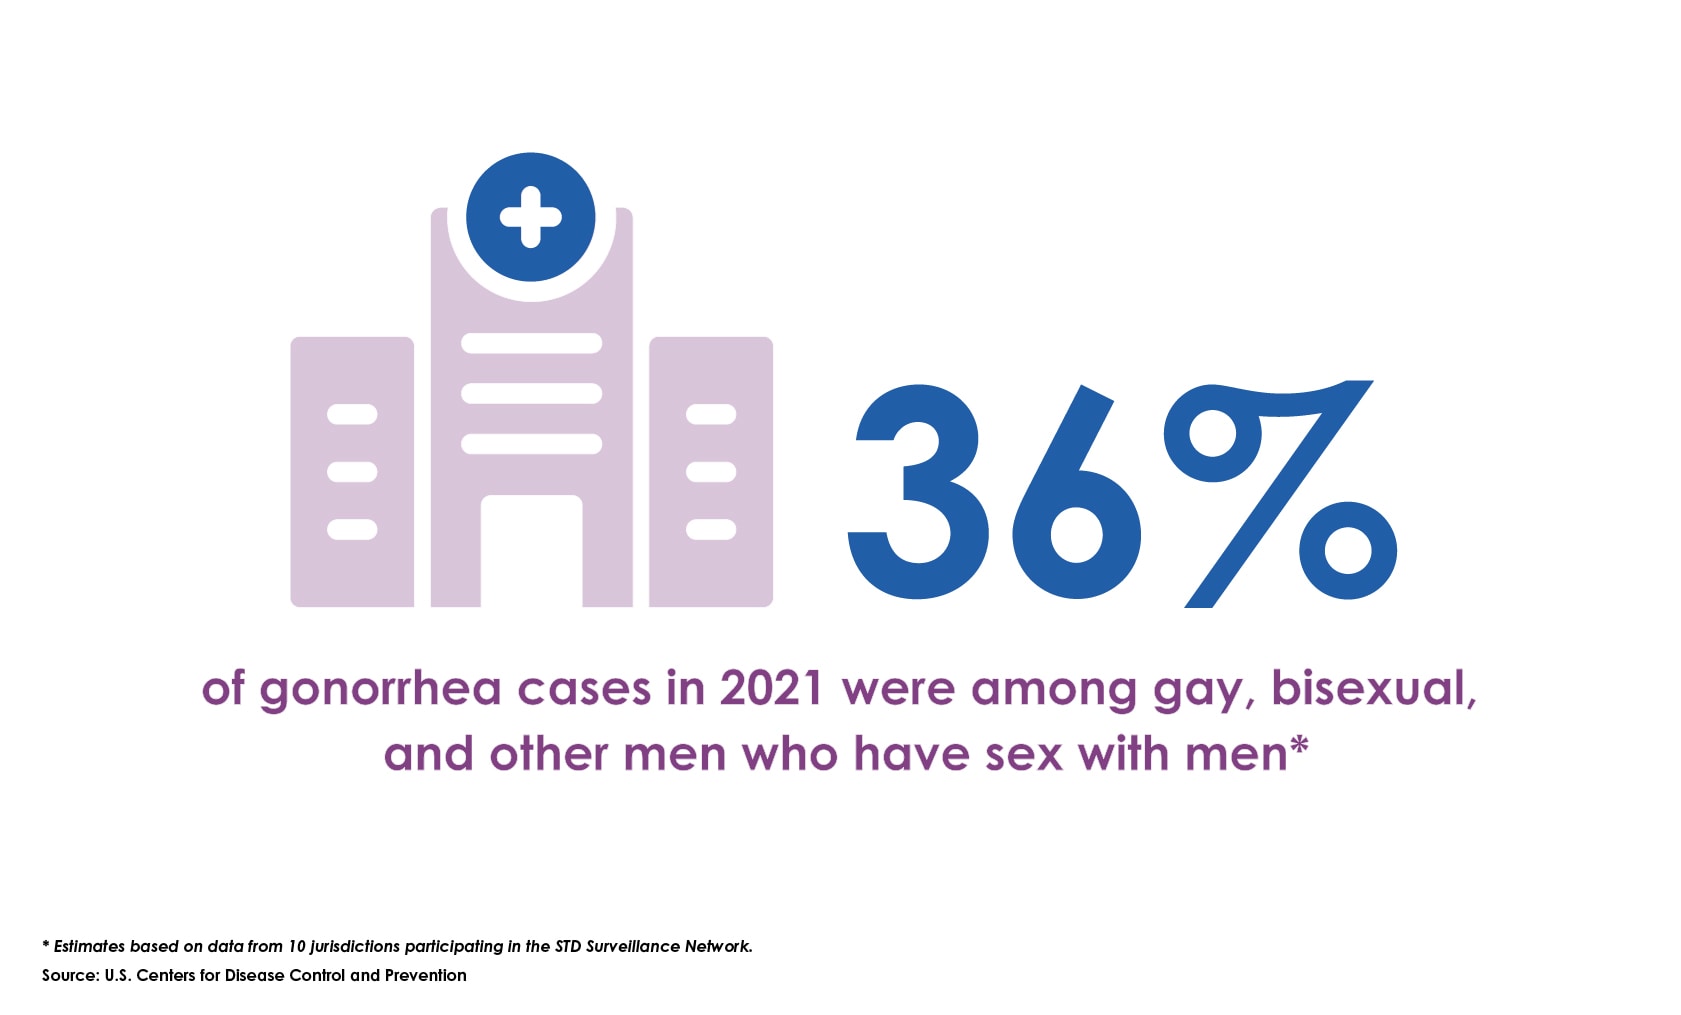
36% of gonorrhea cases in 2021

Spanish-Language Graphics (Gráficos)
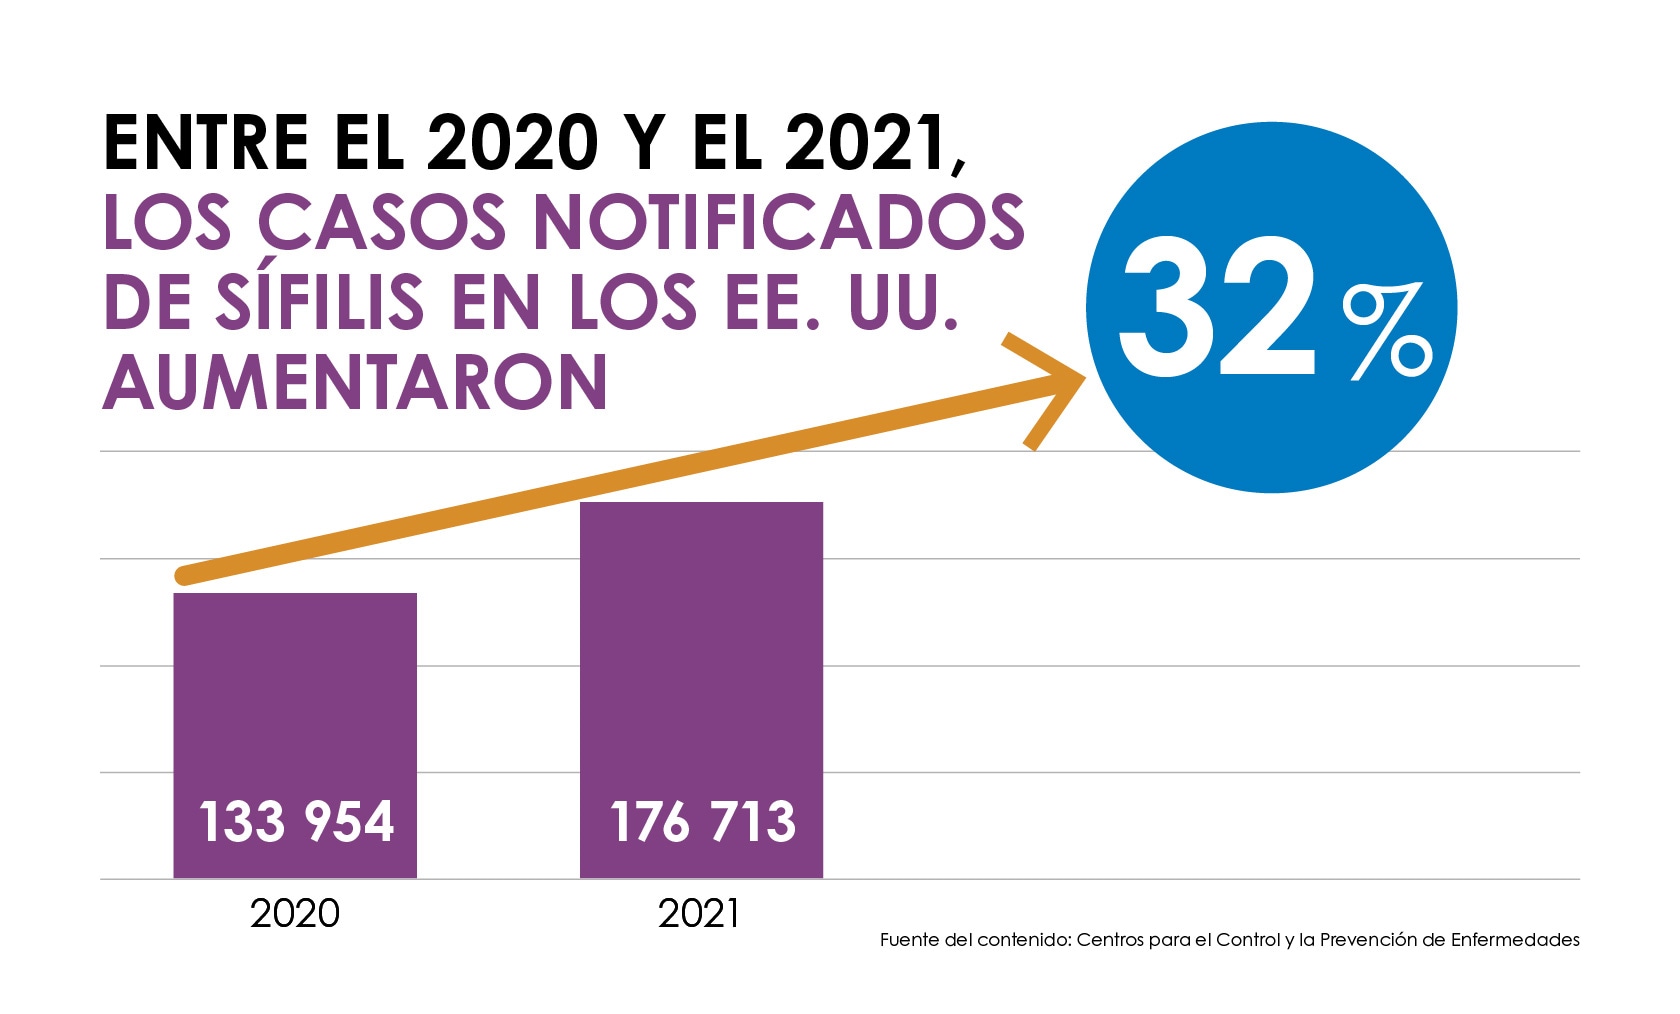
Un diagrama de barras muestra que los casos notificados de sífilis aumentaron un 32 % entre el 2020 y el 2021, de 133,954 de casos notificados en el 2020 a 176,713 en el 2021

Casos semanales reportados de ETS en EE.UU.: 2020 comparado al 2021
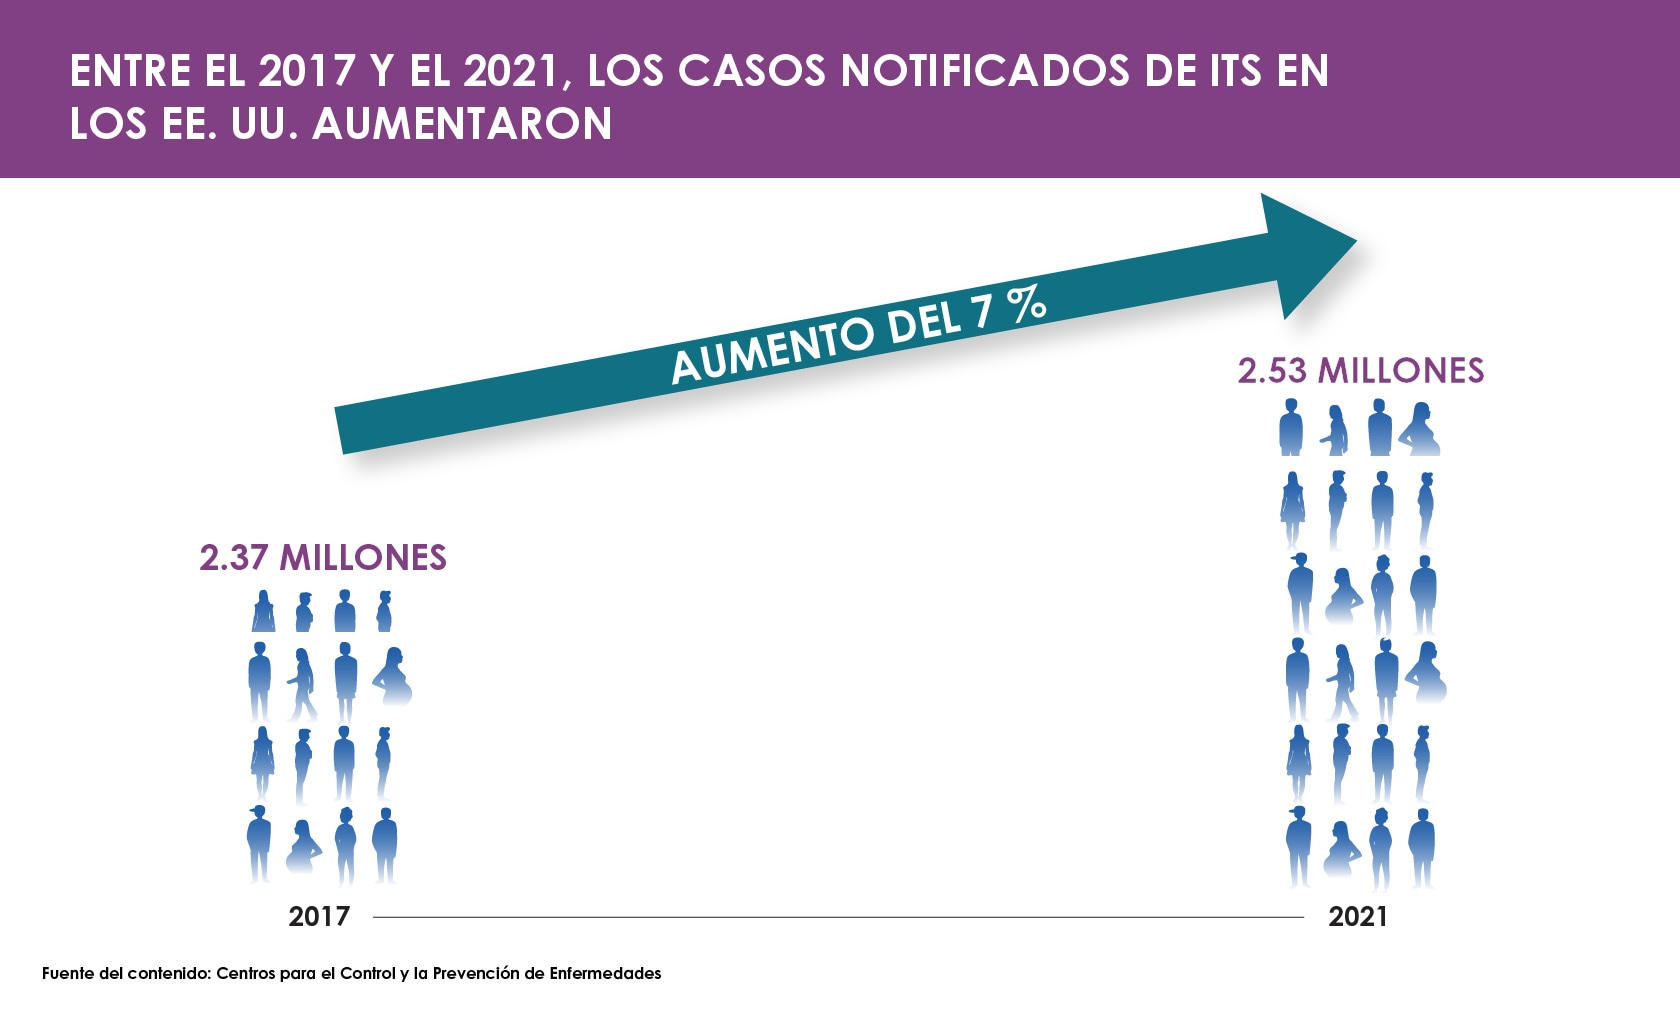
Un diagrama de barras muestra que los casos de ITS notificados aumentaron un 7 % entre el 2017 y el 2021, de 2.37 millones de casos notificados en el 2017 a 2.53 millones en el 2021.

La sífilis en recién nacidos está aumentando en los Estados Unidos
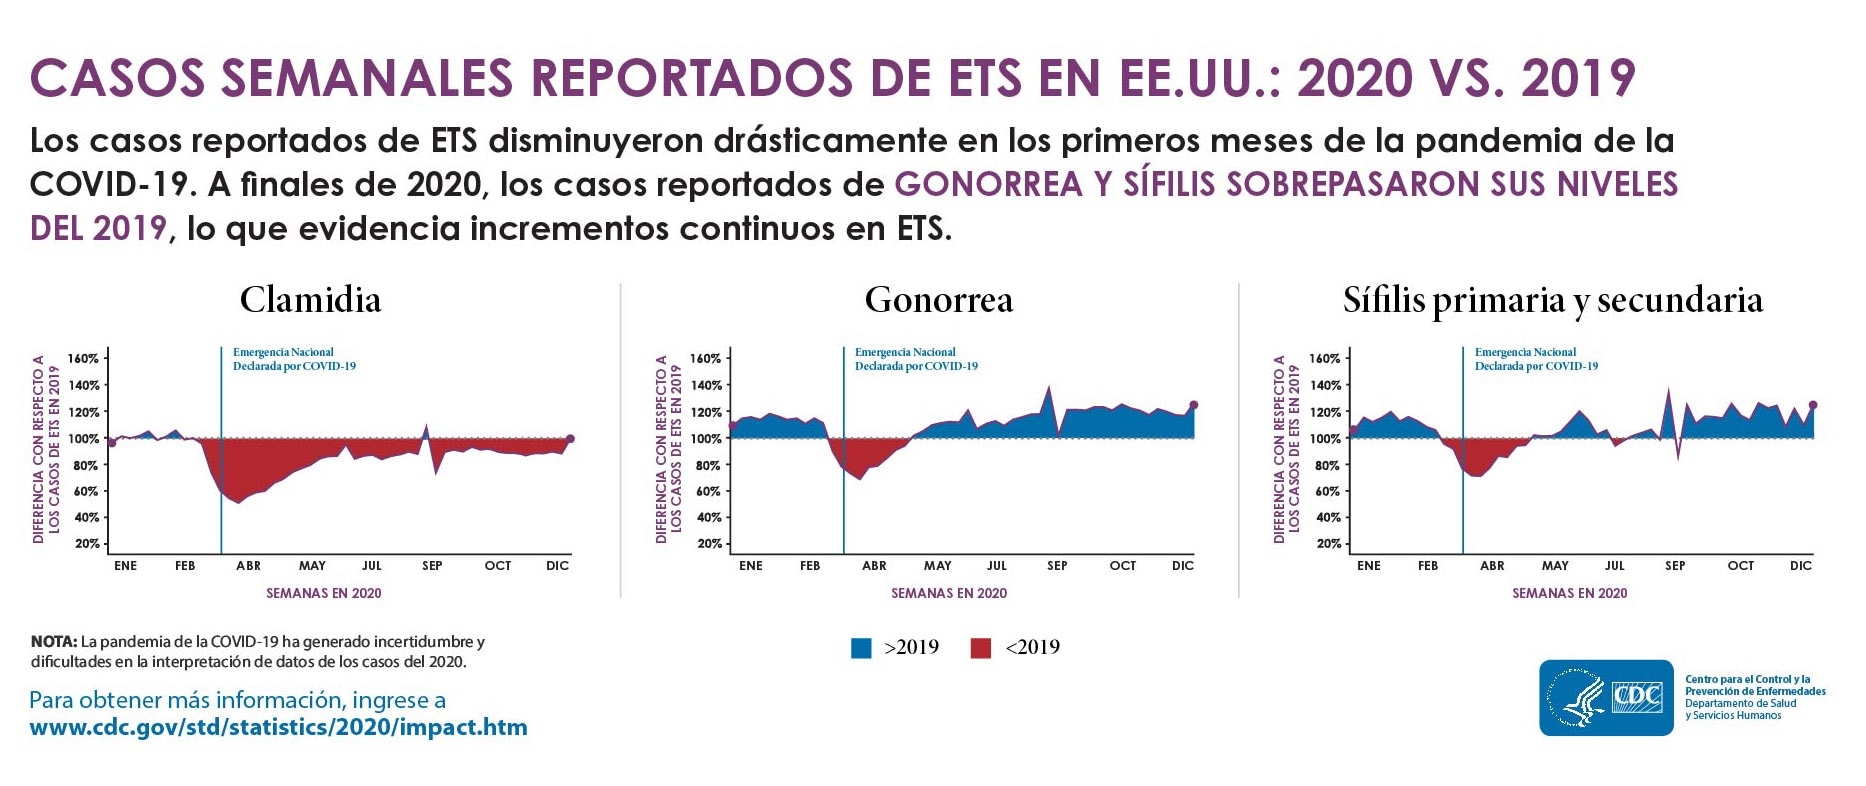
Durante los primeros meses de la pandemia de COVID-19, los casos de enfermedades de transmisión sexual (ETS) reportados disminuyeron, pero por el final del año 2020, casos reportados de gonorrea y sífilis superaron los niveles del 2019.

Casos semanales reportados de ETS en EE.UU.: 2020 comparado al 2019
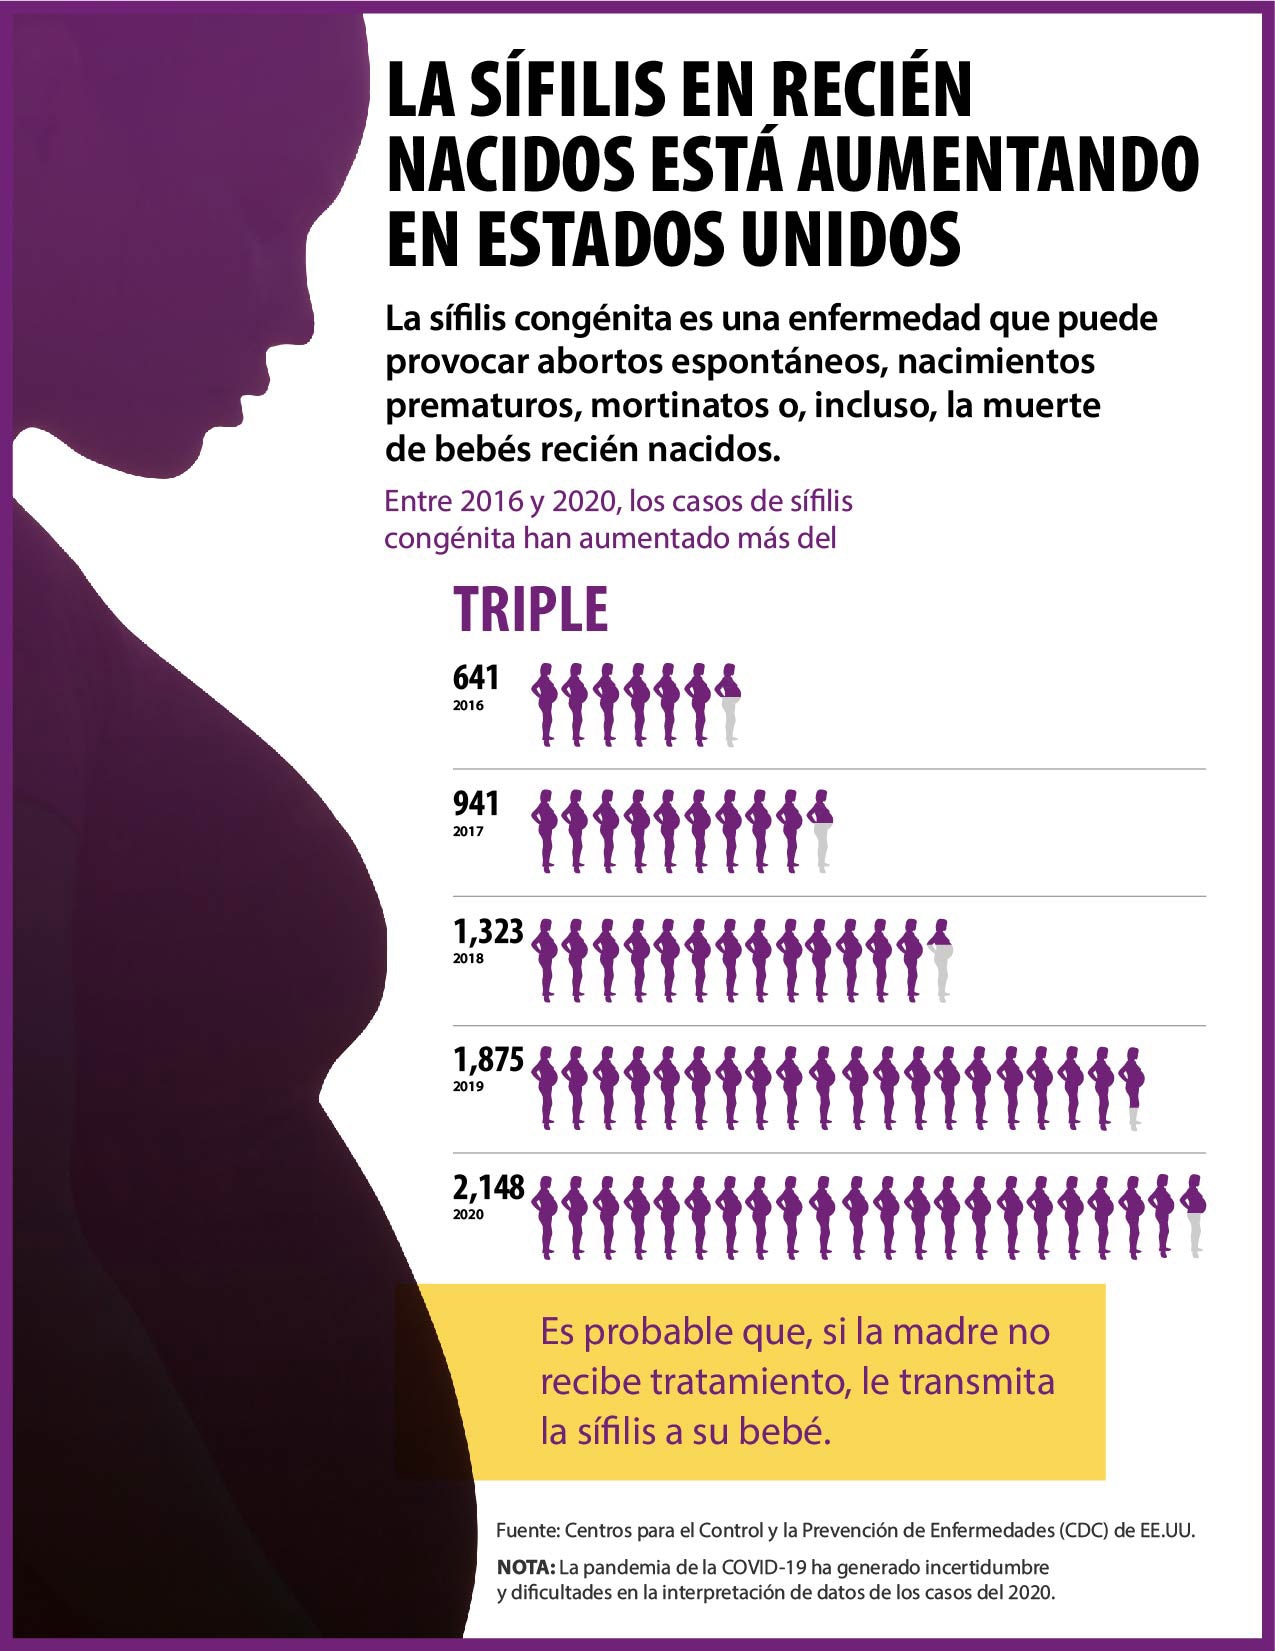
La sífilis en recién nacidos aumento más del triple del 2016 al 2020, de 641 cases en el 2016, a 2,148 cases reportados en el 2020.

La sífilis en recién nacidos está aumentando en los Estados Unidos

Congenital Syphilis Materials

Every case of syphilis among newborns (congenital syphilis) is one too many when testing and treatment can save lives.
A hospital icon showing that in 2021, 36% of gonorrhea cases were  among gay, bisexual, and other men who have sex with men based on data from jurisdictions participating in the STD Surveillance Network.

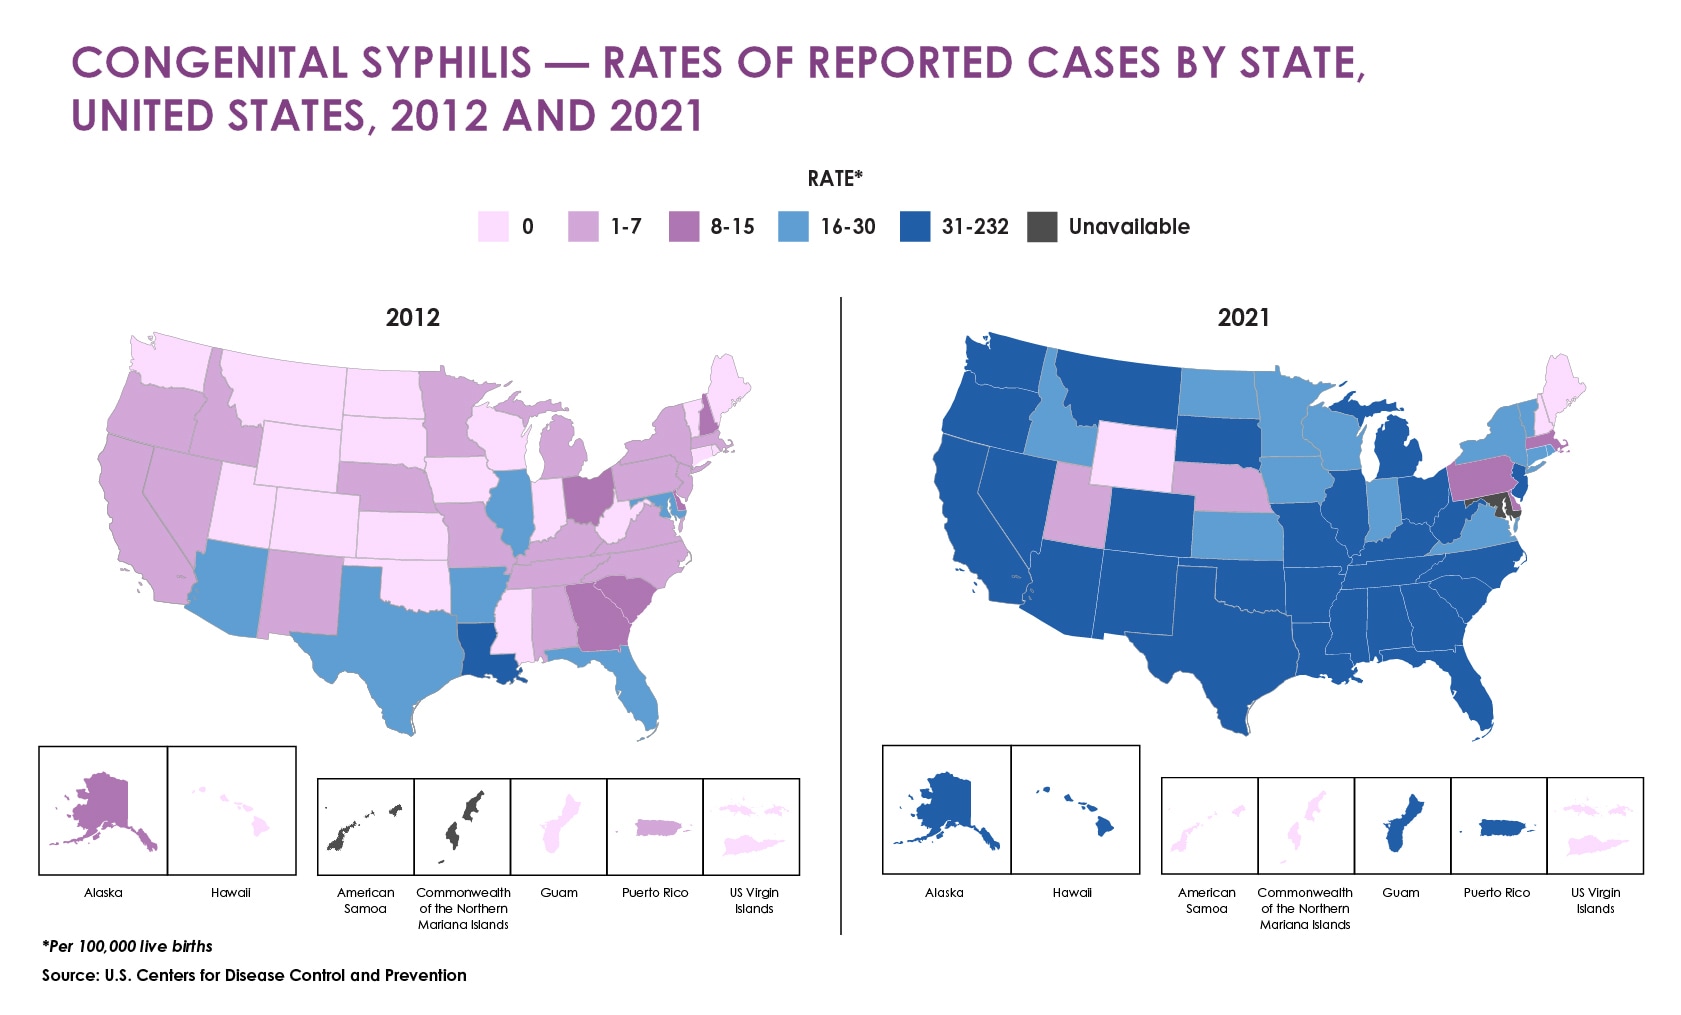
Congenital Syphilis – Rates of reported cases by state, United States (2012 and 2021)
Two heat maps showing increases in the rates of congenital syphilis cases by state from 2012 to 2021, showing reported cases in nearly every state in 2021.

Missed Opportunities for Preventing Congenital Syphilis in 2021
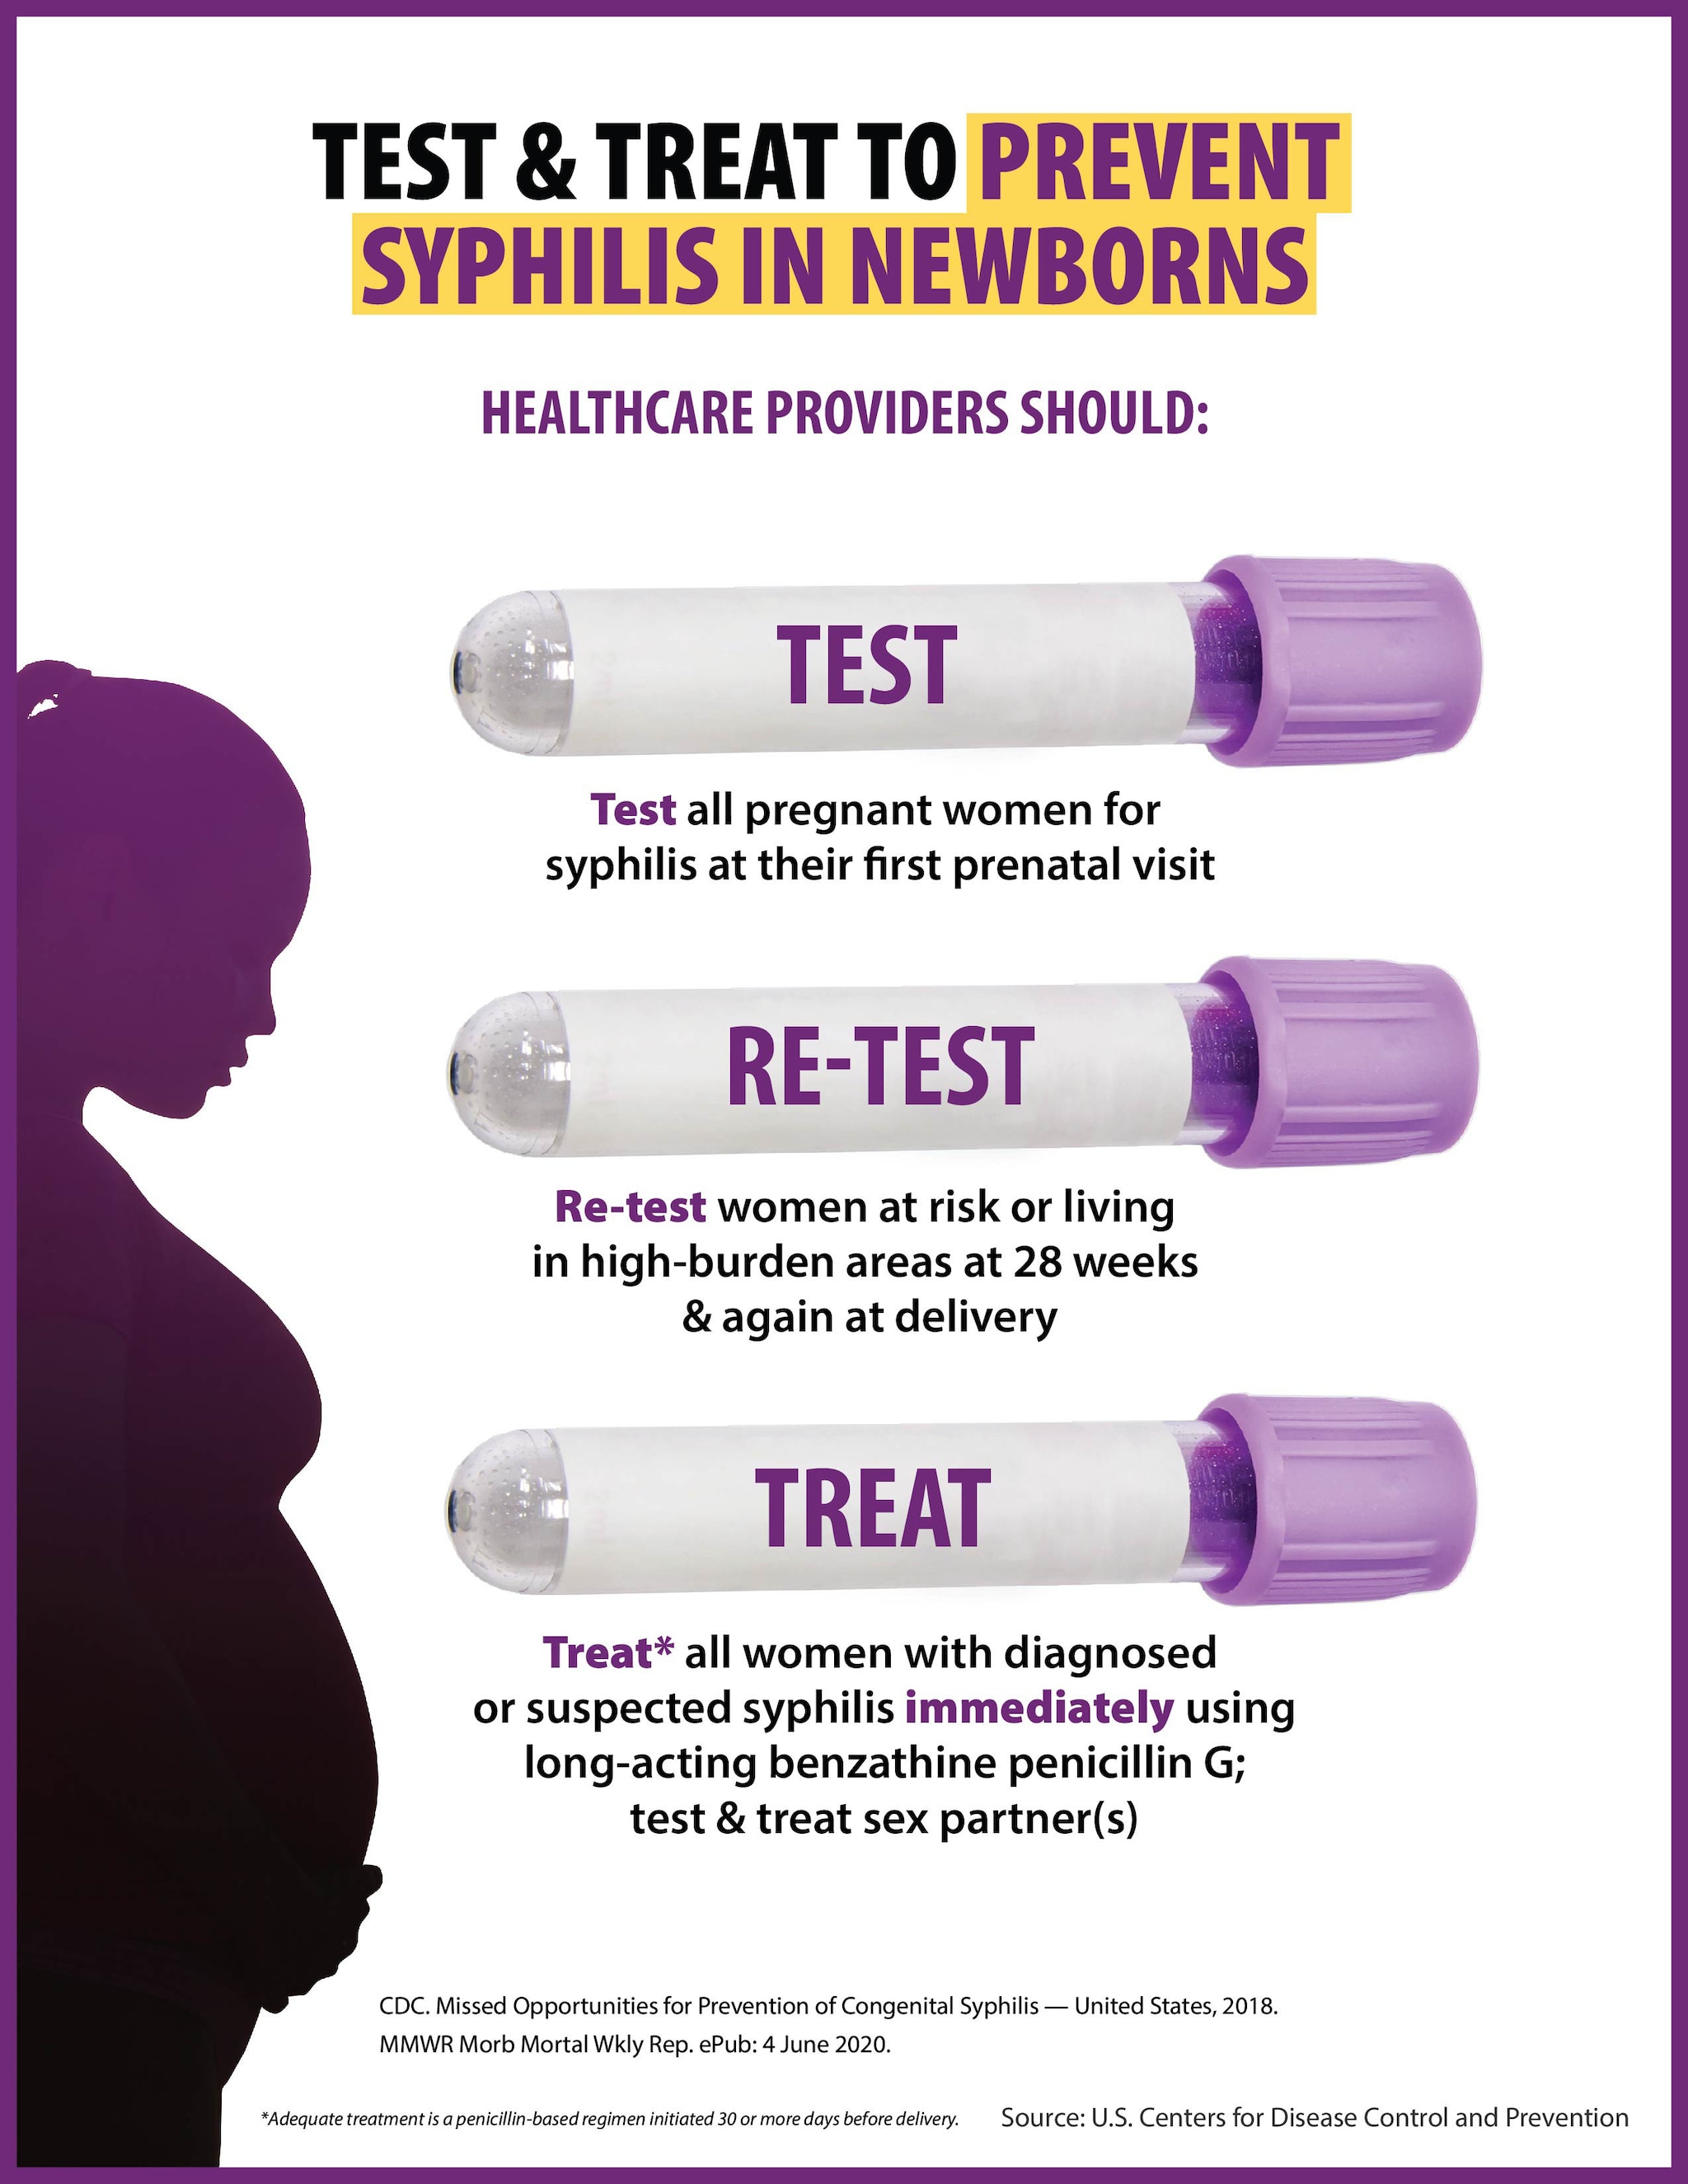
This graphic shows three test tubes next to the silhouette of a pregnant woman. The test tubes say to test all pregnant women for syphilis at their first prenatal visit, re-test those at risk or living in high-burden areas, and immediately treat those with diagnosed or suspected syphilis.

Test & Treat to Prevent Syphilis in Newborns

A bar chart showing 2021 rates of congenital syphilis were highest among people who are  American Indian or Alaskan Native, followed by people who are Native Hawaiian or Pacific Islander.

Congenital Syphilis

Estimated STI Incidence, Prevalence, & Costs in 2018 (published Jan. 2021)

CDC’s most recent estimated prevalence estimates show that on any given day in 2018, 1 in 5 people in the U.S. had a sexually transmitted infection (STI). Analyses, published in the journal Sexually Transmitted Diseases, show the burden of diagnosed and undiagnosed STIs in the U.S., and the estimated medical costs associated with STIs.
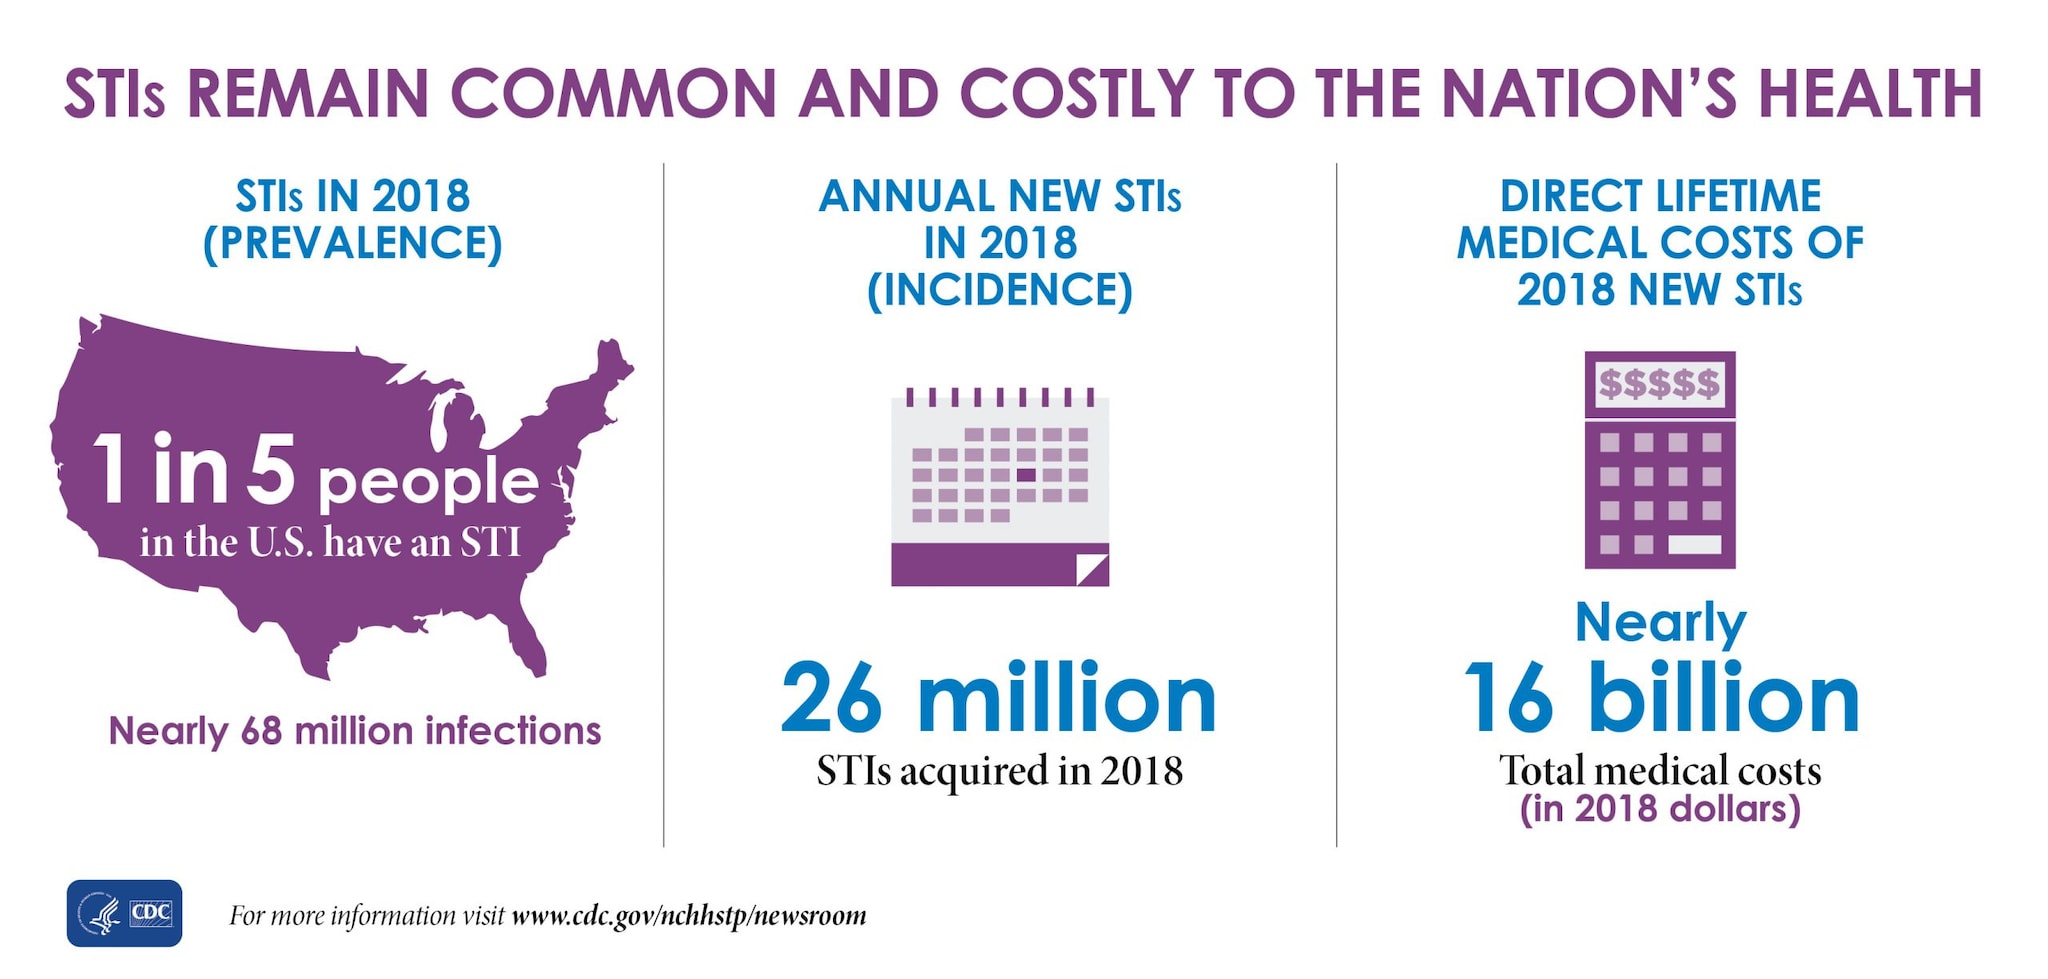
The graphic shows there were nearly 68 million infections in 2018 (prevalence), and that 1 in 5 people in the U.S. have an STI.   The graphic also shows that there were 26 million STIs acquired in 2018 (incidence).   And, the graphic shows that the direct lifetime medical costs of new STIs in 2018 totaled nearly $16 billion (in 2018 dollars).[JPG - 247 KB]

STIs Remain Common and Costly to the Nation’s Health
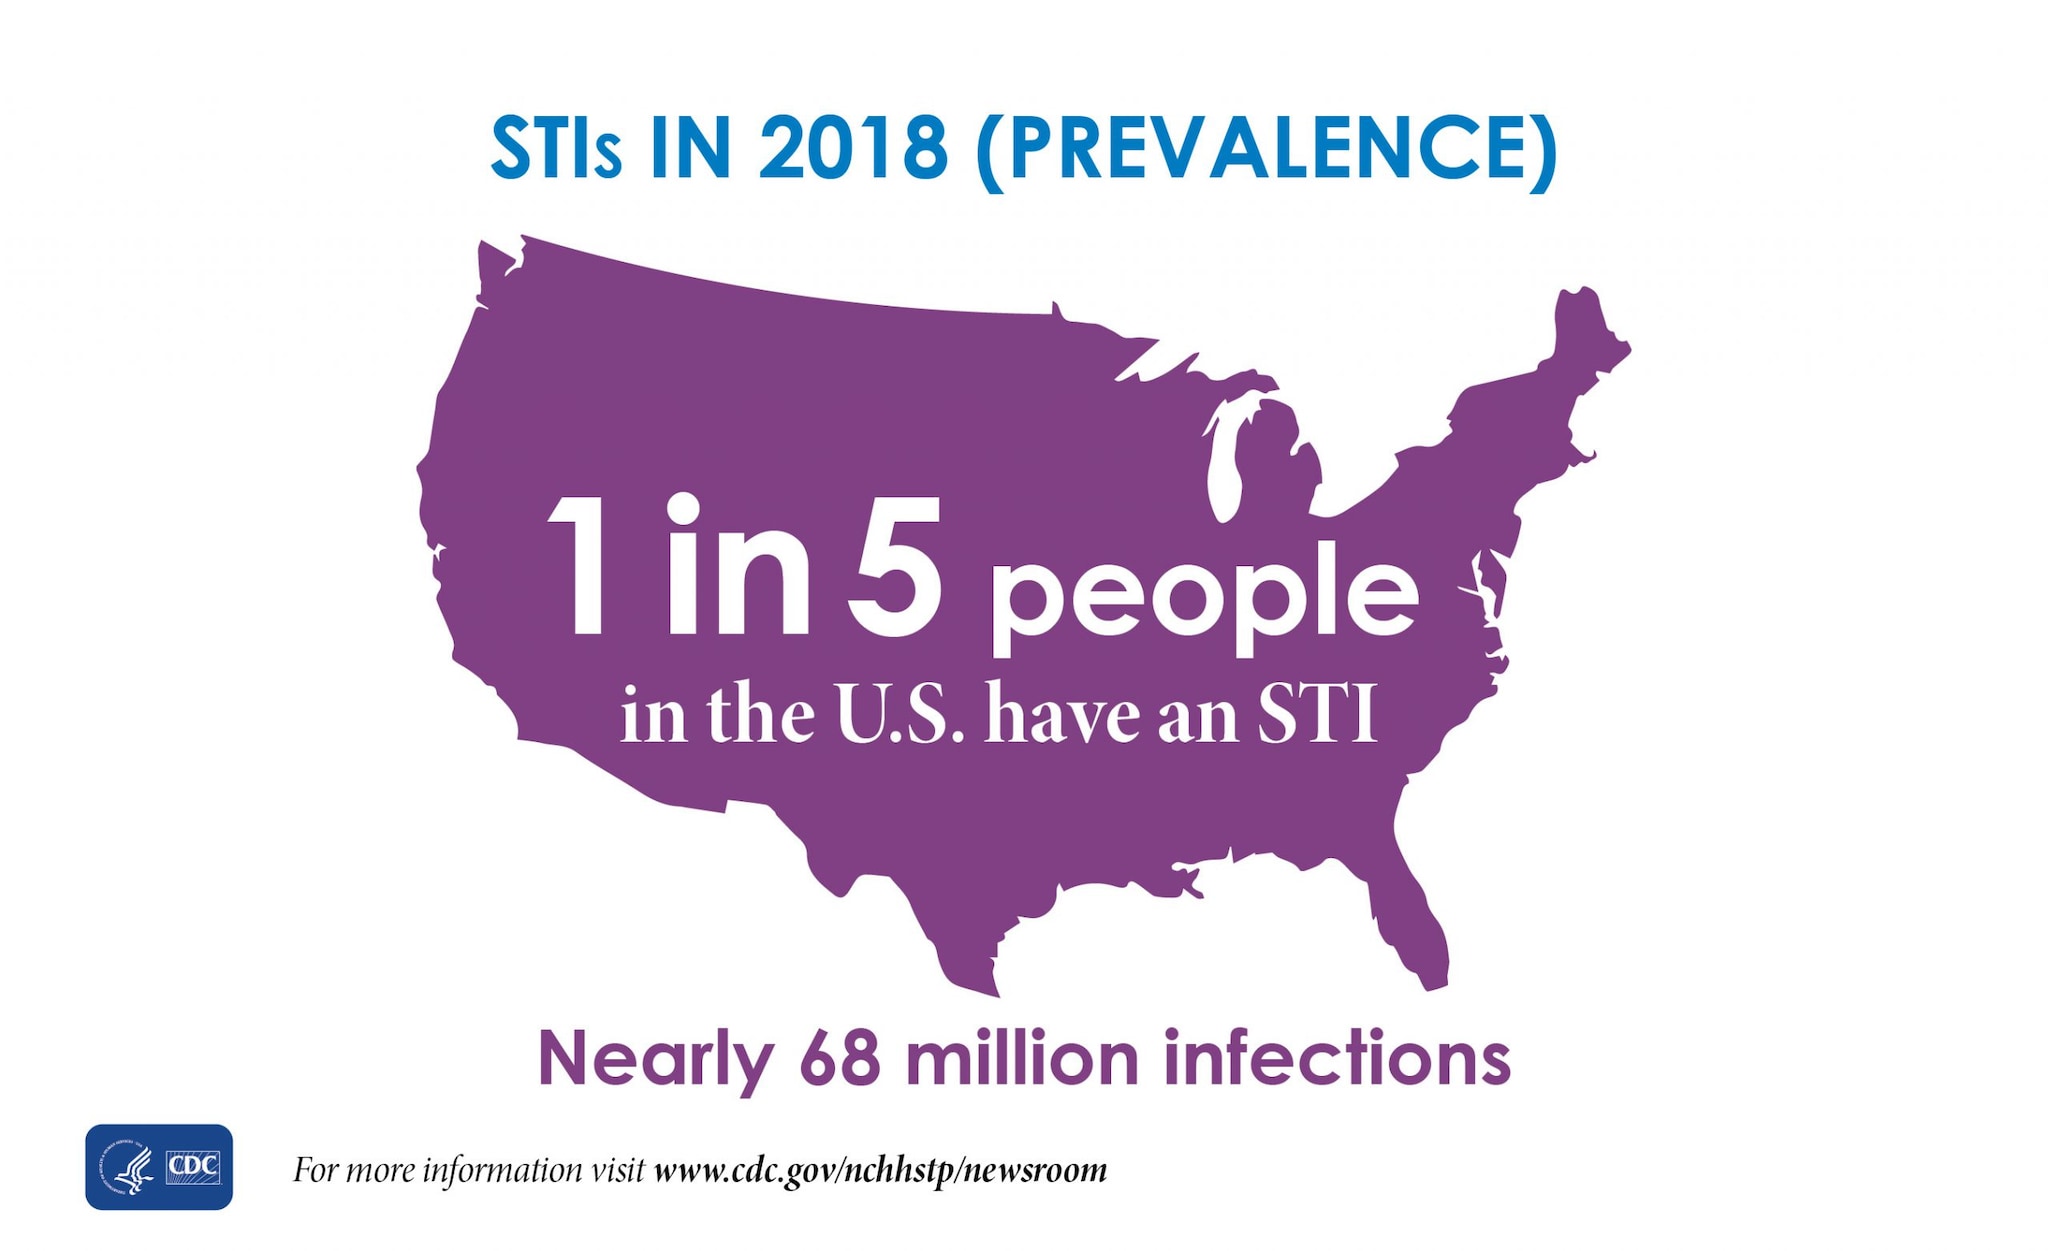
The graphic shows there were nearly 68 million infections in 2018 (prevalence), and that 1 in 5 people in the U.S. have an STI.[JPG - 181 KB]

STIs in 2018 (Prevalence)

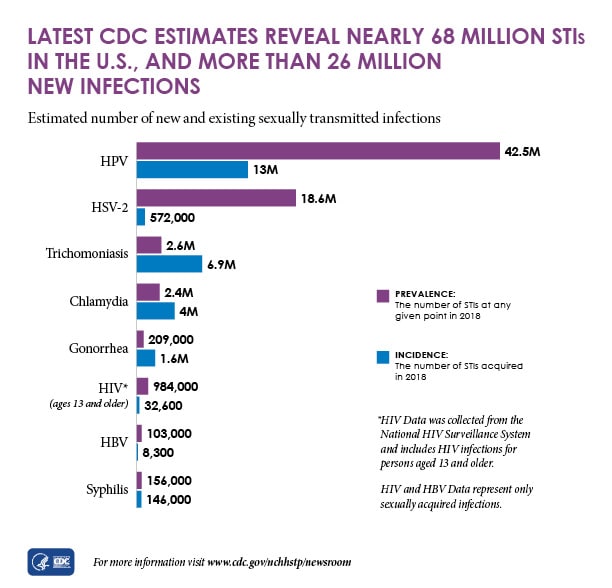
This bar graph shows the estimated number of new (incident) and existing (prevalent) sexually transmitted infections in 2018.   This graph shows there were 42.5 million prevalent and 13 million incident HPV infections; 18.6 million prevalent and 572,000 incident HSV-2 infections; 2.6 million prevalent and 6.9 incident trichomoniasis infections; 2.4 million prevalent and 4 million incident chlamydia infections; 209,000 prevalent and 1.6 million incident gonorrhea infections; 984,000 prevalent and 32,600 incident HIV infections in people ages 13 and older; 103,000 prevalent and 8,300 incident HBV infections; and 156,000 prevalent and 146,000 incident syphilis infections.  This graph notes that HIV data was collected from the National HIV Surveillance System and includes HIV infections for persons aged 13 and older. HIV and HBV data represent only sexually acquired infections.[JPG - 92 KB]

Latest CDC Estimates Reveal Nearly 68 Million STIs in the U.S., and 27 Million New Infections
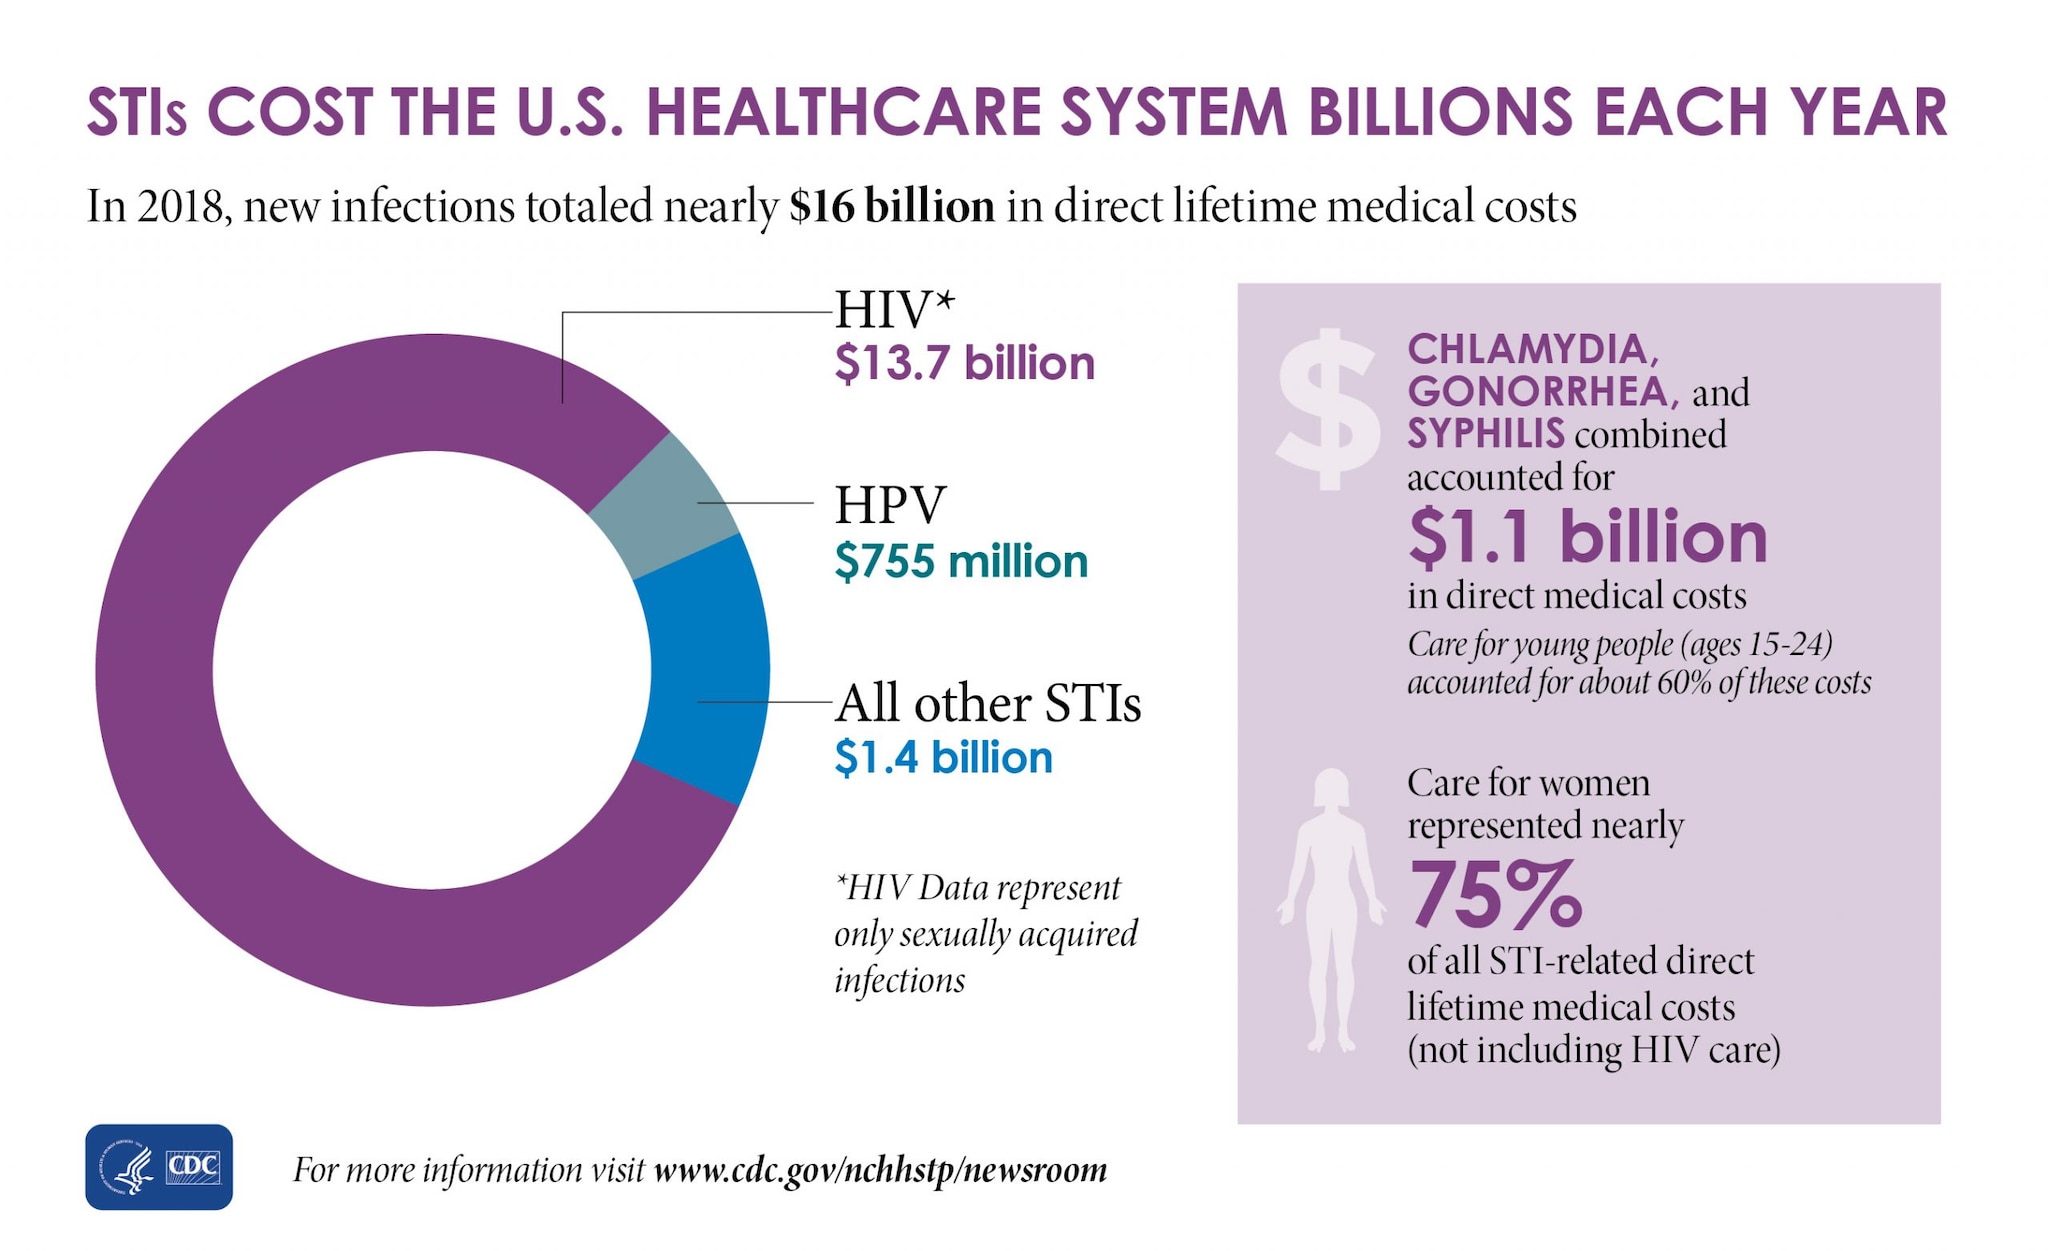
This graphic shows that in 2018, new HIV infections cost $13.7 billion in direct lifetime medical costs, new HPV infections cost $755 million in direct lifetime medical costs, and all other STIs cost $1.4 billion in direct lifetime medical costs.   This graphic shows that chlamydia, gonorrhea, and syphilis combined accounted for $1.1 billion in direct medical costs, and that care for young people (ages 15-24) accounted for about 60%26#37; of these costs.   This graphic shows that care for women represented nearly 75%26#37; of all STI-related direct lifetime medical costs (not including HIV care).   This graphic shows that HIV data represent only sexually acquired infections.[JPG - 280 KB]

STIs Cost the U.S. Healthcare System Billions Each Year
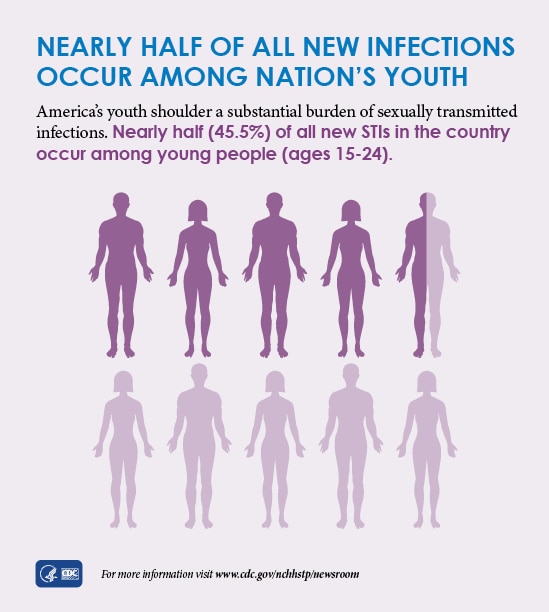
This graphic shows latest CDC data indicate that nearly half of all new STI infections occur among nation's youth, with 45.5%26#37; of all new STIs were among young people ages 15-24 in 2018

Nearly Half of All New Infections Occur Among Nation’s Youth