National Black HIV/AIDS Awareness Day 2022
February 3, 2022 – CDC Data Released Ahead of National Black HIV/AIDS Awareness Day Highlights Factors that Contribute to Continuing HIV Disparities in the U.S.
Despite overall progress in reducing HIV transmission in the United States, HIV continues to affect some groups more than others due to longstanding and ingrained barriers. Black or African American (hereafter referred to as Black) people account for a higher proportion of new HIV infections, compared to other races and ethnicities. Black people accounted for 13% of the U.S. population but 40% of people with HIV in 2019, according to CDC estimates. HIV disparities can and must end. Racism, longstanding systemic inequities, residential segregation, social and economic marginalization, and other ingrained barriers are among the factors that have contributed to these troubling and persistent disparities. To achieve health equity and end the HIV epidemic, the nation must overcome barriers that, for far too long, have stood between some people and highly effective HIV prevention and treatment tools.
-
- Media Statement: CDC Data Released Ahead of National Black HIV/AIDS Awareness Day
Highlights Factors that Contribute to Continuing HIV Disparity in the U.S. - Fact Sheet: HIV and Black/African American People in the U.S.
- MMWR: Association Between Social Vulnerability and Rates of HIV Diagnoses Among Black Adults, by Selected Characteristics and Region of Residence — United States, 2018
- MMWR: Notes from the Field: COVID-19 Vaccination Among Persons Living with Diagnosed HIV Infection — New York, October 2021 Vaccination
- Media Statement: CDC Data Released Ahead of National Black HIV/AIDS Awareness Day
Graphics:
These high-resolution, public domain images are ready to download and print in your publication. Click on a graphic to see it in high-resolution. For your convenience, we have included a table that contains the specific data from the report used to generate these charts. These images are in the public domain and are thus free of any copyright restrictions. As a matter of courtesy, we ask that the content provider be credited and notified of any public or private usage of an image.

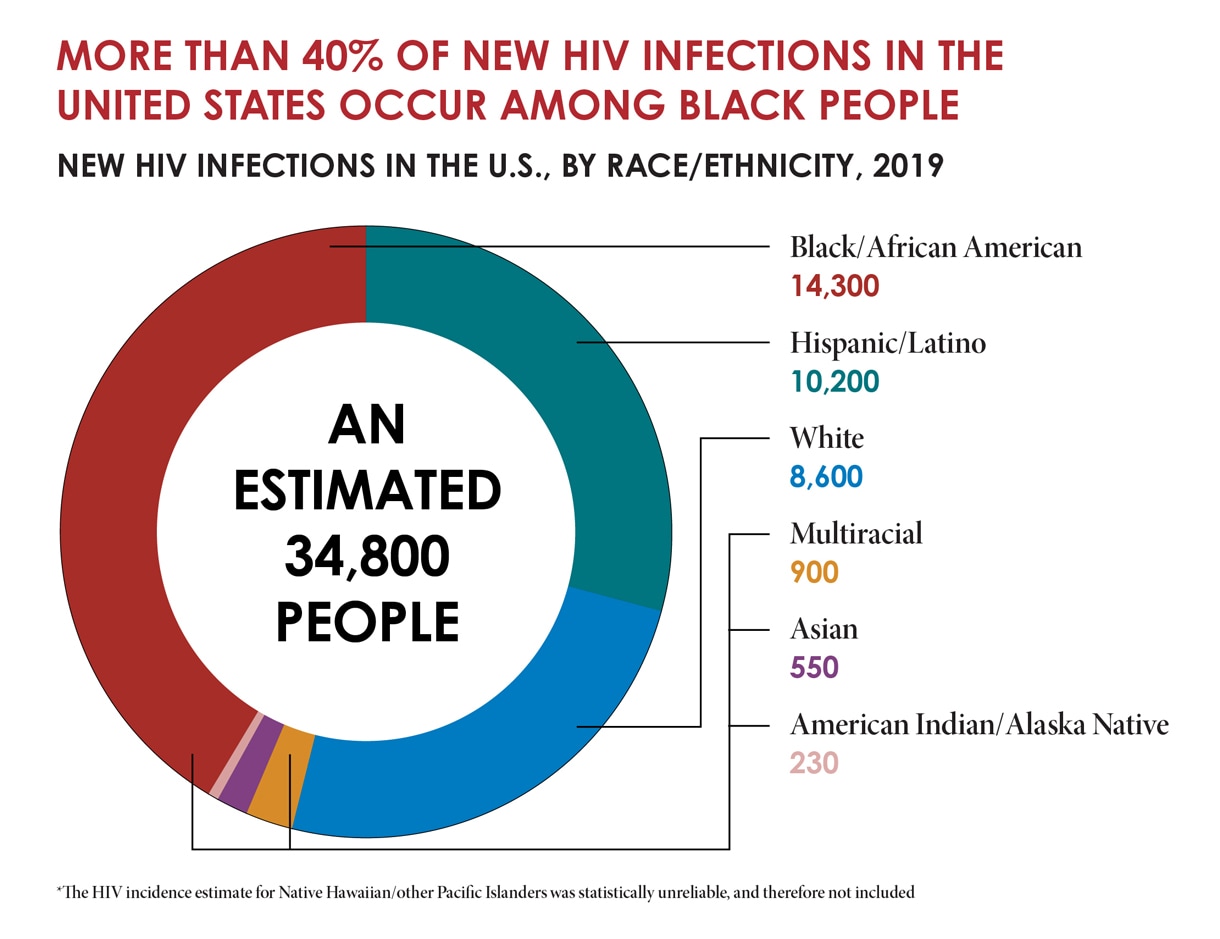
The donut graph shows that of the estimated 34,800 people with new HIV infections in the U.S. in 2019, 14,300 were Black/African American, 10,200 were Hispanic/Latino, 8,600 were White, 900 were multiracial, 550 were Asian, and 230 were American Indian/Alaska Native. The HIV incidence estimate for Native Hawaiian/other Pacific Islander people was statistically unreliable and therefore not included.

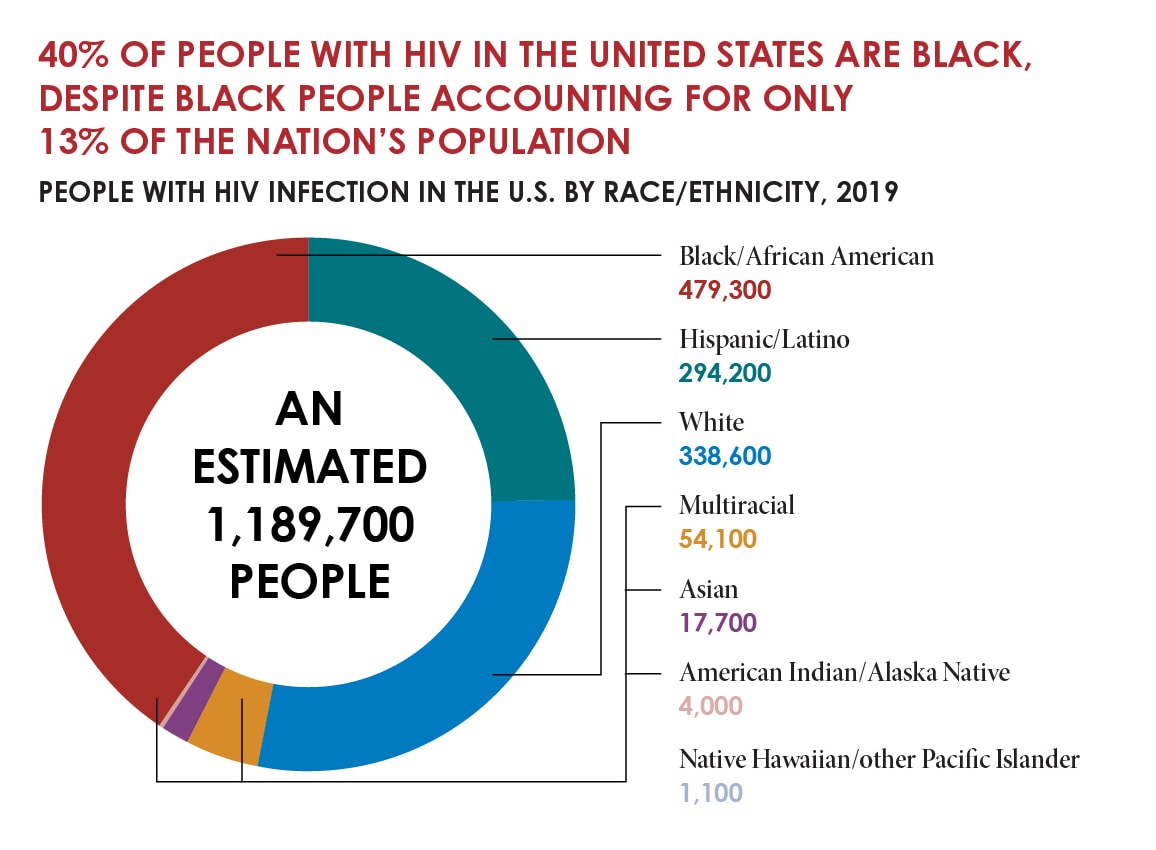
The donut graph shows that of the estimated 1,189,700 people with HIV in the U.S. in 2019, 479,300 were Black/African American, 294,200 were Hispanic/Latino, 338,600 were White, 54,100 were multiracial, 17,700 were Asian, 4,000 were American Indian/Alaska Native, and 1,100 were Native Hawaiian/other Pacific Islander.

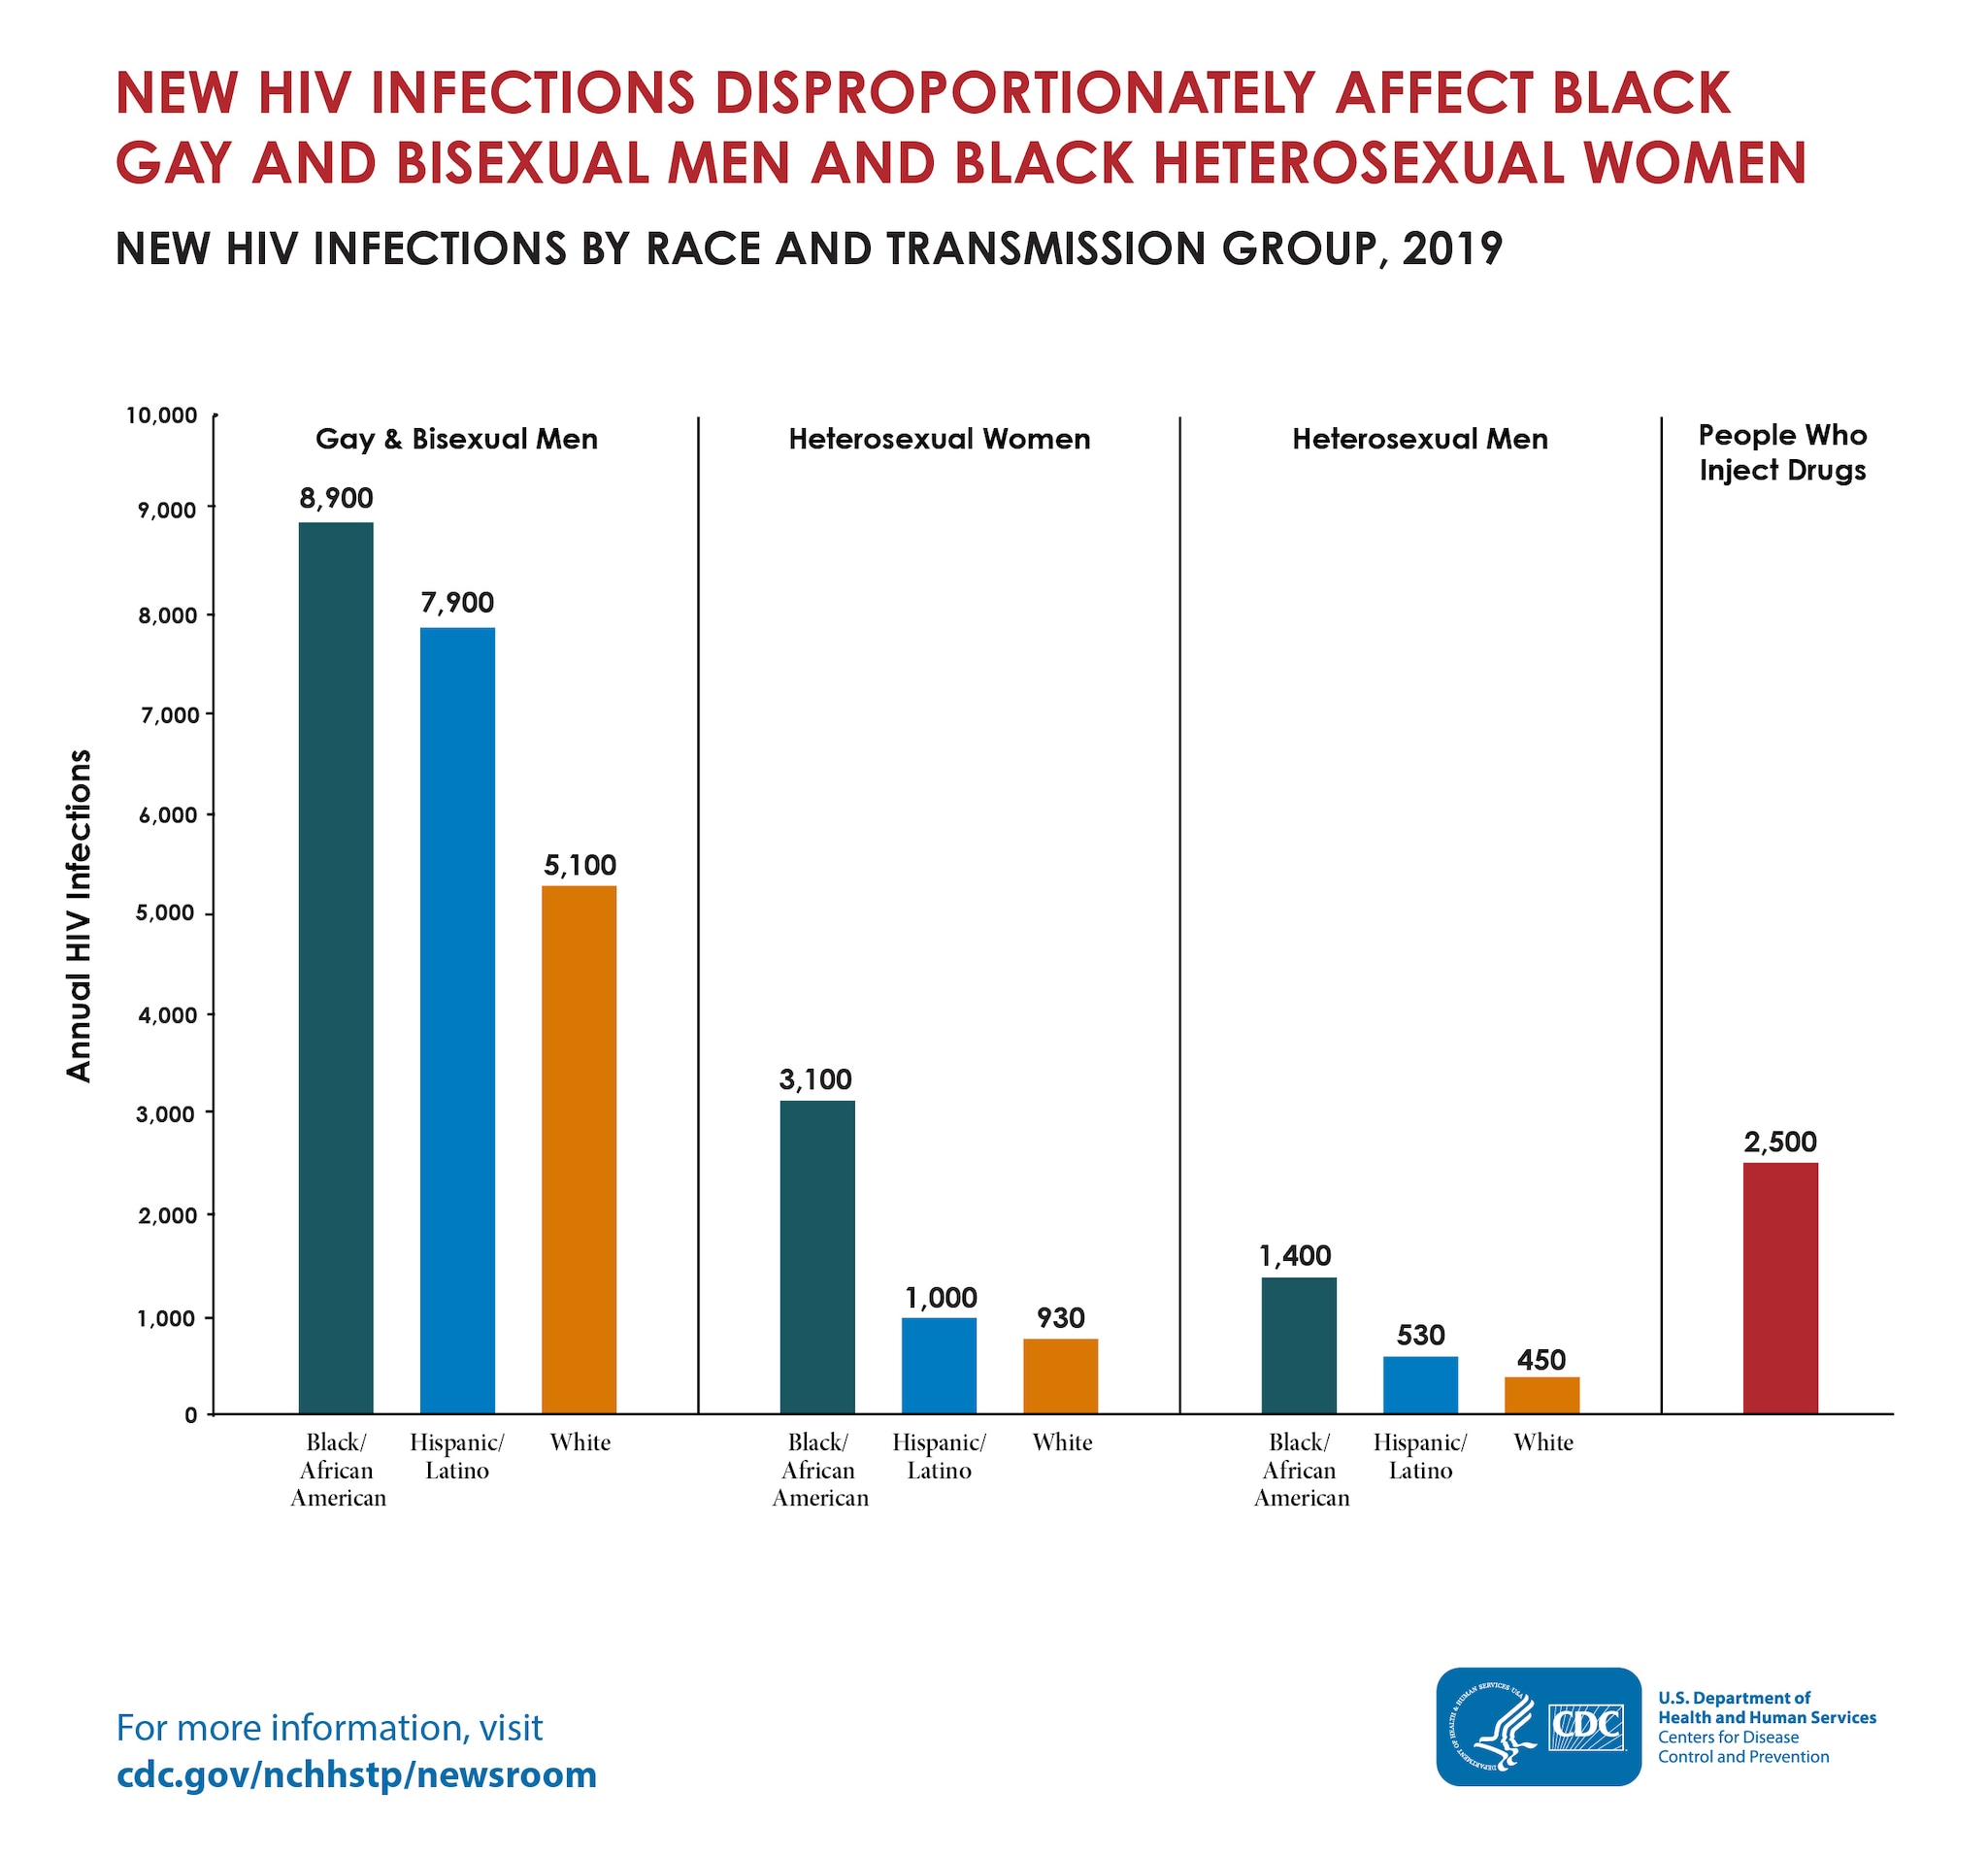
The bar graph shows that in the U.S.in 2019, there were an estimated 8,900 new HIV infections among Black/African American gay and bisexual men; 7,900 among Hispanic/Latino gay and bisexual men; 5,100 among White gay and bisexual men; 3,100 among Black/African American heterosexual women; 1,000 among Hispanic/Latina heterosexual women; 930 among White heterosexual women; 1,400 among Black/African American heterosexual men; 530 among Hispanic/Latino heterosexual men; 450 among White heterosexual men; and 2,500 among people who inject drugs.
")
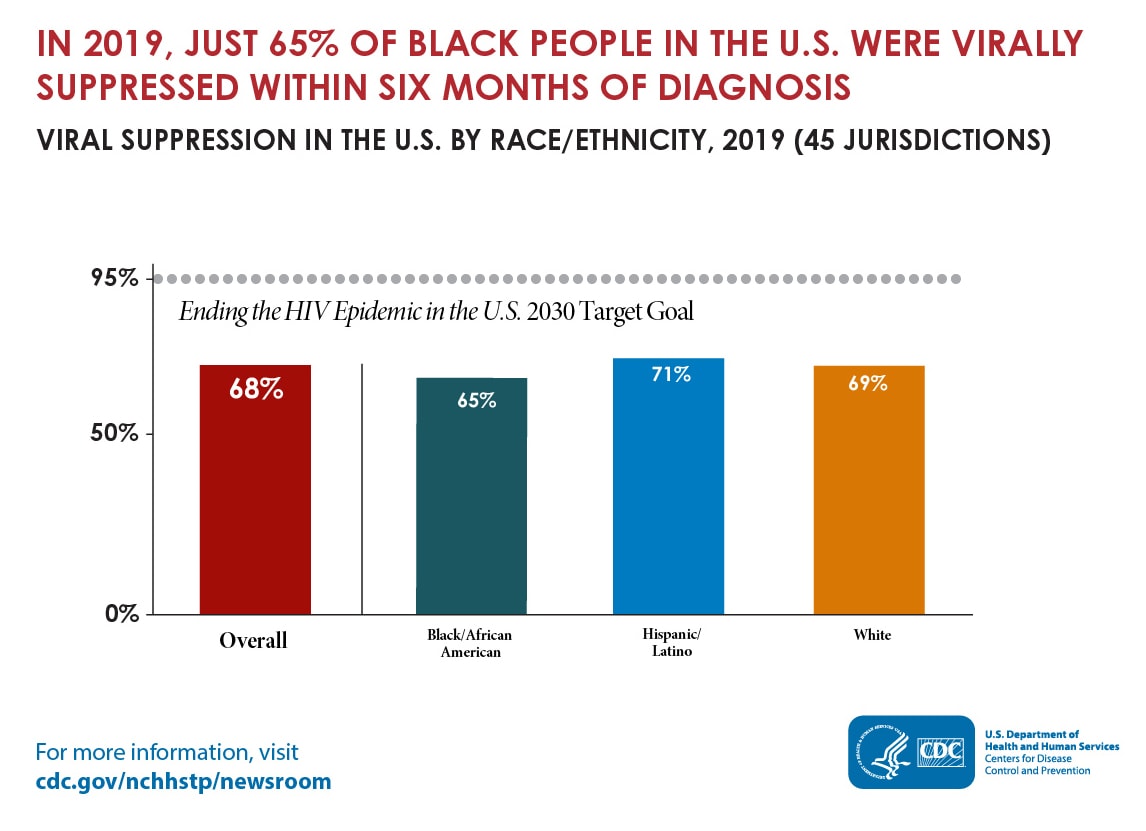
The bar graph shows that in 2019, 68% of people in the U.S. were virally suppressed. 65% of Black/African American people, 71% of Hispanic/Latino people, and 69% of White people were virally suppressed.
")
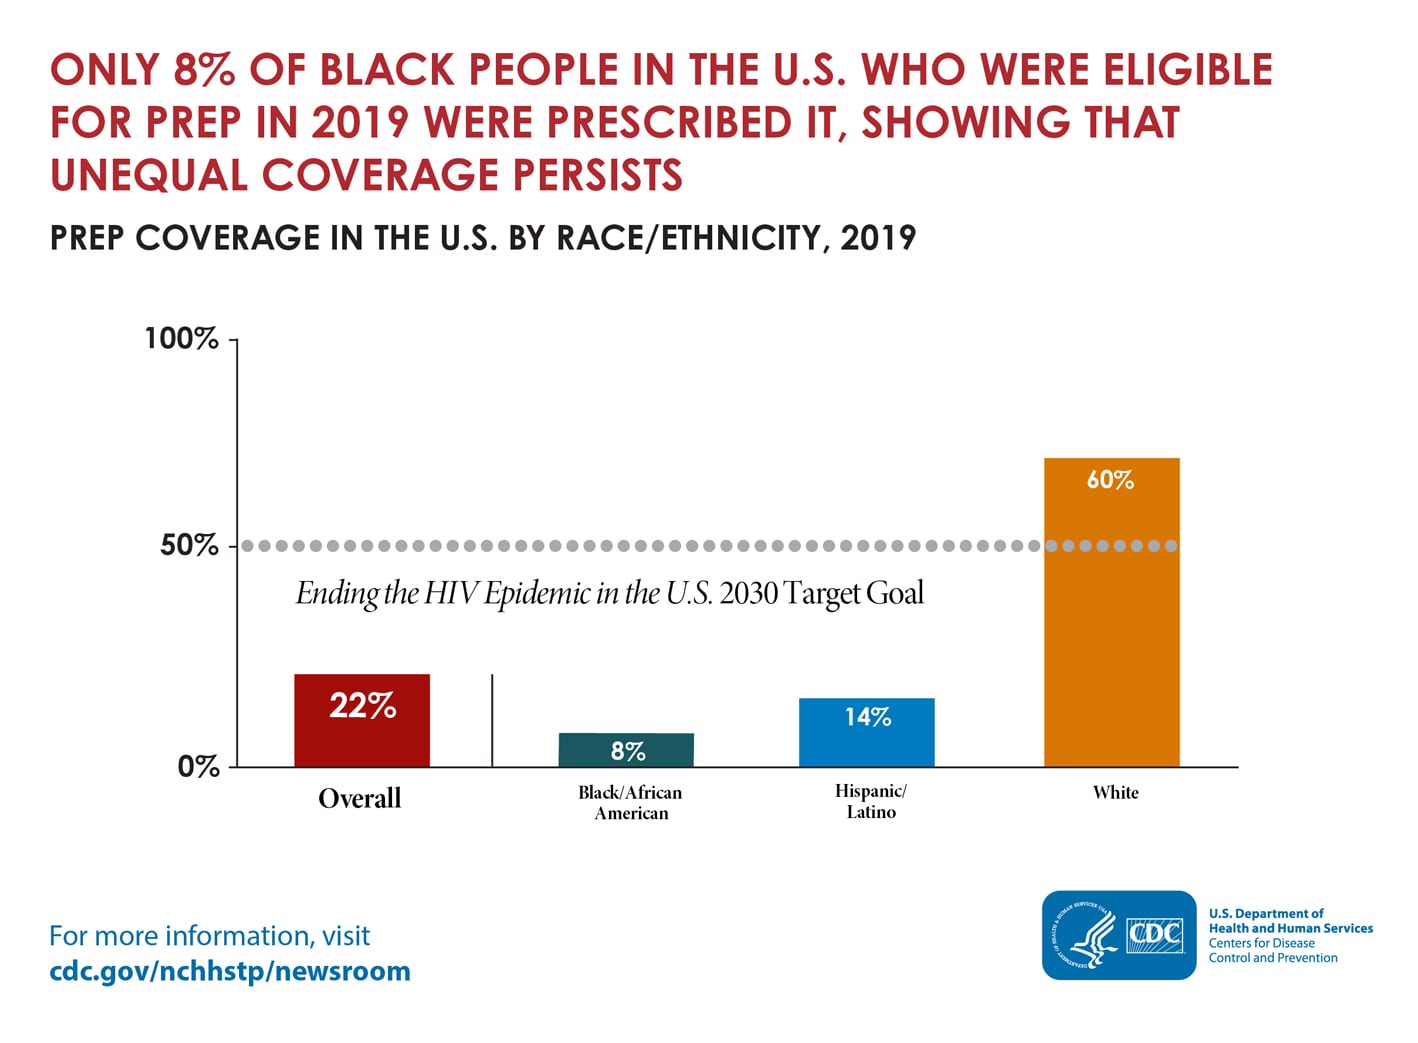
The bar graph shows that in 2019, 22% of people in the U.S. who were eligible for PrEP were prescribed it. The bar graph also shows that 8% of Black/African American people, 14% of Hispanic/Latino people, and 60% of White people who were eligible for PrEP were prescribed it.