Key Graphics on Trends Among High School Students from CDC’s National Youth Risk Behavior Survey (YRBS), 1991-2011
Click on a graphic to view it in high resolution.
Images and graphics highlighting major findings of the report are available for download. These high-resolution, public domain images are ready to print in your publication.
These images are in the public domain and are thus free of any copyright restrictions. As a matter of courtesy, we request that the content provider be credited and notified of any public or private usage of an image.
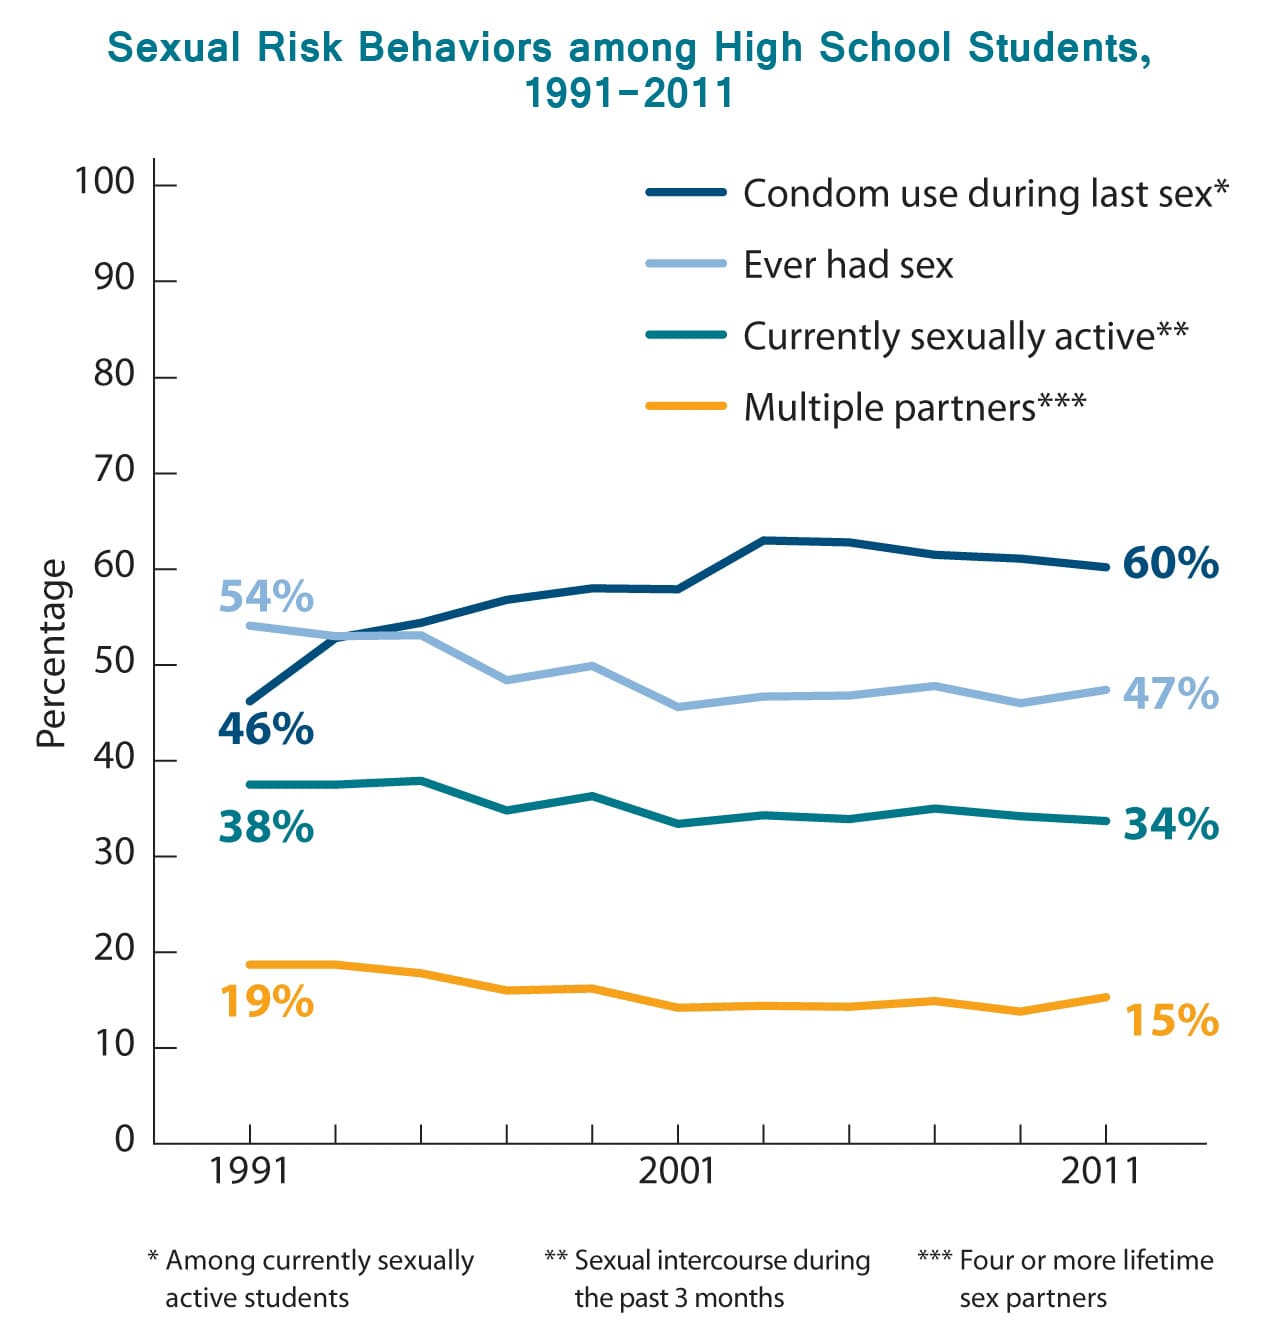 image iconimage icon[JPG - 323 KB]
This is a graphic showing Sexual Risk Behaviors among High School Students, 1991-2011 View High Resolution Versionimage icon
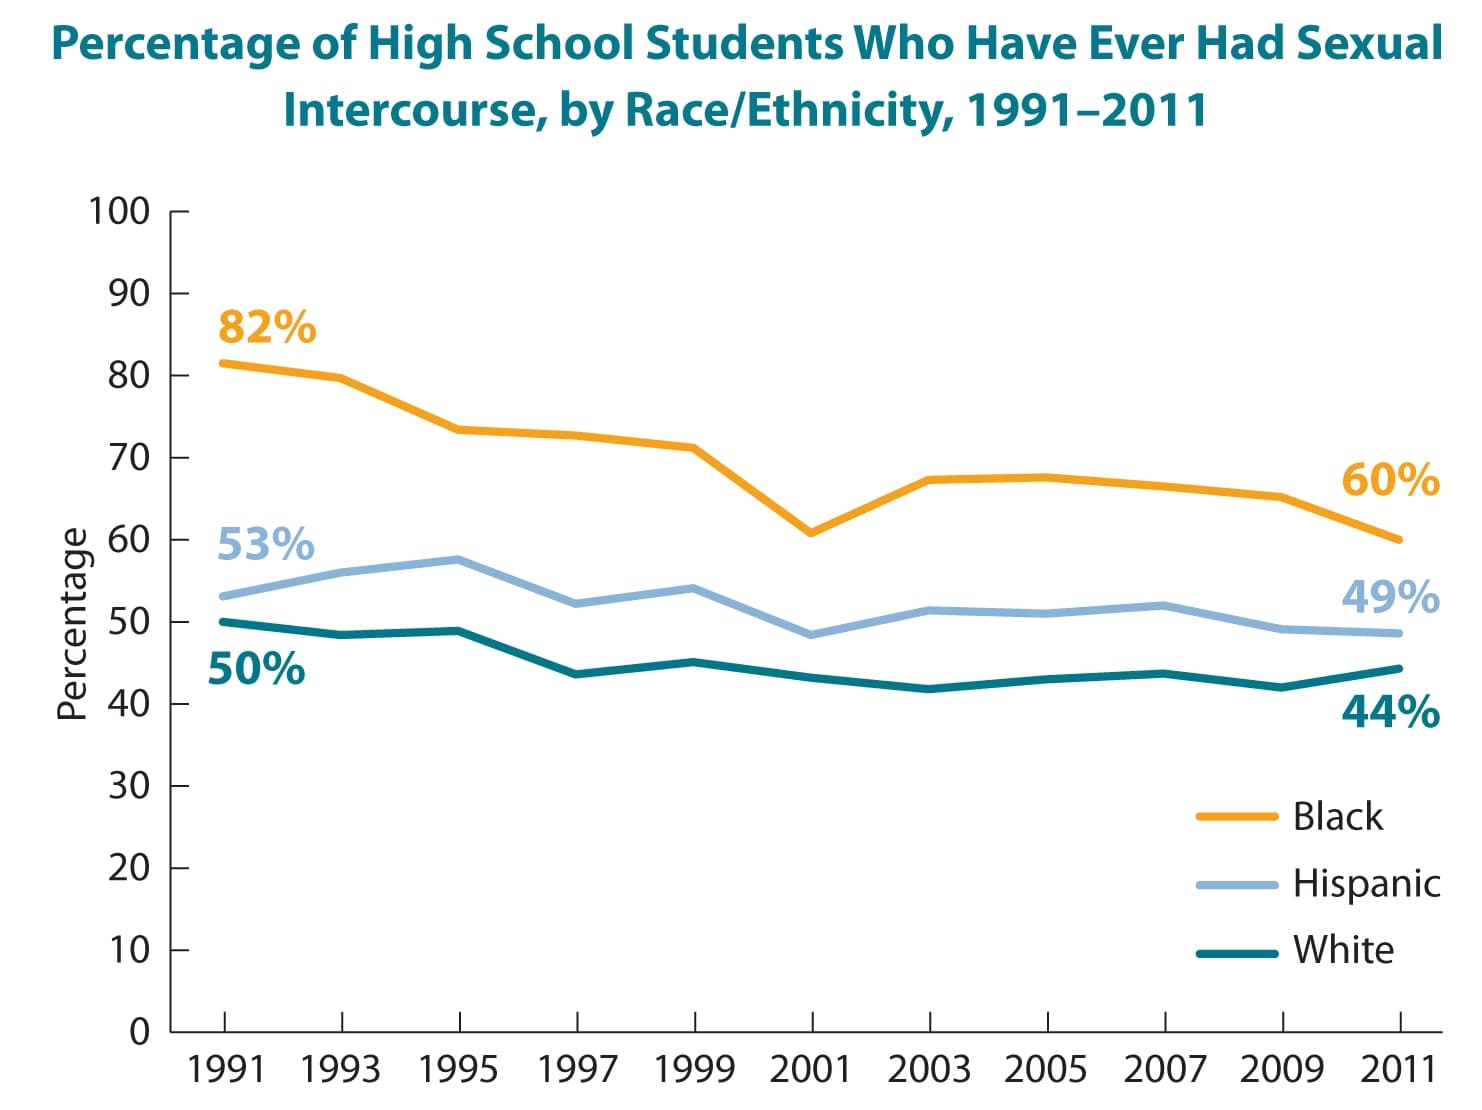 image iconimage icon[JPG - 338 KB]
This is a graphic showing Percentage of High School Students Who Have Ever Had Sexual Intercourse, by Race/Ethnicity, 1991-2011. View High Resolution Versionimage icon
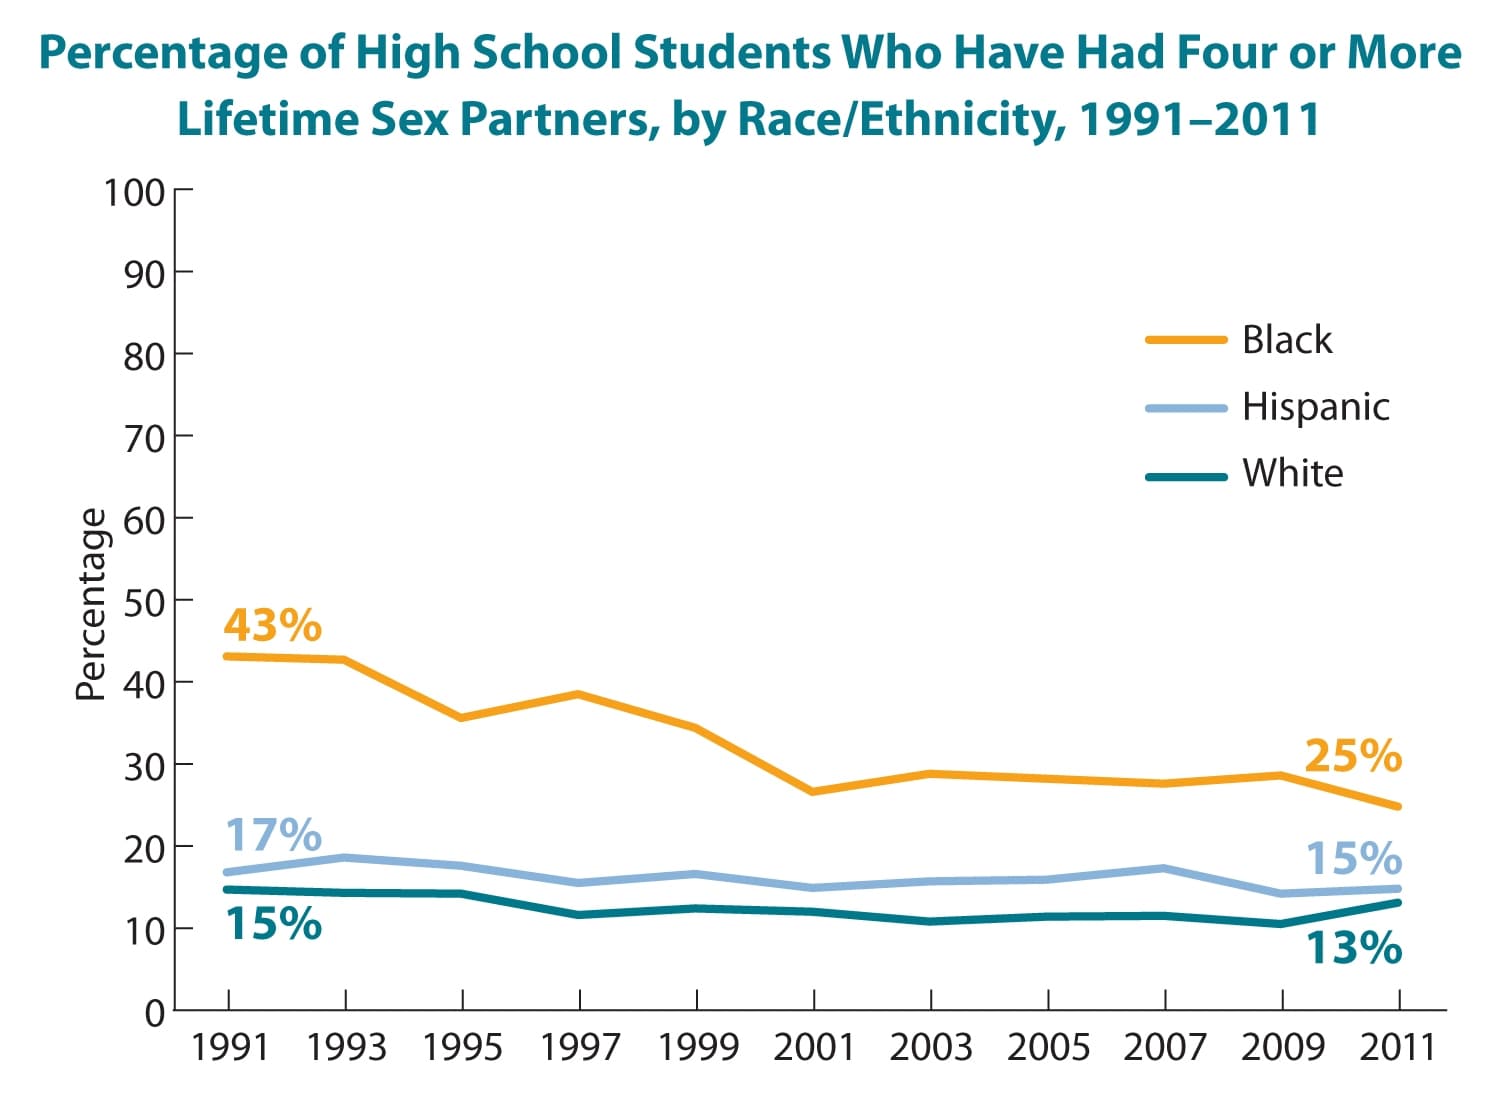 image iconimage icon[JPG - 336 KB]
This is a graphic showing Percentage of High School Students Who Have Had Four or More Lifetime Sex Partners, by Race/Ethnicity, 1991 vs. 2011. View High Resolution Versionimage icon
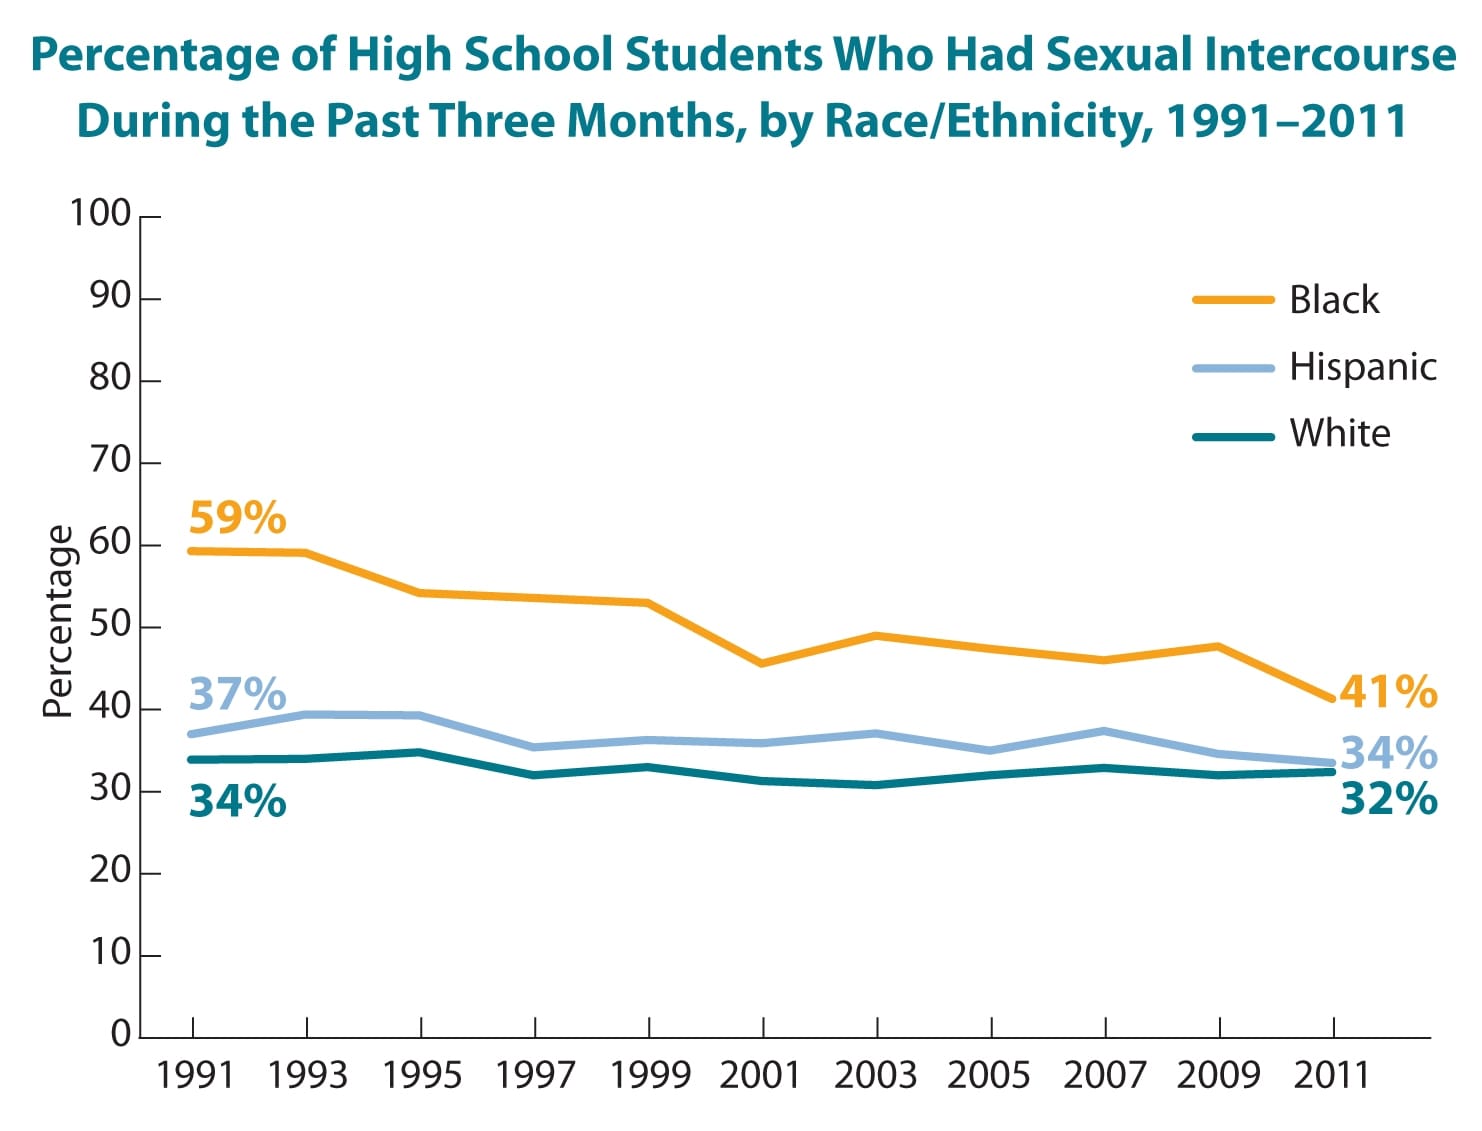 image iconimage icon[JPG - 346 KB]
This is a graphic showing Percentage of High School Students Who Had Sexual Intercourse During the Past Three Months, by Race/Ethnicity, 1991 vs. 2011. View High Resolution Versionimage icon
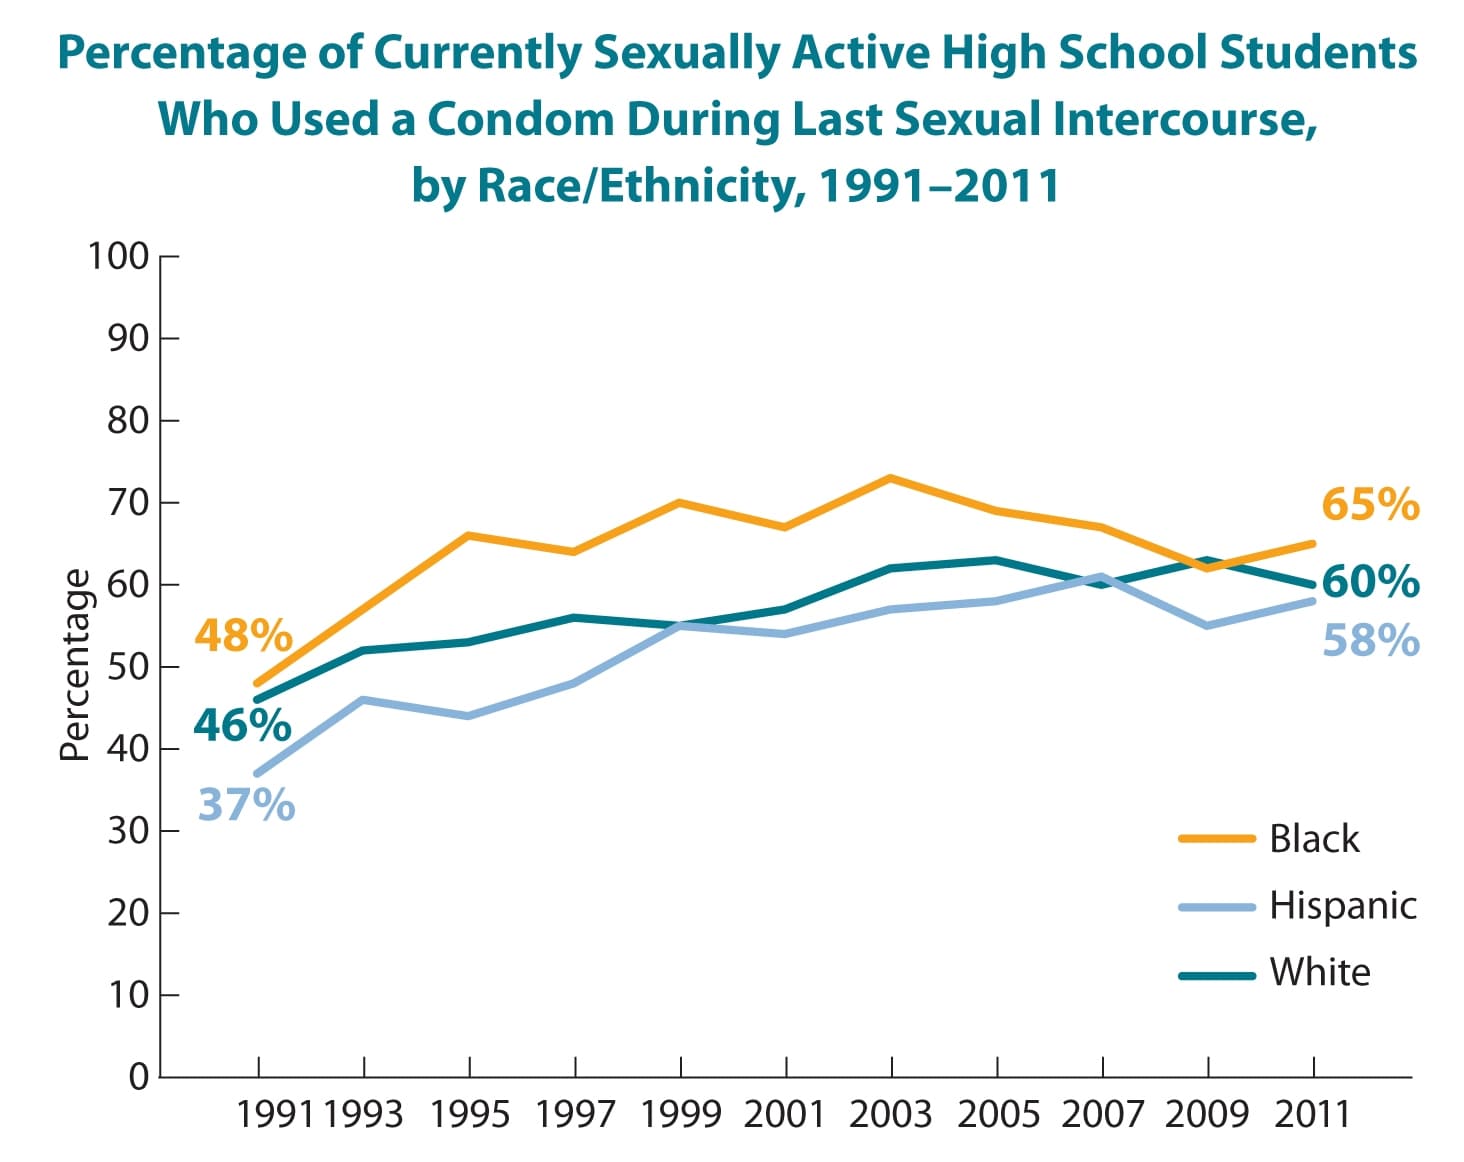 image iconimage icon[JPG - 380 KB]
This is a graphic showing Percentage of Currently Sexually Active High School Students Who Used a Condom During Last Sexual Intercourse, by Race/Ethnicity, 1991-2011. View High Resolution Versionimage icon