Phases 3 & 4: Analyze and Report CASPER Data

Enter Data
Data from the questionnaire can be entered into any statistical software package that allows for multistage sample design weighting. We recommend using Epi Info™, which is user-friendly, does not require computer permissions for download, and is available free of charge. For tutorials and guidance on Epi Info™, visit https://www.cdc.gov/epiinfo/index.html. Data from the tracking form can be entered into any spreadsheet such as Microsoft Excel.
Clean and Weight Data
Data entry, cleaning, and processing are necessary to ensure the highest quality data for analysis. See the CASPER Toolkit, Section 4.1, Appendix L, and Appendix M for details and recommended steps. Once data are merged and cleaned, each household for whom an interview is completed is assigned a weight that is based on the household’s probability of selection to obtain population estimates. Analysis conducted without weighting will not represent the entire sampling frame; however, you must reach 80% completion (n=168 for a traditional CASPER) to conduct weighted analysis.
Once a minimum of 80% completion is obtained, use the following weight formula:

The numerator is the total number of households in the selected sampling frame and will be the same for every assessed household.
The denominator will potentially differ for each assessed household. If sampling has been 100% successful and interviews were completed in seven households for all 30 clusters, the denominator would be 210 (i.e., 7 * 30). Likely, obtaining seven interviews in each cluster will not be possible and, therefore, the denominator will differ depending on the cluster in which the household was selected.
- Note: Households from the same cluster will have the same weight, but weights will differ between clusters.
- If a cluster is selected more than once, the number of completed interviews would be divided by the number of times the cluster was selected so the “Completed Interviews” column is always a number between 1 and 7.
See the CASPER Toolkit, Section 4.2 for more information.
Analyze the Tracking Form
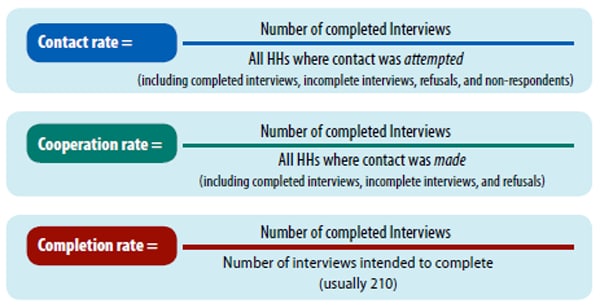
Calculating response rates helps indicate the representativeness of the sample to the population within the sampling frame. Enter data from the tracking form in a spreadsheet for calculation of the contact, cooperation, and completion response rates.
- The contact rate (the percentage of households that complete an interview after contact is attempted), indicates the representativeness of the sample to the population, with lower rates indicating that the field teams had to attempt interviews at many households to obtain the results.
- The cooperation rate (the percentage of households that complete an interview after contact has been made), represents both the eligibility and willingness of the community to complete the CASPER interview.
- The completion rate (the percentage of completed interviews compared to the ideal number of completed interviews), represents how close interview teams came to completing the goal of 210 interviews. A completion rate below 80% (n=168) represents an unacceptably low number to represent the sampling frame.
To compile the tracking form data, tally the responses in each row on the tracking form based on the final designation of the household (e.g., if both “no answer” and “door was answered” for a single household was selected since the interviewer had to return to the household, the final designation of “door was answered” would be entered into the spreadsheet). Below are the formulas for the three response rates:
For more information, please see please see CASPER Toolkit, Section 4.
Conduct the Analysis
Once weights are assigned, weighted frequencies, percentages, and 95% confidence intervals can be calculated for each of the interview questions using Complex Sample Frequencies in Epi Info. Weighted analysis should only be presented for cells with 5 or more observations; those cells with less than 5 observations should not be shown in final presentation of results. Applying weights provides projected estimates that can be generalized to every household in the sampling frame.
Remember
- Weighted analysis does not account for any changes that may occur in the number of households between the time of the census and the time of the CASPER. Despite attempts to present accurate estimates, the frequencies reported may lack precision.
- CASPER data are designed for weighted frequencies, percentages, and 95% confidence intervals. Any further analysis should be limited and should involve consulting with a statistician familiar with survey cluster sampling methodology or reaching out to CDC SMEs.
Share CASPER Findings
Disseminating findings is a vital component of conducing a CASPER. The preliminary findings should be shared with leadership and key stakeholders within 36 hours of the completion of data collection. Typically, this is done through a slide presentation to promote discussion of key findings, implementation of any recommendations, next steps, and lessons learned. Click here for an example of a preliminary presentation.
- Begin the process early
- Several aspects of the presentation and report can be completed during the preparation phase of the CASPER—deciding who will be in charge, gathering background information, and creating table shells. Completing such aspects early will ensure a more timely report.
- Distribute a final report widely to all interested parties
- It may take weeks or months to write the report and get appropriate approvals before it can be shared, which is why the preliminary presentation is important.
- Consider other methods for dissemination
- Other methods for disseminating findings (e.g., bulleted list of highlights, fact sheet with infographics, press release) should also be considered in conjunction with the report to ensure varying audiences get information in an easy, relevant, format. See CASPER Resources for examples.
For more information, please see please see CASPER Toolkit, Section 5.
Remember that CDC is available for technical assistance and support throughout all phases of a CASPER.