Plotting & Interpreting BMI-for-Age
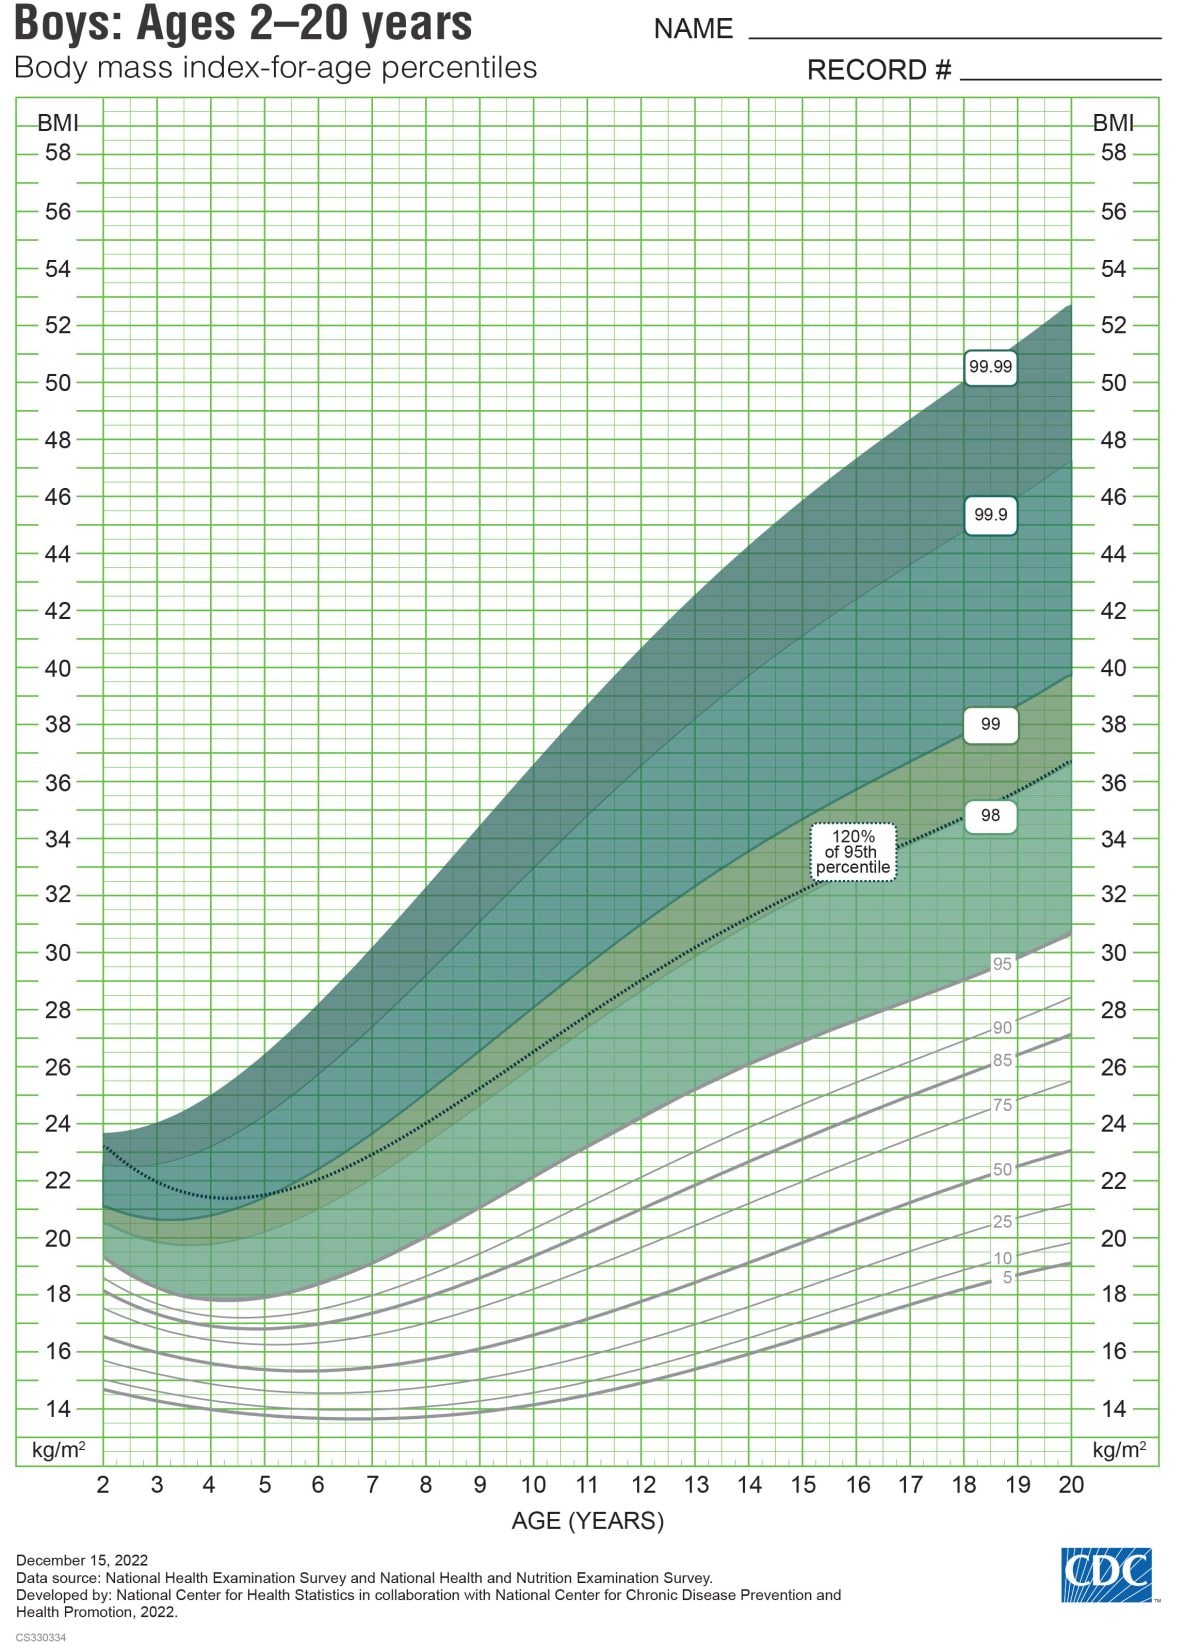
BMI-for-age can be plotted on growth charts, such as the one shown to the right. Age in years is on the x-axis; BMI is on the y-axis.
Percentile curves on the growth charts indicate the BMI-for-age percentile, which is the relative position of a child’s BMI to children of the same sex and age from the reference population used to create the growth charts.
In children aged 2 to 20, BMI categories are based on BMI-for-age percentiles and are defined as follows:
| BMI Category | BMI Range |
|---|---|
| Underweight | <5th percentile |
| Healthy Weight | 5th to < 85th percentile |
| Overweight | 85th to < 95th percentile |
| Obesity | ≥ 95th percentile |
| Severe Obesity | ≥ 120% of the 95th percentile or ≥ 35 kg/m2 |
Use the following case examples to practice plotting and interpreting BMI:
Connect with Nutrition, Physical Activity, and Obesity
