ADHD Throughout the Years
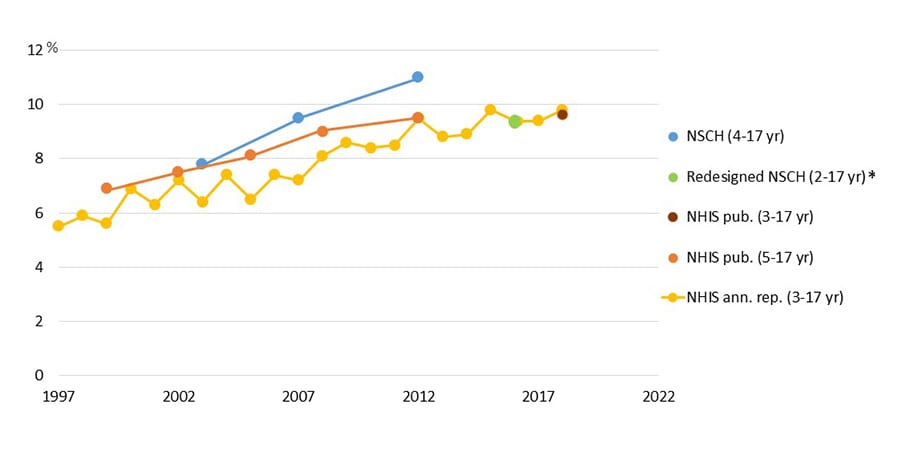
The percent of children estimated to have ADHD has changed over time and its measurement can vary. The first national survey that asked parents about ADHD was completed in 1997. Since that time, there has been an upward trend in national estimates of parent-reported ADHD diagnoses across different surveys, using different age ranges. It is not possible to tell whether this increase represents a change in the number of children who have ADHD, or a change in the number of children who were diagnosed. However, the most recent estimates are consistent with previous estimates. Future data will show whether the upward trend across the two decades is leveling out.
ADHD diagnosis throughout the years: Estimates from published nationally representative survey data
(Percent of children with a parent-reported ADHD diagnosis)
| Years | NSCH (4-17 yr) | Redesigned NSCH (2-17 yr) | NHIS pub. (3-17 yr) | NHIS pub. (5-17 yr) | NHIS ann. rep. (3-17 yr) |
|---|---|---|---|---|---|
| 1997 | 5.5 | ||||
| 1998 | 5.9 | ||||
| 1999 | 6.9 | 5.6 | |||
| 2000 | 6.9 | ||||
| 2001 | 6.3 | ||||
| 2002 | 7.5 | 7.2 | |||
| 2003 | 7.8 | 6.4 | |||
| 2004 | 7.4 | ||||
| 2005 | 8.1 | 6.5 | |||
| 2006 | 7.4 | ||||
| 2007 | 9.5 | 7.2 | |||
| 2008 | 9 | 8.1 | |||
| 2009 | 8.6 | ||||
| 2010 | 8.4 | ||||
| 2011 | 8.5 | ||||
| 2012 | 11 | 9.5 | 9.5 | ||
| 2013 | 8.8 | ||||
| 2014 | 8.9 | ||||
| 2015 | 9.8 | ||||
| 2016 | 9.4 | 9.4 | |||
| 2017 | 9.4 | ||||
| 2018 | 9.6 | 9.8 |
NHIS: National Health Interview Survey, personal interview data
- NHIS annual report: estimates include children 3-17 years of age [Data for 1997-2012] [Data for 2013-2016]
- NHIS publications: estimates aggregate 3 years of data and include children 5-17 years of age until 2012, now 3-17 years. [Data for 1998-2009] [Data for 2011-2013] [Data for 2015-2018]
NSCH: National Survey of Children’s Health; telephone survey data; estimates include children 4-17 years of age [Read key findings]
*Redesigned NSCH: Now an online and mail survey; estimate includes children 2-17 years of age. Because the 2016 NSCH survey used different methods, the estimate is not directly comparable with estimates based on previous NSCH data [Read key findings]
Note: Age ranges for published data vary. In previous decades, the focus of information collected on ADHD generally was on school age children; this has been expanded to include preschool ages as young as 2 years of age. Because the number of children with ADHD increases with age, estimates that include younger children are likely to be somewhat lower than those that focus on older children.
History
Estimates for the percent of children in the population who have ADHD vary widely across time and across survey methods. A historical view can provide necessary context to understand changes in the epidemiology of ADHD. The way that ADHD is diagnosed has changed over time, so the difference in these numbers is likely to be influenced by variations in how the diagnostic criteria were applied. In addition, there were differences in the demographic characteristics of the samples used to calculate the estimates. It is also possible that the samples were exposed to factors that affect ADHD, but until more is known about these factors, it is not possible to know whether changes in these factors explain some of the variation. Perhaps relatedly, the number of FDA-approved ADHD medications increased noticeably since the 1990s, after the introduction of long-acting formulations.
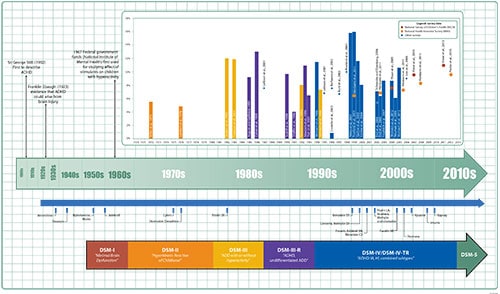
The historical timeline below shows
- Estimates from studies across the years (until 2013) for the percent of U.S. children with ADHD.
- How the criteria used to diagnose the condition have changed over time.
- The approval of medication treatments by the Food and Drug Administration (FDA) beginning with Benzedrine in 1936.
Timeline of ADHD diagnostic criteria, prevalence, and treatment
View and print larger version [PDF – 57 KB]

